Effects of Cultivar Shifts on Winter Wheat Phenology Under Two Parameterization Methods
-
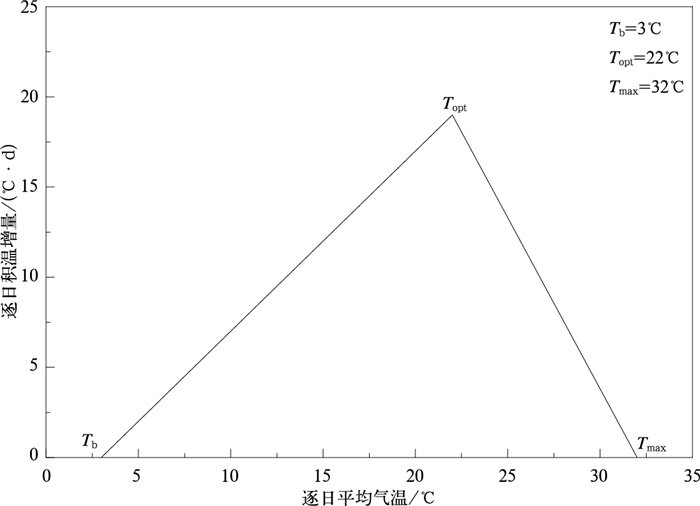
摘要: 利用华北平原47个农业气象观测站1986—2010年冬小麦的品种、发育期观测资料和同期气象数据,基于常用的发育期模型,对两种参数化方案下品种变化对发育期影响的特征进行研究。其中参数化方案1采用固定的三基点温度,参数化方案2通过循环优化得到三基点温度。结果表明:在华北平原冬小麦品种变化频繁的情况下,两种参数化方案均能较好地对返青-抽穗期与抽穗-成熟期的模拟过程进行参数化;两种参数化方案均认为品种变化使返青-抽穗期和抽穗-成熟期日数有延长趋势,但不同参数化方案的趋势值存在较大差异,且参数化方案1模拟的趋势值总是高于参数化方案2。此外,不同的参数化方案也会使模拟的趋势值在区域上的分布规律发生变化。研究表明:不同参数化方案的使用会对模拟结果产生明显影响,因此,在量化品种变化对发育期影响时,需关注不同参数化方案对结果的影响,以及由此带来的不确定性。Abstract: Phenology and growth duration of crops have been significantly changed by the combined effects of climate change and cultivar shifts. For the need of accurately evaluating the response of crops phenology to future climate changes, effects of cultivar shift on phenology and its quantitative simulation has become a research hotspot. However, most recent studies are based on the single parameterization method, with less attention paid to effects of different parameterization methods, leading to a certain degree of assessment uncertainty.Winter wheat phenology data and daily meteorological data in 47 agrometeorological observation stations in North China Plain during 1986-2010 are collected. Based on these datasets, a most commonly used phenology model is used to quantize effects of cultivar shifts on phenology, and effects of two parameterization methods on simulated results are also analyzed. The first method uses fixed three cardinal temperatures (Method 1), while in the second method (Method 2) three cardinal temperatures are obtained by minimizing the root mean square error of simulated phenology.Results show that winter wheat critical phenology in North China Plain changes significantly under the frequently change of cultivar during study period. Both two methods perform well in parameterizing the simulation of durations from turning green to heading and from heading to maturity in the winter wheat simulation. The growth duration is prolonged by cultivar shift in the duration from turning green to heading and the duration from heading to maturity, though values given by Method 1 are higher. Both methods indicate effects of cultivar shifts on the duration from heading to maturity is higher than those on the duration from turning green to heading. In addition, the range of simulated trends and their regional distribution are also affected by the different parameterization method used. Among them, the difference of simulation results between two methods in the duration from turning green to heading is higher than the duration from heading to maturity. In the regional distribution, the difference of simulation results between two methods is bigger in the duration from heading to maturity. It verifies that simulation results are potentially affected by parameterization method. Therefore, the selection of parameterization methods and uncertainties introduced by different methods should be carefully considered.
-
Key words:
- cultivar shifts;
- phenology;
- parameterization method;
- uncertainty
-
图 5 1986—2010年华北平原冬小麦抽穗期日期(a), 成熟期日期(b), 返青-抽穗期日数(c), 抽穗-成熟期日数(d)观测值和两种参数化方案下模拟值的区域平均值及变化趋势
(、和分别为实测值、参数化方案1和参数化方案2模拟值; 、和分别为实测值、参数化方案1和参数化方案2模拟值随时间变化趋势; *表示达到0.01显著性水平)
Fig. 5 Regional mean and trends of observed and simulated heading date(a), maturity date(b), length of turning green to heading(c), heading to maturity(d) of winter wheat in North China Plain under two methods from 1986 to 2010
(, and indicate observed and simulated value of Method 1 and Method 2; , and indicate trends of observed and simulated value of Method 1 and Method 2; *denotes passing the test of 0.01 level)
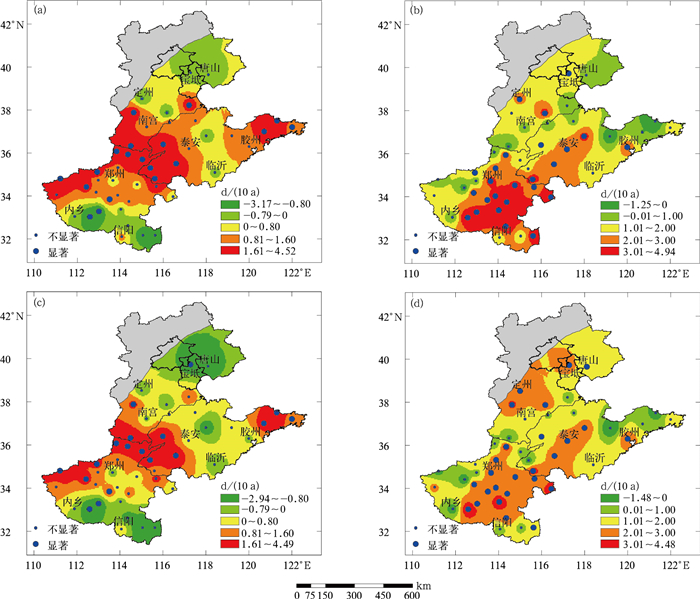
图 6 两种参数化方案下1986—2010年冬小麦模拟误差的时间趋势的空间分布
(a)参数化方案1,返青-抽穗期,(b)参数化方案1,抽穗-成熟期,(c)参数化方案2,返青-抽穗期,(d)参数化方案2,抽穗-成熟期
Fig. 6 Spatial distribution of trends of winter wheat simulated error from 1986 to 2010 under two methods
(a)Method 1, turning green to heading, (b)Method 1, heading to maturity, (c)Method 2, turning green to heading, (d)Method 2, heading to maturity
表 1 两种参数化方案对不同发育阶段模拟结果的比较
Table 1 Comparisons of simulated results of different development stage under two methods
发育阶段 参数化方案 相对误差范围/% 平均绝对偏差/d 均方根误差/d 返青-抽穗期 1 -5.10~7.27 2.11 2.69 2 -4.24~5.31 1.48 2.04 抽穗-成熟期 1 -3.12~4.37 1.89 2.41 2 -2.48~3.12 0.79 1.24 表 2 1986—2010年华北平原冬小麦主要发育期随时间的变化趋势
Table 2 Trends of major winter wheat phenologies over year in North China Plain from 1986 to 2010
发育阶段 负趋势占比/% 显著负趋势占比/% 正趋势占比/% 显著正趋势占比/% 平均趋势/(d/(10 a)) 返青期 46.81 6.38* 53.19 8.51* 0.33 抽穗期 95.74 59.57* 4.26 0.00* -3.13 成熟期 82.98 34.04* 17.02 2.13* -1.45 返青-抽穗期 89.36 44.68* 10.64 2.13* -3.46 抽穗-成熟期 17.02 0.00* 82.98 51.06* 1.68 注:*表示达到0.05显著性水平。 表 3 两种参数化方案下品种变化对不同发育阶段日数的影响
Table 3 Effect of cultivar shifts on the length of different stages in simulation under two methods
参数化方案 返青-抽穗期 抽穗-成熟期 总影响/(d/(10 a)) 影响值/(d/(10 a)) 影响占比/% 影响值/(d/(10 a)) 影响占比/% 1 1.02* 34.8 1.91** 65.2 2.93 2 0.68 28.2 1.73** 71.8 2.41 注:**,*分别表示达到0.01和0.05显著性水平。 -
[1] Fu Y S H, Zhao H F, Piao S L, et al.Declining global warming effects on the phenology of spring leaf unfolding.Nature, 2015, 526(7571):104-107. doi: 10.1038/nature15402 [2] 穆佳, 赵俊芳, 郭建平.近30年东北春玉米发育期对气候变化的响应.应用气象学报, 2014, 25(6):680-689. doi: 10.11898/1001-7313.20140604 [3] Garciamozo H, Galan C, Alcazar P, et al.Trends in grass pollen season in southern Spain.Aerobiologia, 2010, 26(2):157-169. doi: 10.1007/s10453-009-9153-3 [4] Tao F L, Zhang Z, Shi W J, et al.Single rice growth period was prolonged by cultivars shifts, but yield was damaged by climate change during 1981-2009 in China, and late rice was just opposite.Global Change Biology, 2013, 19:3200-3209. doi: 10.1111/gcb.2013.19.issue-10 [5] Zhang T Y, Huang Y, Yang X G.Climate warming over the past three decades has shortened rice growth duration in China and cultivar shifts have further accelerated the process for late rice.Global Change Biology, 2013, 19(2):563-570. doi: 10.1111/gcb.2012.19.issue-2 [6] He L, Asseng S, Zhao G, et al.Impacts of recent climate warming, cultivar changes, and crop management on winter wheat phenology across the Loess Plateau of China.Agricultural and Forest Meteorology, 2015, 200:135-143. doi: 10.1016/j.agrformet.2014.09.011 [7] Holzkämper A, Calanca P, Honti M, et al.Projecting climate change impacts on grain maize based on three different crop model approaches.Agricultural and Forest Meteorology, 2015, 214-215;219-230. [8] Sacks W J, Kucharik C J.Crop management and phenology trends in the U.S. Corn Belt: Impacts on yields, evapotranspiration and energy balance.Agricultural and Forest Meteorology, 2011, 151(7):882-894. doi: 10.1016/j.agrformet.2011.02.010 [9] Li K N, Yang X G, Tian H Q, et al.Effects of changing climate and cultivar on the phenology and yield of winter wheat in the North China Plain.International Journal of Biometeorology, 2016, 60:21-32. doi: 10.1007/s00484-015-1002-1 [10] Mo F, Sun M, Liu X Y, et al.Phenological responses of spring wheat and maize to changes in crop management and rising temperatures from 1992 to 2013 across the Loess Plateau.Field Crops Research, 2016, 196:337-347. doi: 10.1016/j.fcr.2016.06.024 [11] 郭建平.气候变化对中国农业生产的影响研究进展.应用气象学报, 2015, 26(1):1-11. doi: 10.11898/1001-7313.20150101 [12] Liu Y, Wang E L, Yang X G, et al.Contributions of climatic and crop varietal changes to crop production in the North China Plain, since 1980s.Global Change Biology, 2010, 16(8):2287-2299. [13] Tao F L, Zhang S, Zhang Z, et al.Maize growing duration was prolonged across China in the past three decades under the combined effects of temperature, agronomic management, and cultivar shift.Global Change Biology, 2014, 20(12):3686-3699. doi: 10.1111/gcb.12684 [14] Kumudini S, Andrade F H, Boote K J, et al.Predicting maize phenology: Intercomparison of functions for developmental response to temperature.Agronomy Journal, 2014, 106(6):2087-2097. doi: 10.2134/agronj14.0200 [15] Bonhomme R, Derieux M, Edmeades G O.Flowering of diverse maize cultivars in relation to temperature and photoperiod in multilocation field trials.Crop Science, 1994, 34(1):156-164. doi: 10.2135/cropsci1994.0011183X003400010028x [16] Wang N, Wang J, Wang E, et al.Increased uncertainty in simulated maize phenology with more frequent supra-optimal temperature under climate warming.European Journal of Agronomy, 2015, 71:19-33. doi: 10.1016/j.eja.2015.08.005 [17] 帅细强, 陆魁东, 黄晚华.不同方法在湖南省早稻产量动态预报中的比较.应用气象学报, 2015, 26(1):103-111. http://qikan.camscma.cn/jams/ch/reader/key_query.aspx# [18] 杨建莹, 梅旭荣, 刘勤, 等.气候变化背景下华北地区冬小麦生育期的变化特征.植物生态学报, 2011, 35(6):623-631. http://www.cnki.com.cn/Article/CJFDTOTAL-ZWSB201106006.htm [19] 姚凤梅, 秦鹏程, 张佳华, 等.基于模型模拟气候变化对农业影响评估的不确定性及处理方法.科学通报, 2011, 56(8):547-555. http://www.cnki.com.cn/Article/CJFDTOTAL-KXTB201108003.htm [20] Supit I, Hooijer A A, Van Diepen C A.System Description of the WOFOST 6.0 Crop Growth Simulation Model.Joint Research Center, Commission of the European Communities, 1994. [21] Jones J W, Hoogenboom G, Porter C H, et al.The DSSAT cropping system model.European Journal of Agronomy, 2003, 18:235-265. doi: 10.1016/S1161-0301(02)00107-7 [22] 马洁华, 刘园, 杨晓光, 等.全球气候变化背景下华北平原气候资源变化趋势.生态学报, 2010, 30(14):3818-3827. http://www.cnki.com.cn/Article/CJFDTOTAL-STXB201014021.htm [23] 谭方颖, 王建林, 宋迎波, 等.华北平原近45年农业气候资源变化特征分析.中国农业气象, 2009, 30(1):19-24. http://www.cnki.com.cn/Article/CJFDTOTAL-ZGNY200901007.htm [24] 中华人民共和国国家统计局.中国统计年鉴—2015.北京:中国统计出版社, 2015. [25] 周广胜, 何奇瑾, 汲玉河.适应气候变化的国际行动和农业措施研究进展.应用气象学报, 2016, 27(5):527-533. doi: 10.11898/1001-7313.20160502 [26] 殷新佑.对预测作物发育的积温法的评价.作物学报, 1999, 25(4):474-482. http://www.cnki.com.cn/Article/CJFDTOTAL-XBZW199904012.htm [27] Aiken R M.Applying thermal time scales to sunflower development.Agronomy Journal, 2005, 97(3):746-754. doi: 10.2134/agronj2004.0181 [28] 姜会飞, 温德永.基于线性生长假设利用极端温度计算日积温的方法.中国农业大学学报, 2013, 18(1):82-87. http://www.cnki.com.cn/Article/CJFDTOTAL-NYDX201301011.htm [29] 杨月, 刘兵, 刘小军, 等.小麦生育期模拟模型的比较研究.南京农业大学学报, 2014, 37(1):6-14. doi: 10.7685/j.issn.1000-2030.2014.01.002 [30] 张帅, 陶福禄.水稻发育期模型研究进展.地理科学进展, 2012, 31(11):1485-1491. doi: 10.11820/dlkxjz.2012.11.009 [31] Supit I, van der Goot E.Updated system description of the WOFOST crop growth simulation model as implemented in the Crop Growth Monitoring System applied by the European Commission.[2017-01-01]. http://www.supit.net/. [32] 段若溪, 姜会飞.农业气象学.北京:气象出版社, 2002:80-81. [33] Porter J R, Gawith M.Temperatures and the growth and development of wheat:A review.European Journal of Agronomy, 1999, 10(1):23-36. doi: 10.1016/S1161-0301(98)00047-1 [34] Torrion J, Setiyono T D, Cassman K, et al.Soybean phenology simulation in the North-Central United States.Agronomy Journal, 2011, 103(6):1661-1667. doi: 10.2134/agronj2011.0141 [35] 曹秀霞, 安开忠, 蔡伟, 等.CERES-Rice模型在江汉平原的验证与适应性评价.中国农业气象, 2013, 34(4):447-454. http://www.cnki.com.cn/Article/CJFDTOTAL-ZGNY201304011.htm [36] 段春锋, 曹雯, 黄勇, 等.气象要素时间分辨率对参考作物蒸散估算的影响.农业工程学报, 2015, 31(14):158-164. doi: 10.11975/j.issn.1002-6819.2015.14.022 [37] Li Z G, Yang P, Tang H J, et al.Response of maize phenology to climate warming in Northeast China between 1990 and 2012.Regional Environmental Change, 2014, 14:39-48. doi: 10.1007/s10113-013-0503-x [38] Xiao D P, Qi Y Q, Shen Y J, et al.Impact of warming climate and cultivar change on maize phenology in the last three decades in North China Plain.Theoretical and Applied Climatology, 2015, 124(3-4):1-9. [39] 肖登攀, 陶福禄.过去30年气候变化对华北平原冬小麦物候的影响研究.中国生态农业学报, 2012, 20(11):1539-1545. http://www.cnki.com.cn/Article/CJFDTOTAL-ZGTN201211023.htm [40] 邱美娟, 宋迎波, 王建林, 等.山东省冬小麦产量动态集成预报方法.应用气象学报, 2016, 27(2):191-200. doi: 10.11898/1001-7313.20160207 [41] 秦鹏程, 刘敏, 万素琴, 等.不完整气象资料下基于作物模型的产量预报方法.应用气象学报, 2016, 27(4):407-416. doi: 10.11898/1001-7313.20160403 [42] 袁东敏, 尹志聪, 郭建平.SRES B2气候情景下东北玉米产量变化数值模拟.应用气象学报, 2014, 25(3):284-292. doi: 10.11898/1001-7313.20140304 [43] 姚凤梅, 秦鹏程, 张佳华, 等.基于模型模拟气候变化对农业影响评估的不确定性及处理方法.科学通报, 2011, 56(8):547-555. http://www.cnki.com.cn/Article/CJFDTOTAL-KXTB201108003.htm [44] 熊伟, 林而达, 杨婕, 等.作物模型区域应用两种参数校准方法的比较.生态学报, 2008, 28(5):2140-2147. http://www.cnki.com.cn/Article/CJFDTOTAL-STXB200805030.htm [45] 熊伟.CERES-Wheat模型在我国小麦区的应用效果及误差来源.应用气象学报, 2009, 20(1):88-94. doi: 10.11898/1001-7313.20090111 -


 设为首页
设为首页 加入收藏
加入收藏


 下载:
下载:


