Ensemble Forecast Experiments of PM2.5 Based on Multiple Boundary Layer Schemes in Tianjin
-
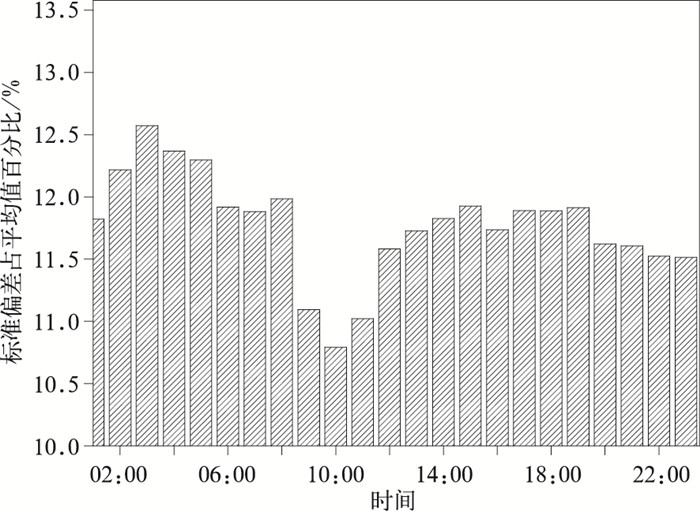
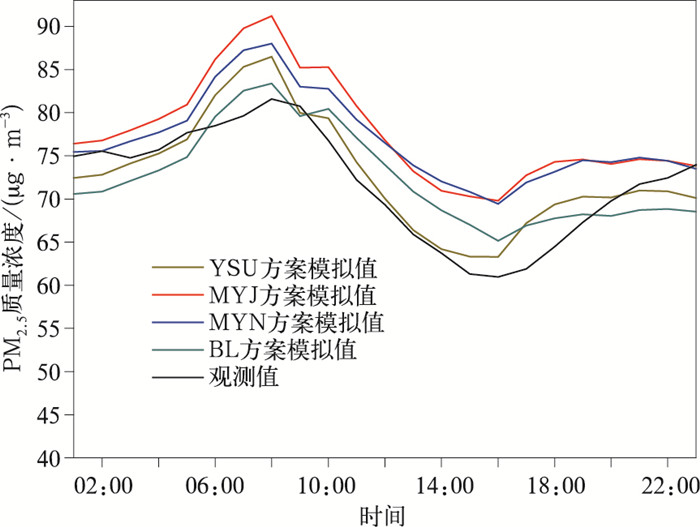
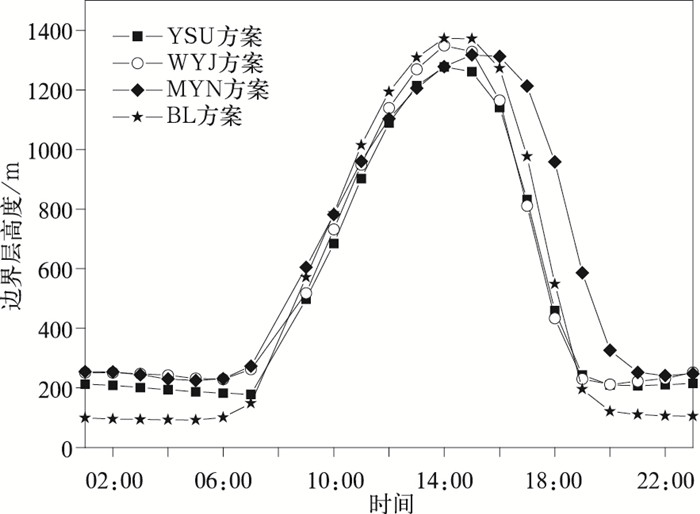
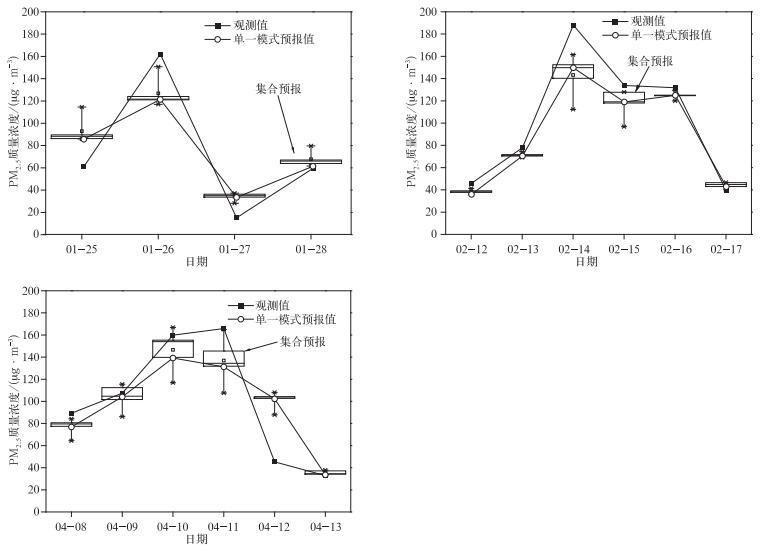
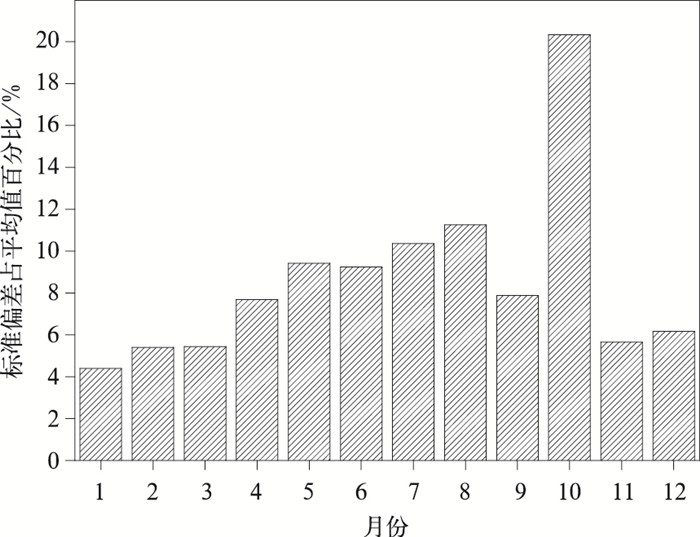
摘要: 基于大气化学模式WRF/Chem采用4种边界层方案(YSU,BL,MYJ和MYN3)模拟2015年全年天津地区细颗粒物质量浓度演变趋势,分析不同边界层方案对天津地区PM2.5质量浓度模拟和预报的影响,并构建多种边界层方案的集合预报产品,以期提高天津地区PM2.5质量浓度预报效果。结果表明:大气化学模式的4种边界层方案在空气质量模拟中均有较好的适用性,PM2.5模拟值与观测值相关系数达到0.76左右,晴空和大风天气BL方案表现较优,阴天和小风天气YSU和MYJ方案表现优于其他两种方案,综合所有过程没有任何单一方案具有显著优势。基于上述原因,该文开展多种边界层方案的天津空气质量集合预报试验,经过对2015年全年模拟值分析,多边界层方案和多气溶胶机制扰动的集合预报可以减小PM2.5质量浓度预报的相对误差和均方根误差,降低重污染天气预报的漏报率,提升空气质量等级预报能力,在计算资源得到保证的基础上,是一种可以提升数值模式PM2.5质量浓度预报能力的有效手段。Abstract: Based on the atmospheric chemical model WRF/Chem, four kinds of boundary layer schemes (YSU, BL, MYJ and MYN3) are used to simulate the evolution of PM2.5 mass concentration of Tianjin in 2015. Effects of different boundary layer schemes on the simulation and prediction of PM2.5 mass concentration are analyzed, and a set of prediction products with various boundary layer schemes are constructed to improve forecast effects. Results show that the best boundary layer scheme for the near surface temperature simulation is BL scheme, the best boundary layer scheme for relative humidity simulation is MYN scheme and YSU scheme, the best boundary layer scheme for wind speed simulation is YSU scheme, and four boundary layer schemes of atmospheric chemical model have good applicability in simulation of air quality. The correlation coefficient between the simulated value and the actual value can reach 0.76, and the relative error is between 31.7% and 33%. Among four boundary layer schemes, MYN scheme leads to highest simulated boundary layer height, and the simulated boundary layer height of BL scheme is the lowest. As for the correlation coefficient between boundary layer height and PM2.5 mass concentration, BL scheme is the highest (0.64), comparing to 0.62 with YSU scheme and MYJ scheme, and only 0.5 with MYN scheme. No single scheme has significant advantages. BL scheme is better in sunny and windy weather, while YSU and MYJ schemes perform better in cloudy and breeze weather. The simulated PM2.5 mass concentration in Tianjin shows a significant disturbance characteristic with different boundary layer schemes. The standard deviation of daily average PM2.5 concentration is about 5.2 μg·m-3, accounting for 8% of the mean, and its maximum can reach 23 μg·m-3. The hourly standard deviation reaches 11.8%, which is greater than the daily standard deviation, especially in the process of mutual transformation between stable boundary layer and unstable boundary layer. To overcome these problems, air quality ensemble prediction tests of multiple boundary layer schemes are carried out in Tianjin. Based on the analysis of forecast value in 2015, the ensemble prediction of multiple boundary layer schemes and disturbance of multiple aerosol mechanisms can decrease the relative error and root mean square error of PM2.5 mass concentration prediction by about 25%. It can also reduce the false negative rate of heavy pollution weather from 44% to 30% and improve the forecasting capabilities of air quality level by 3%-6%. When the computing resources are sufficient, it is also an effective means to enhance the forecast ability of PM2.5 mass concentration.
-
Key words:
- WRF/Chem;
- boundary layer scheme;
- meteorological tower;
- Tianjin
-
表 1 不同边界层方案模拟值与观测值对比
Table 1 Comparison of the simulated and the observed values based on different boundary layer schemes
分类 边界层方案 相关系数 相对误差/% 命中率/% 气温 YSU 0.996 6.9 92.27 MYN 0.993 14.2 86.19 MYJ 0.996 7.8 89.23 BL 0.996 5.5 95.03 相对湿度 YSU 0.90 10.8 80.11 MYN 0.80 15.4 67.40 MYJ 0.89 10.5 80.39 BL 0.90 12.9 72.38 地面风速 YSU 0.87 72.4 74.59 MYN 0.70 77.2 69.61 MYJ 0.89 97.3 53.59 BL 0.89 89.5 57.77 PM2.5质量浓度 YSU 0.76 31.7 83.70 MYN 0.75 33.4 80.11 MYJ 0.76 33.2 79.56 BL 0.75 33.0 81.77 注:命中率为模拟值与观测值差小于某一标准的数据所占百分比,本文规定气温差值为2 K,风速差值为2 m·s-1,相对湿度差值为10%,PM2.5质量浓度差值为35 μg·m-3。 表 2 不同气象条件下边界层方案对PM2.5质量浓度模拟影响(单位:%)
Table 2 The relative error of PM2.5 mass concentration simulation based on different boundary layer scheme under different weather conditions and meteorological conditions(unit: %)
类别 划分依据 边界层方案 平均值 YSU MYJ MYN BL 云量划分/成 [0, 1] 30.98 32.80 32.99 29.92 31.67 (1, 3] 26.45 26.21 27.96 26.81 26.86 (3, 7] 31.05 33.18 33.13 32.68 32.51 (7, 10] 34.51 35.83 35.86 36.37 35.64 地面太阳辐射/(W·m-2) [0, 30] 29.83 29.34 32.95 30.32 30.61 (30, 100] 35.82 35.63 37.53 37.41 36.60 (100, 200] 31.13 32.21 30.57 31.04 31.24 (200, +∞) 26.41 32.02 32.03 29.86 30.08 天气形势 低压型 28.98 30.60 30.36 31.16 30.28 高压型 35.47 35.87 37.13 35.25 35.93 冷空气影响型 42.51 47.55 44.17 42.86 44.27 均压型 25.41 26.71 27.22 27.88 26.81 平直型 32.28 31.32 34.82 33.76 33.05 表 3 2015年天津地区PM2.5质量浓度预报效果对比
Table 3 The forecast effect of PM2.5 mass concentration about different model
预报来源 平均偏差/(μg·m-3) 相对误差/% 归一化均方根误差 全样本 天津单一模式 1.87 32.99 0.49 CUACE模式 34.14 60.32 0.81 BREMPS -12.34 37.23 0.57 模式平均值(天津5组方案) 2.97 32.03 0.49 检验样本 天津单一模式 0.35 34.08 0.45 CUACE模式 33.27 62.33 0.77 BREMPS -12.29 37.53 0.53 独立模式集成 1.07 42.28 0.54 多边界层方案集合 0.99 31.88 0.41 注:独立模式集成指中国气象局CUACE与区域中心BREMPS集成产品,多边界层方案集合指MOSAIC气溶胶机制下4组边界层参数方案成员和MADE气溶胶机制YSU边界层方案成员的神经网络集合产品。 -
[1] 张雅斌, 林琳, 吴其重, 等."13·12"西安重污染气象条件及影响因素.应用气象学报, 2016, 27(1):35-46. doi: 10.11898/1001-7313.20160104 [2] Tang G Q, Zhang J Q, Zhu X W, et al.Mixing layer height and its implications for air pollution over Beijing, China.Atmos Chem Phys, 2016, 16:2459-2475. doi: 10.5194/acp-16-2459-2016 [3] 邓雪娇, 李菲, 吴兑, 等.广州地区典型清洁与污染过程的大气湍流与物质交换特征.中国环境科学, 2011, 31(9):1424-1430. http://www.cnki.com.cn/Article/CJFDTOTAL-ZGHJ201109003.htm [4] 郭丽君, 郭学良, 方春刚, 等.华北一次持续性重度雾霾天气的产生、演变与转化特征观测分析.中国科学(地球科学), 2015, 45(4):427-443. http://www.cnki.com.cn/Article/CJFDTOTAL-JDXK201504005.htm [5] 张人禾, 李强, 张若楠.2013年1月中国东部持续性强雾霾天气产生的气象条件分析.中国科学(地球科学), 2014, 44(1):27-36. http://www.cnki.com.cn/Article/CJFDTOTAL-JDXK201401004.htm [6] 卞林根, 程彦杰, 王欣, 等.北京大气边界层中风和温度廓线的观测研究.应用气象学报, 2002, 13(特刊Ⅰ):13-25. http://www.cnki.com.cn/Article/CJFDTOTAL-YYQX2002S1001.htm [7] 王腾蛟, 张镭, 胡向军, 等.WRF模式对黄土高原丘陵地形条件下夏季边界层结构的数值模拟.高原气象, 2013, 32(5):1261-1271. http://www.cnki.com.cn/Article/CJFDTOTAL-GYQX201305006.htm [8] 周强, 李国平.边界层参数化方案对高原低涡东移模拟的影响.高原气象, 2013, 32(2):2334-2344. http://www.cnki.com.cn/Article/CJFDTOTAL-GYQX201302002.htm [9] 邱贵强, 李华, 张宇, 等.高寒草原地区边界层参数化方案的适用性评估.高原气象, 2013, 32(1):46-55. doi: 10.7522/j.issn.1000-0534.2012.00006 [10] 朱蓉, 徐大海.中尺度数值模拟中的边界层多尺度湍流参数化方案.应用气象学报, 2004, 15(5):543-555. http://qikan.camscma.cn/jams/ch/reader/view_abstract.aspx?file_no=20040567&flag=1 [11] Pleim J E.A combined local and nonlocal closure model for theatmospheric boundary layer.Part Ⅱ:Application and evaluation in a mesoscale meteorological model.Appl Meteor Climat, 2007, 46:1396-1409. [12] 王颖, 张镭, 胡菊, 等.WRF模式对山谷城市边界层模拟能力的检验及地面气象特征分析.高原气象, 2010, 29(6):1397-1407. http://www.cnki.com.cn/Article/CJFDTOTAL-GYQX201006005.htm [13] 张碧辉, 刘树华, 马雁军.MYJ和YSU方案对WRF边界层气象要素模拟的影响.地球物理学报, 2012, 55(7):2239-2248. doi: 10.6038/j.issn.0001-5733.2012.07.010 [14] 肖玉华, 何光碧, 顾清源, 等.边界层参数化方案对不同性质降水模拟的影响.高原气象, 2010, 29(2):331-339. http://www.cnki.com.cn/Article/CJFDTOTAL-GYQX201002009.htm [15] 陈炯, 马占山, 苏勇.适用于GRAPES模式C-P边界层方案的设计和实现.应用气象学报, 2017, 28(1):52-61. doi: 10.11898/1001-7313.20170105 [16] 陈炯, 王建捷.边界层参数化方案对降水预报的影响.应用气象学报, 2006, 17(增刊Ⅰ):11-17. http://www.cnki.com.cn/Article/CJFDTOTAL-AHNY201619071.htm [17] 沈新勇, 黄文彦, 王卫国, 等.利用TWP-ICE试验资料对比两种边界层参数化方案.应用气象学报, 2014, 25(4):385-396. doi: 10.11898/1001-7313.20140401 [18] 杨贵成.WRF-chem中沙尘天气过程对模式分辨率及边界层方案的敏感试验.安徽农业科学, 2012, 40(6):3462-3466. http://kns.cnki.net/KCMS/detail/detail.aspx?filename=ahny201206092&dbname=CJFD&dbcode=CJFQ [19] Ahmadov R, and Coauthors.A volatility basis set model for summertime secondary organic aerosols over the eastern United States in 2006.J Geophys Rse, 2012, 117, D06301. [20] 王颖, 隆宵, 余晔, 等.复杂地形上空气象场对空气质量数值模拟结果影响的研究.大气科学, 2013, 37(1):14-22. doi: 10.3878/j.issn.1006-9895.2012.11089 [21] 徐敬, 马志强, 赵秀娟, 等.边界层方案对华北低层O3垂直分布模拟的影响.应用气象学报, 2015, 26(5):567-577. doi: 10.11898/1001-7313.20150506 [22] 董春卿, 郑有飞, 武永利, 等.边界层方案对山西冬季一次静稳天气PM2.5浓度模拟的影响.中国环境科学, 2016, 36(6):1669-1680. http://kns.cnki.net/KCMS/detail/detail.aspx?filename=zghj201606009&dbname=CJFD&dbcode=CJFQ [23] 周广强, 谢英, 吴剑斌, 等.基于WRF-Chem模式的华东区域PM2.5预报及偏差原因.中国环境科学, 2016, 36(8):2251-2259. http://kns.cnki.net/KCMS/detail/detail.aspx?filename=zghj201608003&dbname=CJFD&dbcode=CJFQ [24] 张小玲, 唐宜西, 熊亚军, 等.华北平原一次严重区域雾霾天气分析与数值预报试验.中国科学院大学学报, 2014, 31(3):337-344. http://www.cnki.com.cn/Article/CJFDTOTAL-ZKYB201403007.htm [25] 赵秀娟, 徐敬, 张自银, 等.北京区域环境气象数值预报系统及PM2.5预报检验.应用气象学报, 2016, 27(2):160-172. doi: 10.11898/1001-7313.20160204 [26] 龚山陵, 张小曳, 周春红, 等. 化学天气预报系统CUACE及在中国区域灰霾预报中的应用//第26届中国气象学会年会大气成分与天气气候及环境变化分会场论文集. 中国气象科学研究院, 2009: 1. [27] 周春红.大气气溶胶及其对云和降水影响的在线数值模拟研究.北京:中国气象科学研究院, 2013. [28] 王哲, 王自发, 李杰, 等.气象-化学双向耦合模式(WRF-NAQPMS)研制及其在京津冀秋季重霾模拟中的应用.气候与环境研究, 2014, 19(2):153-163. doi: 10.3878/j.issn.1006-9585.2014.13231 [29] 李维京.现代气候业务.北京:气象出版社, 2012. [30] 李永华, 刘德, 金龙, 等.BP神经网络模型在重庆伏旱预测中的应用研究.气象, 2003, 29(12):14-17. doi: 10.3969/j.issn.1000-0526.2003.12.003 -


 设为首页
设为首页 加入收藏
加入收藏


 下载:
下载:
