
 设为首页
设为首页 加入收藏
加入收藏

Establishment and Verification of Single Threshold Temperature Model for Partition Precipitation Phase Separation
-
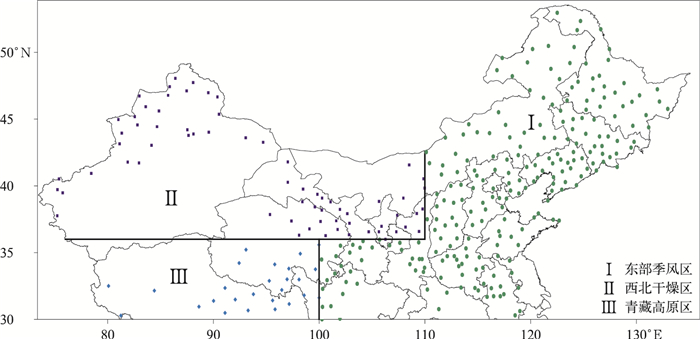
摘要: 使用雪日直接界定法,建立了中国大陆长江以北地区(30°N以北)降水相态分离单临界气温统计模型,分东部季风区、西北干燥区和青藏高原区3个不同气候区独立样本建模,检验模型外推使用的可能性,并对单临界气温分离的雨夹雪偏差进行分析。结果表明:所有地区独立样本建立模型估算的单临界气温与根据天气现象记录确定的单临界气温相关性均达到0.05显著性水平,3个气候区独立建模能够估算出降水相态单临界气温的范围及区域特性;以东部季风区和青藏高原区为样本独立建模的估算结果好于西北干燥区;3个独立模型估算的单临界气温偏差绝对值不大于1℃的气象站都多于74%,估算的标准差偏差在-0.5~0.5℃之间的气象站数量占比77%,在-1.0~1.0℃之间的气象站数量占比90%;日平均气温低于单临界气温的雨夹雪日数和降水量与实际降雪日和降雪量的比率北部略小、南部较大,东部季风区的南部雨夹雪界定的雪日和雪量比率均超过100%;使用统计模型确定不同区域雨夹雪中界定的雪日和雪量比率分布也具有可行性。Abstract: Precipitation is an important parameter to characterize climate characteristics and climate change in a region. It is a key link in global water cycle and energy cycle. Under the same rainfall conditions, effects of different-phase precipitation in the earth's surface system are significantly different. The social and economic impacts produced by them also have significant differences. It is of great theoretical and practical significance to distinguish and recognize snowfall characteristics, their anomalies and causes. In addition, when monitoring and studying the global climate change background and long-term changes of the extreme precipitation events above the sub-continental scale, it is also necessary to distinguish rainfall and snowfall information from historical precipitation data.A statistical model with single temperature thresholds is established for separating cold season rainfall and snowfall with independent samples of different climate zones to the north of the Yangtze River in mainland China (north of 30°N). The applicability of the model is tested, and the deviation of the model on sleet recognizing is analyzed.Results show that correlations between estimated temperature thresholds and actual thresholds pass the significance level test for three areas, i.e., Eastern Monsoon Region, Northwest Arid Region and Qinghai-Tibet Plateau. Models for three areas can well simulate the temperature thresholds, the range and regional characteristics. Simulations in East Monsoon Region and Qinghai-Tibet Plateau are better than those in Northwest Arid Region. Among all of the stations in three regions, stations with absolute bias of the simulated threshold temperature less than 1℃ account for more than 74%, and stations with standard deviation biases between -0.5-0.5℃ account for 77%, and those between -1.0-1.0℃ account for 90%. When the daily mean temperature gets lower than thresholds, ratios of sleet days and precipitation compared to snow days and actual precipitation are slightly smaller in the north and larger in the south. In the south of Eastern Monsoon Region, ratios are more than 1. Statistical models can also be used to determine the distribution of the ratio in different areas.Climate types to north of the Yangtze River include temperate monsoon climate, temperate continental climate, and high-cold climate. Results of the independent sample test in three climatic zones indicate that applying this model to estimate the threshold temperature of precipitation phase in sub-continental snow-rich areas, although still limited, is basically feasible.
-
Key words:
- precipitation;
- phase;
- separation;
- single threshold temperature;
- statistical mode
-
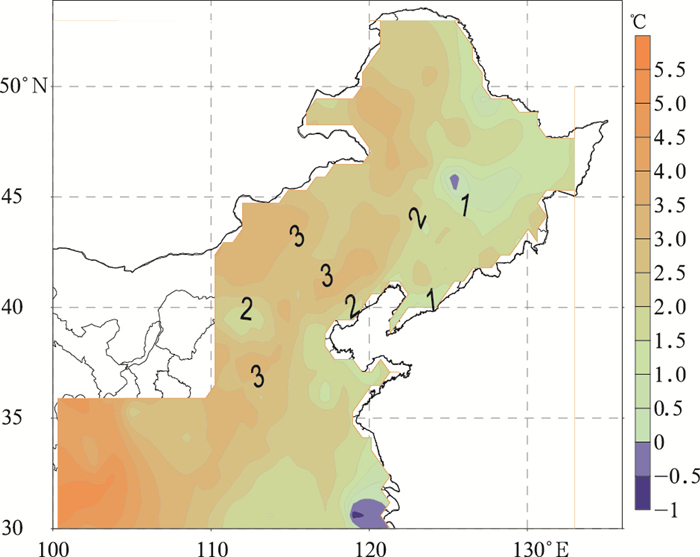
图 2 东部季风区降水相态Td分布
Fig. 2 Spatial distribution of precipitation phase temperature Td in Eastern Monsoon Region

图 3 东部季风区Tp1与Td差值和Td关系
Fig. 3 The relationship of difference between Tp1 and Td to Td in Eastern Monsoon Region
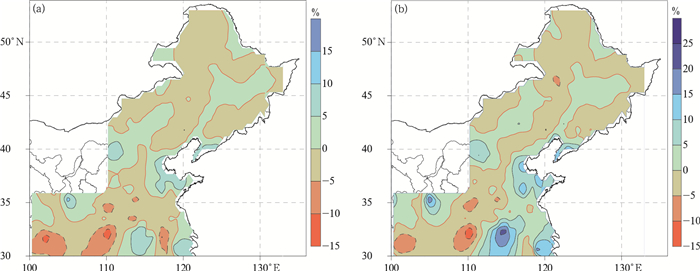
图 4 东部季风区根据Tp1界定的降雪日数(a)和降雪量(b)偏差百分率分布
Fig. 4 Deviation distribution of snow day number(a) and snowfall(b) according to Tp1 in Eastern Monsoon Region
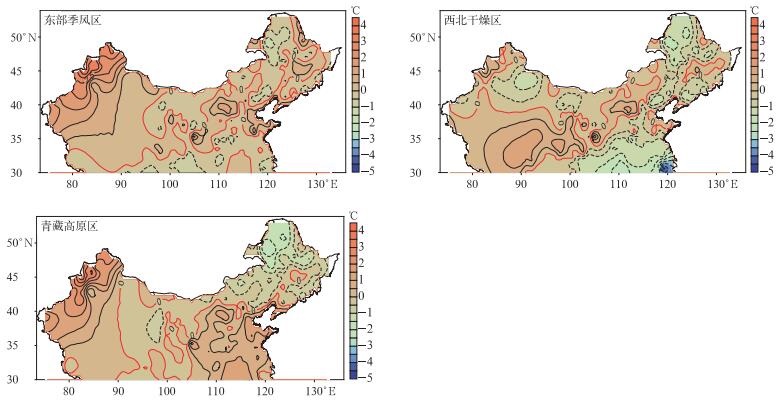
图 5 3个气候区独立样本估算临界气温与Td差值空间分布
Fig. 5 Spatial distribution of difference between the estimated temperature threshold of three climatic zones with independent sample fitting and Td

图 6 分区独立样本估算检验
(a)估算临界气温,(b)估算雪日雪量偏差,(c)偏差百分率统计
Fig. 6 Partition independent sample fitting test
(a)fitted temperature threshold, (b)fitted snow day number and snowfall deviation, (c)deviation percentage statistics

图 7 分区样本估算临界气温界定的雪日和雪量偏差百分率分布
(a)东部季风区估算雪日偏差,(b)西北干燥区估算雪日偏差,(c)青藏高原区估算雪日偏差,(d)东部季风区估算雪量偏差,(e)西北干燥区估算雪量偏差,(f)青藏高原区估算雪量偏差
Fig. 7 Distribution of the deviation percentage of snow day number and snowfall defined by the temperature threshold of partition sample estimation
(a)estimated snow day number deviation in Eastern Monsoon Region, (b)estimated snow day number deviation in Northwest Arid Area, (c)estimated snow day number deviation in the Tibetan Plateau Region, (d)estimated snowfall deviation in Eastern Monsoon Region, (e)estimated snowfall deviation in Northwest Arid Region, (f)estimated snowfall deviation in the Qinghai-Tibet Plateau
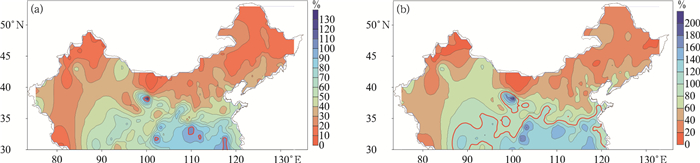
图 8 低于Td的雨夹雪日数(a)和降水量(b)与实际降雪日数和降雪量的比率空间分布
(图中红粗线为100%等值线)
Fig. 8 Spatial distribution of the ratio of sleet day number(a) and sleet-fall(b) below Td in the actual snow day number and snowfall
(the red thick line denotes 100%)
表 1 分区独立样本估算临界气温
Table 1 The estimated temperature threshold of the partitioned independent sample fitting
区域 要素项 最小值/℃ 最大值/℃ 平均值/℃ 偏差绝对值低于0.5℃气象站占比/% 偏差绝对值低于1℃气象站占比/% 与Td相关系数 东部季风区 Tp1 -0.20 6.34 0.78 Tp1-Td -1.38 4.34 0.22 61 86 -0.31 西北干燥区 Tp2 -3.90 6.59 0.86 Tp2-Td -2.90 2.57 -0.33 43 74 0.05 青藏高原区 Tp3 0.19 6.43 0.75 Tp3-Td -2.53 4.16 0.18 44 76 -0.23  下载: 导出CSV
表 2 分区独立样本估算偏差检验
Table 2 The estimated snowfall day number and snowfall deviation of the partitioned independent sample fitting
区域 要素项 最小值/% 最大值/% 平均值/% 偏差绝对值低于10%气象站占比/% 偏差绝对值低于20%气象站占比/% 与Td相关系数 东部季风区 雪日偏差 -14 15 1 95 100 -0.34 雪量偏差 -15 27 2 90 99 -0.28 西北干燥区 雪日偏差 -61 22 -3 85 94 0.18 雪量偏差 -65 46 -2 84 94 0.23 青藏高原区 雪日偏差 -8 39 3 86 94 -0.29 雪量偏差 -13 57 5 78 90 -0.24
下载: 导出CSV
-
[1] 丁一汇, 王绍武, 郑景云, 等.中国气候.北京:科学出版社, 2013:327-391. [2] 刘国纬.水文循环的大气过程.北京:科学出版社, 1997:1-245. [3] 夏军, 刘春蓁, 任国玉.气候变化对我国水资源影响研究面临的机遇与挑战.地球科学进展, 2011, 26(1):1-12. http://www.cnki.com.cn/Article/CJFDTOTAL-DXJZ201101000.htm [4] WMO.Reducing and managing risks of disasters in a changing climate.WMO Bulletin, 2013, 62(Special Issue):23-31. http://www.preventionweb.net/go/41085 [5] 王昂生.中国减灾与可持续发展.北京:科学出版社, 2007. [6] 刘玉莲, 任国玉, 于宏敏.中国降雪气候学特征.地理科学, 2012, 32(10):1176-1185. http://cpfd.cnki.com.cn/Article/CPFDTOTAL-ZJDX201211001017.htm [7] 刘玉莲, 任国玉, 于宏敏, 等.我国强降雪气候特征及其变化.应用气象学报, 2013, 24(3):304-313. doi: 10.11898/1001-7313.20130306 [8] 任国玉, 战云健, 任玉玉, 等.中国大陆降水时空变异规律——Ⅰ.气候学特征.水科学进展, 2015, 26(3):299-310. http://kns.cnki.net/KCMS/detail/detail.aspx?filename=skxj201503001&dbname=CJFD&dbcode=CJFQ [9] 任国玉, 任玉玉, 战云健, 等.中国大陆降水时空变异规律——Ⅱ.现代变化趋势.水科学进展, 2015, 26(4):451-465. http://www.cnki.com.cn/Article/CJFDTOTAL-SKXJ200702012.htm [10] 任国玉, 柳艳菊, 孙秀宝, 等.中国大陆降水时空变异规律——Ⅲ.趋势变化原因.水科学进展, 2016, 27(3):327-348. http://www.cnki.com.cn/Article/CJFDTOTAL-QHBH200601002.htm [11] 除多, 洛桑曲珍, 杨志刚, 等.1981-2010年青藏高原降雪日数时空变化特征.应用气象学报, 2017, 28(3):292-305. doi: 10.11898/1001-7313.20170304 [12] 袁杰, 魏凤英, 巩远发, 等.关键区海温年代际异常对我国东部夏季降水影响.应用气象学报, 2013, 24(3):268-277. doi: 10.11898/1001-7313.20130302 [13] 邓汗青, 罗勇.近年长江中下游春季和梅雨期降水变化特征.应用气象学报, 2013, 24(1):23-31. doi: 10.11898/1001-7313.20130103 [14] 何立富, 陈涛, 孔期.华南暖区暴雨研究进展.应用气象学报, 2016, 27(5):559-569. doi: 10.11898/1001-7313.20160505 [15] 魏维, 张人禾, 温敏.南亚高压的南北偏移与我国夏季降水的关系.应用气象学报, 2012, 23(6):650-659. doi: 10.11898/1001-7313.20120602 [16] 陈春艳, 王建捷, 唐冶, 等.新疆夏季降水日变化特征.应用气象学报, 2017, 28(1):72-85. doi: 10.11898/1001-7313.20170107 [17] 张人禾, 张若楠, 左志燕.中国冬季积雪特征及欧亚大陆积雪对中国气候影响.应用气象学报, 2016, 27(5):513-526. doi: 10.11898/1001-7313.20160501 [18] 王冀, 何丽烨, 张雪梅.华北农牧交错带冬季降雪时空变化特征.地理学报, 2015, 70(9):1363-1374. http://www.geog.com.cn/CN/article/downloadArticleFile.do?attachType=PDF&id=36868 [19] 刘原峰, 朱国锋, 赵军, 等.黄土高原区不同降水相态的时空变化.地理科学, 2016, 36(8):1227-1233. http://www.cqvip.com/QK/95809X/201608 [20] 张琳娜, 郭锐, 曾剑, 等.北京地区冬季降水相态的识别判据研究.高原气象, 2013, 32(6):1780-1786. doi: 10.7522/j.issn.1000-0534.2012.00147 [21] 尤凤春, 郭丽霞, 史印山, 等.北京降水相态判别指标及检验.气象与环境学报, 2013, 29(5):49-54. http://www.cnki.com.cn/Article/CJFDTotal-QXXX201303011.htm [22] Wigmosta M S, Vail L, Lettenmaier D P.A distributed hydrology-vegetation model for complex terrain.Wat Resour Res, 1994, 30:1665-1679. doi: 10.1029/94WR00436 [23] Kang E S, Cheng G D, Lan Y C, et al.A model for simulating the response of run off from the mountainous watershed of inland river basins in the arid area of northwest China to climatic changes.Science in China(Series D), 1999, 42(Suppl):52-63. [24] 康尔泗, 程国栋, 蓝永超, 等.西线南水北调雅砻江调水坝址径流模拟.冰川冻土, 2001, 23(2):139-148. http://www.wanfangdata.com.cn/details/detail.do?_type=perio&id=bcdt200102006 [25] Chen R S, Kang E S, Lu S H, et al.A distributed water-heat coupled model for mountainous watershed of an inland river basin in Northwest China (I) model structure and equations.Environmental Geology, 2008, 53:1299-1309. doi: 10.1007/s00254-007-0738-2 [26] Arnold J G, Srinivasan R, Muttiah R S, et al. Large area hydrologic modeling and assessment part Ⅰ:Model development.Journal of the American Water Resources Association, 1998, 34(1):73-89. doi: 10.1111/jawr.1998.34.issue-1 [27] Refsgaard A, Seth S M, Bathurst J C, et al.Application of the SHE to catchments in India.Part Ⅰ:General results.Journal of Hydrology, 1992, 140:1-23. doi: 10.1016/0022-1694(92)90232-K [28] Edwin P M, Clifford M.Using radar data to partition precipitation into rain and snow in a hydrologic model.Hydrologic Engrg, 2006, 11:214-221. doi: 10.1061/(ASCE)1084-0699(2006)11:3(214) [29] 韩春坛, 陈仁升, 刘俊峰, 等.固液态降水分离方法探讨.冰川冻土, 2010, 32(2):249-256. http://www.irgrid.ac.cn/handle/1471x/643992?mode=full [30] Chen R S, Liu J F, Song Y X.Precipitation type estimation and validation in China.Journal of Mountain Science, 2014, 11(4):917-925. doi: 10.1007/s11629-012-2625-x -

计量
- 摘要浏览量: 4593
- HTML全文浏览量: 1221
- PDF下载量: 248
- 被引次数: 0
