
 设为首页
设为首页 加入收藏
加入收藏

Characteristics of Atmospheric Hydrogen Peroxide at an Urban Site in Beijing During Winter and Spring
-
摘要: 大气过氧化氢(H2O2)是一种重要的光化学产物,也是硫酸盐气溶胶生成及降水酸化过程的关键氧化剂。然而,我国对H2O2的观测研究较少,尤其对雾霾期间H2O2浓度变化特征认识不足。该文介绍了冬春时段(2016年12月-2017年4月)在北京城区中国气象局的H2O2观测结果,并结合同期O3,PAN,NOX,PM2.5等污染物和气象要素观测数据,分析H2O2浓度变化特征与影响因素。观测结果表明:观测期间H2O2体积混合比(简称为浓度)为(0.65±0.59)×10-9,其中,春季浓度(0.83±0.67)×10-9高于冬季浓度(0.51±0.47)×10-9;H2O2平均日变化基本呈现单峰特征,峰值出现在18:00-21:00,比其他地区峰值出现稍晚,并滞后于O3峰值时间4~7 h;相对湿度对H2O2日峰值时间和浓度水平有影响,小于55%时日峰值出现于18:00-24:00,平均峰值浓度1.52×10⁻⁹;大于65%时日峰值出现于11:00-16:00,日峰值浓度均小于1×10⁻⁹。H2O2,O3和PAN虽然同属光化学产物,但在不同污染状况下浓度水平和变化趋势差异明显;H2O2清洁日峰值浓度高于污染日,但11:00-15:00污染日浓度略高于清洁日。Abstract: As a photochemical produced oxidant, gaseous hydrogen peroxide (H2O2) plays an important role in aerosols and acid rain production. However, not many measurements of gaseous H2O2 have been made in China in the past few years and further studies especially the level and trend of H2O2 in smog are needed. To make up for the lack of H2O2 data and provide support for air quality improvement in China, an observation experiment on gaseous H2O2 is carried out from 27 Dec 2016 to 28 Apr 2017 at an urban site in the northwest of mega-city Beijing, using a two-channel H2O2 monitor AL2021. The concentration level, variation and influence factors under different conditions are analyzed with several simultaneously observed pollutants (O3, PAN, NOX, PM2.5, etc.) and meteorological parameters. The mean mixing ratio of H2O2 for the entire period is (0.65±0.59)×10-9, with a higher mean of (0.83±0.67)×10-9 in spring and a lower mean of (0.51±0.47)×10-9 in winter. Day peaks with the value higher than 2×10⁻⁹ is also detected in winter indicating that high concentration of H2O2 can also happen under certain conditions. The concentration of H2O2 shows pronounced diurnal cycles with peaks in the period of 1800-2100 BT, occurring later than those reported for other sites in China or foreign countries and shows a delay of about 4 to 7 hours compared with the peaking time of O3. H2O2 level is found to be negatively correlated with relative humidity (RH), especially when only considering the maximum H2O2 level under RH over 55%. This is consistent with the uptake of gaseous H2O2 by water-containing aerosol particles under higher RH conditions. The H2O2 peaking time and peak level are closely related with RH as well as other factors, such as NOX. Under conditions of daily RH lower than 55%, H2O2 level can reach a mean peak value of 1.52×10⁻⁹ with peaking times during 1800-2400 BT, while it peaks lower (1×10⁻⁹) and earlier (before 1700 BT) with the daily mean RH higher than 65%. H2O2, O3 and PAN show different diurnal patterns and levels under different pollution conditions. H2O2 shows smaller average level differences for clean and hazy days, with a higher peak but a lower level during 1100-1500 BT under the clean condition. O3 shows a higher mixing ratio under clean condition than under hazy condition, while PAN reveals an opposite trend. Results also indicate that dynamical transport could be an important influencing factor of variations and levels of H2O2 and O3. The impact of photochemistry on haze formation in colder months in the urban environment of Beijing and its feedback warrant further studies, particularly the role of H2O2 in the formation of sulfate aerosol.
-
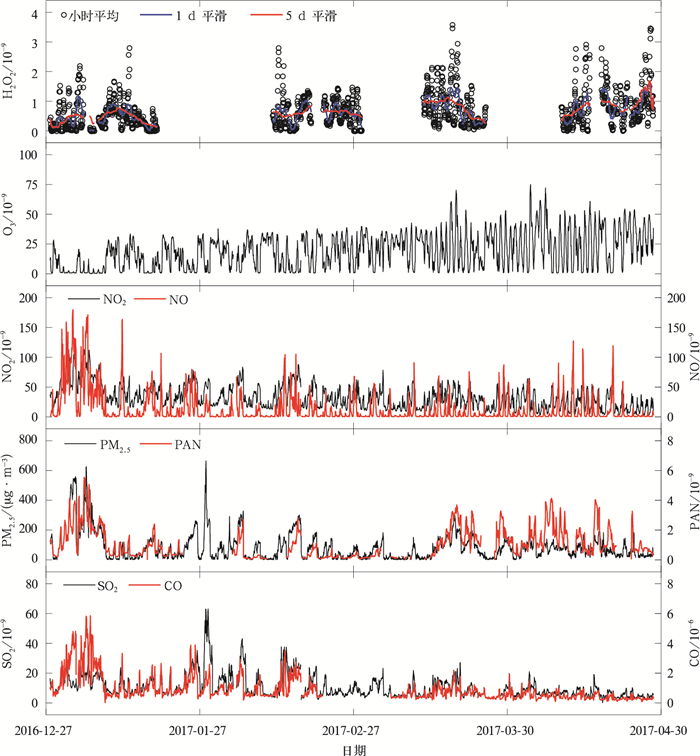
图 1 2016年12月—2017年4月观测到的H2O2,O3,NO,NO2,PM2.5,PAN,SO2及CO
(其中PM2.5在海淀公园观测,其他污染物均在CMA站观测)
Fig. 1 Hourly averaged H2O2, O3, NO, NO2, PM2.5, PAN, SO2 and CO concentrations from Dec 2016 to Apr 2017
(with PM2.5 observed at Haidian Park and the other pollutants at CMA, Beijing)

图 2 2016年12月—2017年4月观测期间北京市海淀公园站部分气象要素的变化
Fig. 2 Hourly averaged air temperature, relative humidity, global radiation, wind velocity and direction from Dec 2016 to Apr 2017 at CMA, Beijing
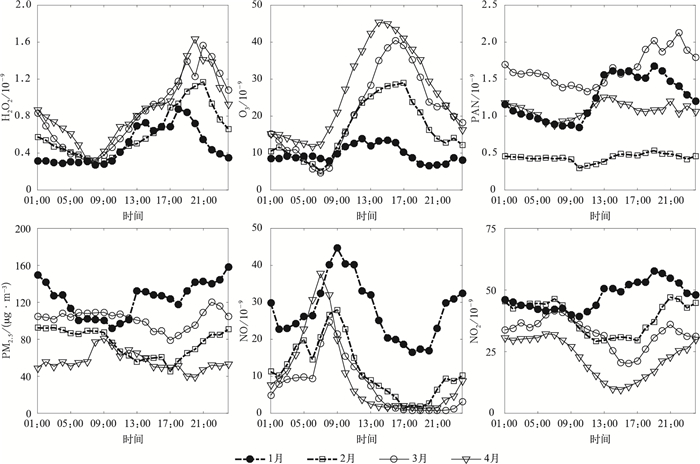
图 3 2017年1—4月CMA站H2O2,O3,PAN,PM2.5,NO和NO2平均日变化
Fig. 3 Diurnal variations of H2O2, O3, PAN, PM2.5, NO and NO2 at CMA, Beijing from Jan 2017 to Apr 2017
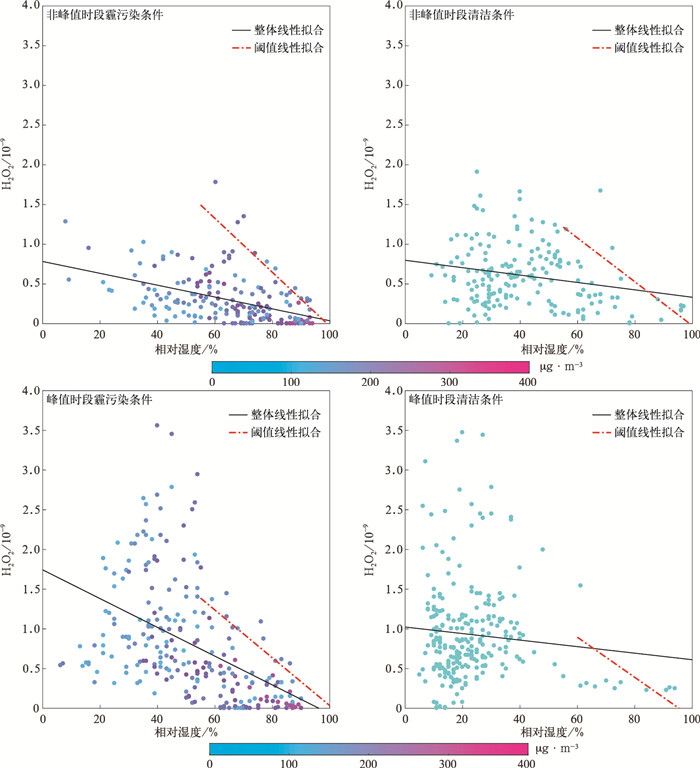
图 4 峰值时段(11:00—24:00)与非峰值时段(01:00—10:00)在清洁和霾污染条件下,H2O2和相对湿度的小时平均值分布和线性拟合结果以及相对湿度在55%—100%区间内H2O2最大值与相对湿度的线性拟合结果
(填色代表对应PM2.5小时平均浓度)
Fig. 4 Relationships between H2O2 and relative humidity for peak period(1100-2400 BT) and non-peak period (0100-1000 BT) under hazy and clean conditions including overall correlations between H2O2 and relative humidity for different conditions and correlations between the maximum H2O2 and relative humidity within 55%-100%
(the shaded denotes the corresponding PM2.5 concentration)
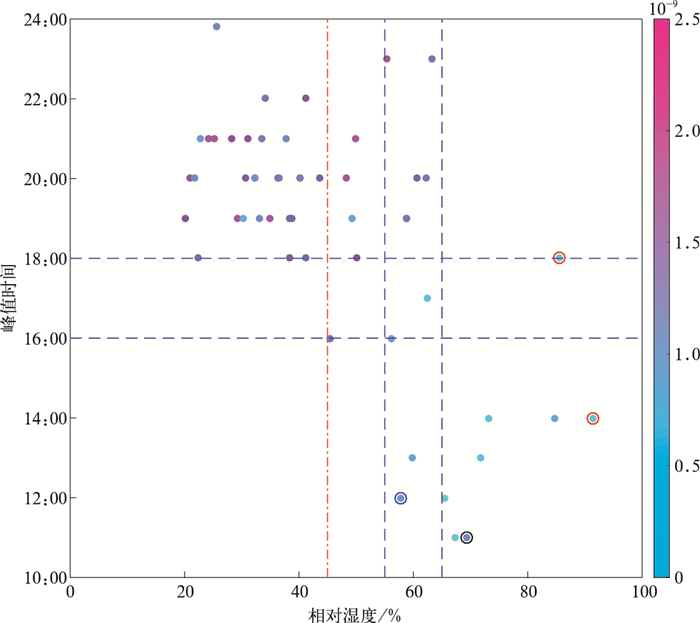
图 5 2017年1—4月H2O2峰值时刻与相对湿度日平均值关系
(填色表示H2O2峰值浓度,圆圈为降水日)
Fig. 5 Daily H2O2 peaking times under different relative humidity at CMA, Beijing from Jan 2017 to Apr 2017
(the shaded represents the peak level of H2O2, circled points are data from rainy days)
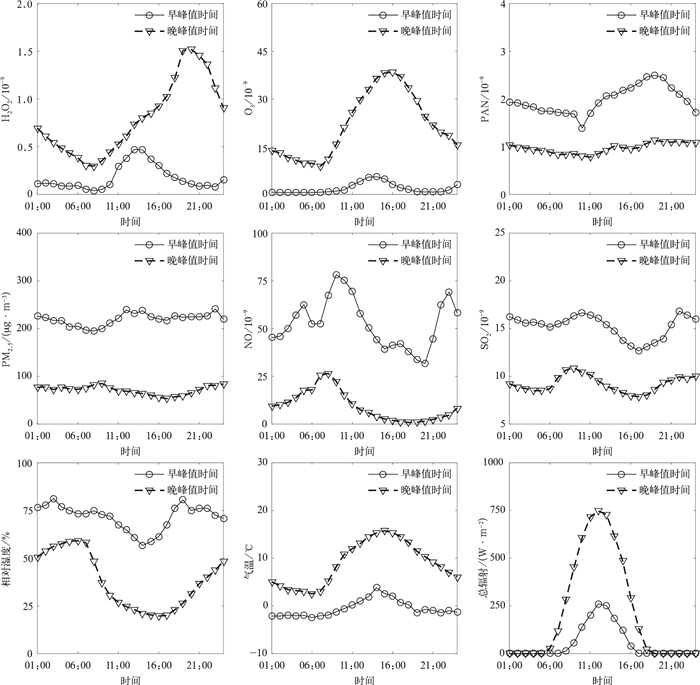
图 6 2017年1—4月H2O2早峰值时间(11:00—15:00)和晚峰值时间(19:00—24:00)各要素小时平均值日变化
Fig. 6 Diurnal variations of different elements for H2O2 earlier peak(1100-1500 BT) and later peak(1900-2400 BT) at CMA, Beijing from Jan 2017 to Apr 2017

图 7 2017年1—4月污染日和清洁日的污染物平均日变化
Fig. 7 Averaged diurnal variations of pollutants for clean and hazy conditions from Jan 2017 to Apr 2017
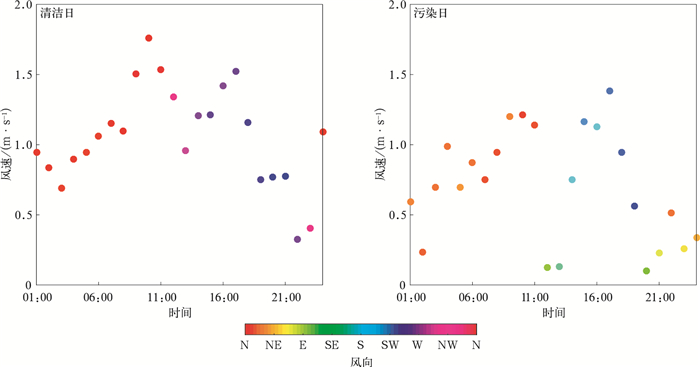
图 8 2017年1—4月清洁日和污染日的风速和风向平均日变化
Fig. 8 Averaged diurnal variations of wind velocity and direction for clean and hazy conditions from Jan 2017 to Apr 2017
表 1 不同观测时段H2O2浓度统计结果
Table 1 Statistics of H2O2 concentrations for different observation periods at CMA, Beijing
时段 H2O2浓度/10-9 样本量 平均值 最大值 中值 标准偏差 全时间序列 0.65 3.56 0.52 0.59 1489 高浓度时段(13:00—24:00) 0.89 3.56 0.77 0.67 715 低浓度时段(01:00—12:00) 0.44 1.92 0.33 0.39 774 冬季(2016年12月27日—2017年2月28日) 0.51 2.78 0.40 0.47 831 春季(2017年3月1日—4月28日) 0.83 3.56 0.70 0.67 658  下载: 导出CSV
-
[1] 汤洁, 张晓山, 郑向东, 等.青海瓦里关山地区大气过氧化氢的观测与分析.自然科学进展, 2002, 12(2):161-165. http://www.wanfangdata.com.cn/details/detail.do?_type=perio&id=zrkxjz200202009 [2] Logan J A, Prather M J, Wofsy S C, et al.Tropospheric chemistry:A global perspective.J Geophys Res, 1981, 86:7210-7254. doi: 10.1029/JC086iC08p07210 [3] Sakugawa H, Kaplan I R, Tsai W, et al.Atmospheric hydrogen peroxide.Environ Sci Technol, 1990, 24(10):1452-1462. doi: 10.1021/es00080a002 [4] Gnauk T, Rolle W, Spindler G.Diurnal variations of atmospheric hydrogen peroxide concentrations in Saxony (Germany).J Atmos Chem, 1997, 27:79-103. doi: 10.1023/A:1005895414216 [5] Chen X, Aoki M, Zhang S, et al.Observation of hydrogen peroxide concentrations in a Japanese red pine forest.J Atmos Chem, 2008, 60:37-49. doi: 10.1007/s10874-008-9107-0 [6] Watkins B A, Parrish D D, Trainer M, et al.Factors influencing the concentration of gas phase hydrogen peroxide during the summer at Niwot Ridge, Colorado.J Geophys Res, 1995, 100(D11):22831-22840. doi: 10.1029/95JD00514 [7] 贾诗卉. 华北地区O3和PAN的同步观测与分析. 北京: 中国气象科学研究院, 2015. http://cdmd.cnki.com.cn/Article/CDMD-85101-1015305970.htm [8] Dollard G J, Jones B M R, Davies T J.Measurements of gaseous hydrogen peroxide and PAN in rural southern England.Atmos Environ, 1991, 25A(9):2039-2053. http://cn.bing.com/academic/profile?id=855b2b5dfa36990c3189c4f1d4d027c2&encoded=0&v=paper_preview&mkt=zh-cn [9] Charlson R J, Lovelock J E, Andreae M O, et al.Oceanic phytoplankton, atmospheric sulfur, cloud albedo and climate.Nature, 1987, 326:655-661. doi: 10.1038/326655a0 [10] 徐婉筠. 华北平原SO2的变化机制及其与气溶胶的相互作用. 北京: 北京大学, 2014. http://www.wanfangdata.com.cn/details/detail.do?_type=degree&id=Y2668098 [11] 徐晓斌, 唐孝炎.微量过氧化氢分析方法的发展概况.环境科学情报, 1985(6):14-18. http://cdmd.cnki.com.cn/Article/CDMD-10200-2010179350.htm [12] 徐晓斌, 王美蓉, 邵可声, 等.大气降水中H2O2的测定方法.环境化学, 1990, 9(1):25-31. http://kns.cnki.net/KCMS/detail/detail.aspx?filename=hjhx199001004&dbname=CJFD&dbcode=CJFQ [13] 缪萍萍. 大气中过氧化物监测方法的研究及其应用. 杭州: 浙江工业大学, 2013. http://www.wanfangdata.com.cn/details/detail.do?_type=degree&id=Y2411432 [14] Das M, Husain L.Photochemical and dynamical processes affecting gaseous H2O2 concentrations in the lower troposphere.J Geophy Res, 1999, 104(D17):21367-21383. doi: 10.1029/1999JD900284 [15] Sun Q, Tang X, Wang M, et al.Hydrogen peroxide in the atmosphere and its effect on acidification of precipitation.China Environmental Science, 1993, 4(2):47-56. [16] He S Z, Chen Z M, Zhang M, et al.Measurement of atmospheric hydrogen peroxide and organic peroxides in Beijing before and during the 2008 Olympic Games:Chemical and physical factors influencing their concentrations.J Geophys Res, 2010, 115:D17307. doi: 10.1029/2009JD013544 [17] Hua W, Chen Z M, Jie C Y, et al.Atmospheric hydrogen peroxide and organic hydroperoxides during PRIDE-PRD'06, China:Their concentration, formation mechanism and contribution to secondary aerosols.Atmos Chem Phys, 2008, 8:6755-6773. doi: 10.5194/acp-8-6755-2008 [18] Wang Y, Chen Z M, Wu Q Q, et al.Observation of atmospheric peroxides during Wangdu Campaign 2014 at a rural site in the North China Plain.Atmos Chem Phys, 2016, 16:10985-11000. doi: 10.5194/acp-16-10985-2016 [19] Zhang Q Y, Liu J Y, He Y L, et al.Measurement of hydrogen peroxide and organic hydroperoxide concentrations during autumn in Beijing, China.J Environ Sci, 2018, 64:72-81. doi: 10.1016/j.jes.2016.12.015 [20] 丁国安, 孟昭阳, 于海青, 等.北京城区大气边界层空气污染特征观测研究.应用气象学报, 2002, 13(特刊I):82-91. http://www.cqvip.com/qk/97586X/2002U01/5977052.html [21] 贾诗卉, 徐晓斌, 林伟立, 等.华北平原夜间对流天气对地面O3混合比抬升效应.应用气象学报, 2015, 26(3):280-290. doi: 10.11898/1001-7313.20150303 [22] Huang R J, Zhang Y L, Bozzetti C, et al.High secondary aerosol contribution to particulate pollution during haze events in China.Nature, 2014, 514:218-222. doi: 10.1038/nature13774 [23] 李阳, 徐晓斌, 林伟立, 等.基于观测的污染气体区域排放特征.应用气象学报, 2012, 23(1):10-19. http://qikan.camscma.cn/jams/ch/reader/view_abstract.aspx?file_no=20120102&flag=1 [24] 蒲维维, 赵秀娟, 张小玲, 等.北京地区夏末秋初气象要素对PM2.5污染的影响.应用气象学报, 2011, 22(6):716-723. doi: 10.11898/1001-7313.20110609 [25] 徐晓斌, 刘希文, 林伟立.输送对区域本底站痕量气体浓度的影响.应用气象学报, 2009, 20(6):656-664. doi: 10.11898/1001-7313.20090602 [26] 姜江, 张国平, 高金兵.北京大气能见度的主要影响因子.应用气象学报, 2018, 29(2):188-199. doi: 10.11898/1001-7313.20180206 [27] 徐晓斌.我国霾和光化学污染观测研究进展.应用气象学报, 2016, 27(5):604-619. doi: 10.11898/1001-7313.20160509 [28] Zhong J T, Zhang X Y, Dong Y S, et al.Feedback effects of boundary-layer meteorological factors on cumulative explosive growth of PM2.5 during winter heavy pollution episodes in Beijing from 2013 to 2016.Atmos Chem Phys, 2018, 18(1):247-258. https://www.researchgate.net/publication/319861774_Feedback_effects_of_boundary-layer_meteorological_factors_on_explosive_growth_of_PM25_during_winter_heavy_pollution_episodes_in_Beijing_from_2013_to_2016 [29] Lin W, Xu X, Ge B, et al.Gaseous pollutants in Beijing urban area during the heating period 2007-2008:Variability, sources, meteorological and chemical impacts.Atmos Chem Phys, 2011, 11:8157-8170. doi: 10.5194/acp-11-8157-2011 [30] Zhang H, Xu X, Lin W, et al.Wintertime peroxyacetyl nitrate (PAN) in the megacity Beijing:The role of photochemical and meteorological processes.J Environ Sci, 2014, 26(1):83-96. doi: 10.1016/S1001-0742(13)60384-8 [31] 颜鹏, 刘桂清, 周秀骥, 等.上甸子秋冬季雾霾期间气溶胶光学特性.应用气象学报, 2010, 21(3):257-265. doi: 10.11898/1001-7313.20100301 -

计量
- 摘要浏览量: 3317
- HTML全文浏览量: 1289
- PDF下载量: 183
- 被引次数: 0
