
 设为首页
设为首页 加入收藏
加入收藏

The Vertical Transport of the Ozone and Carbon Monoxide by Severe Convective Weather
-
摘要: 利用ACTIVE(aerosol and chemical transport in tropical convection)试验资料,取2006年1月20日澳大利亚北部达尔文岛附近发生的一次飑线强对流天气的AE17航次和2006年1月27日无对流天气的AE21航次飞行路径中的探测资料,对澳大利亚达尔文地区夏季风盛行期间发生的有无强对流发生时O3和CO浓度垂直分布变化进行对比,考察强对流性天气发生对O3和CO浓度垂直输送作用。深对流云内强烈的垂直上升运动将O3和CO等化学气体携带输送至对流层上部并在对流层顶堆积,从而在对流层上部产生浓度峰值。当有强对流发生,飞机进入对流云上层时,O3浓度和CO浓度升高,O3和CO浓度变率增大,在对流层上部浓度出现峰值;当飞机飞出对流云时,O3和CO浓度相对较低,在对流云外出现谷值。在无对流发生的条件下O3和CO浓度相对较小,浓度变率也较小,无峰值产生。分析表明:O3和CO浓度分布不仅与强对流的垂直输送作用关系密切,且与气象要素垂直和水平分布以及动力输送过程密切相关。Abstract: Clouds have significant impacts on the quality of the atmosphere in the troposphere, the redistribution of chemical gases and climate change. In general, environmental and climatic effects of atmospheric pollutants are to a large extent determined by their vertical distribution in the atmosphere. Deep convective clouds, as the main carrier of vertical conveying of atmospheric mass, can transport air from the boundary layer to the upper troposphere in a very short time. So various chemical gaseous components can be transported from lower layers to the upper troposphere or even the lower stratosphere in a relative short time and this process can also increase the chemical gas residence time in the atmosphere.Using ozone and carbon monoxide data obtained from aircraft observations for altitude from 1 to 15 km near Darwin(12.41°S, 130.9°E) in northern Australia, in the Aerosol and Chemical Transport in Tropical Convection (ACTIVE) campaign from November 2005 to February 2006, a squall line process on 20 January 2006 and a non-convective weather day on 27 January 2006 are compared. Differences between the distribution of ozone and carbon monoxide in severe convective and non-convective conditions are analyzed. According to results of contrastive analysis, there is a very close relationship between the peak concentration of ozone and carbon monoxide in upper troposphere and the appearance of strong convective systems. Severe vertical ascending motion inside the deep convective cloud carries ozone, carbon monoxide and other chemical gases to the top of the troposphere, and then these chemical gases accumulate in the upper troposphere, leading to a peak concentration. Results show that in convection, the concentration of cloud particles and chemical gas such as ozone, carbon monoxide rise and their variability is large too. At the same time, peak concentrations of ozone and carbon monoxide appear in the upper troposphere. But outside convective clouds, concentrations of cloud particles, ozone and carbon monoxide all drop. On the contrary, under non-convective condition, concentration of ozone is stable, and no peak value is observed.Results show that deep-convective cloud have obvious vertical conveying effects on ozone and carbon monoxide. The distribution of ozone and carbon monoxide closely rely on vertical conveying of strong convection, as well as distribution of meteorological factors and synoptic dynamic transportation process.
-
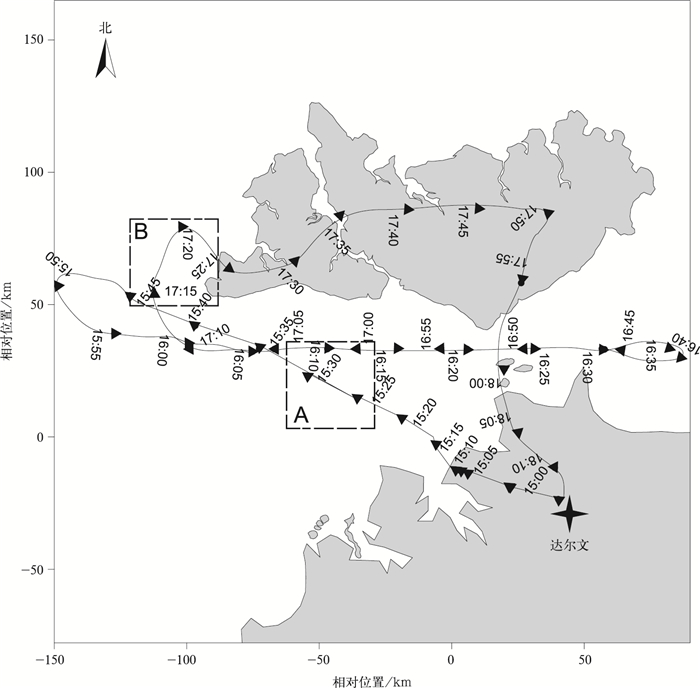
图 1 2006年1月20日AE17 Egrett飞机飞行轨迹
Fig. 1 AE17 flight path of Egrett aircraft on 20 Jan 2006

图 2 2006年1月20日AE17航次飞行探测对流个例云粒子、CO以及O3浓度分布
Fig. 2 The concentration of cloud particles, ozone and carbon monoxide of a convective case detected by AE17 aircraft on 20 Jan 2006
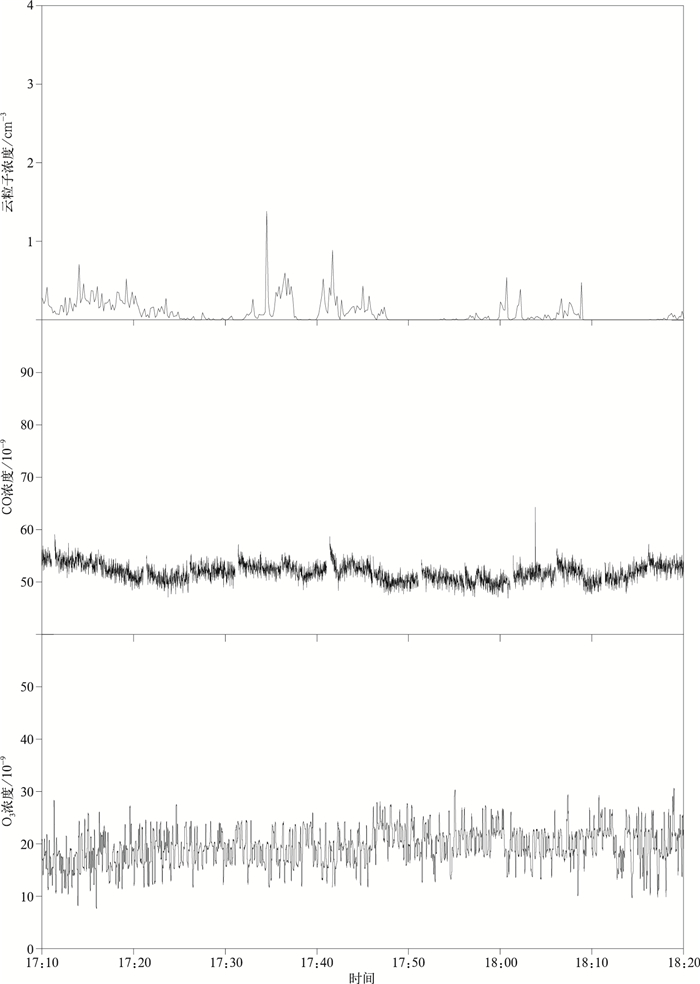
图 3 2006年1月27日AE21航次飞行探测非对流个例云粒子浓度、CO浓度以及O3浓度的分布
Fig. 3 The concentration of cloud particles, ozone and carbon monoxide of a non-convective case detected by AE21 aircraft on 27 Jan 2006

图 4 2006年1月20日15:00 850 hPa风场(a)、500 hPa垂直速度场(b)与2006年1月27日15:00 850 hPa风场(c)和500 hPa垂直速度场(d)
Fig. 4 Wind field at 850 hPa(a), the vertical velocity field at 500 hPa(b) at 1500 LT 20 Jan 2006 and wind field at 850 hPa(c), the vertical velocity field at 500 hPa(d) at 1500 LT 27 Jan 2006

图 5 FY-2静止气象卫星观测的澳大利亚Tiwi岛云顶亮温分布(紫色框为Tiwi岛飞机探测目标区)
(a)2006年1月20日16:30,(b)2006年1月20日17:30
Fig. 5 Black body temperature observed by FY-2 satellite over Tiwi Island, Australia (inside the purple frame)
(a)1630 LT 20 Jan 2006, (b)1730 LT 20 Jan 2006
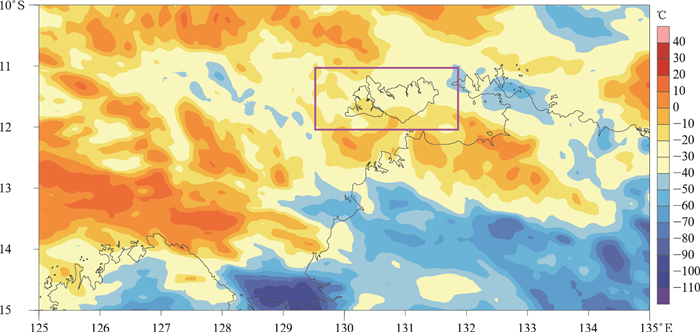
图 6 2006年1月27日17:30澳大利亚北部Tiwi岛云顶亮温分布
(紫色框为Tiwi岛飞机探测范围)
Fig. 6 Black body temperature observed by FY-2 satellite on Tiwi Island (inside the purple frame), Australia at 1730 LT 27 Jan 2006
表 1 Egrett飞机起降时间、飞行高度及飞行任务
Table 1 Departure and landing time, flight height and flight mission of Egrett aircraft
架次 日期 飞行时段 飞行高度/km 飞行任务 15:05—15:20 0→3.2 AE17 2006-01-20 15:20—17:20 3.2→11.6 探测飑线,伴有深对流云 17:20—18:30 11.6→0 15:00—17:10 0→12.6 AE21 2006-01-27 17:10—18:20 12.6→13.8 探测消散的卷云,无对流云 18:20—19:00 13.8→0  下载: 导出CSV
-
[1] Chatfield R B, Crutzen P J.Sulfur dioxide in the remote oceanic air:Cloud transport of reactive precursors.J Geophys Res, 1984, 89:7111-7132. doi: 10.1029/JD089iD05p07111 [2] Dickerson R R.Thunderstorms:An important mechanism in the transport of air pollutants.Science, 1987, 235:460-465. doi: 10.1126/science.235.4787.460 [3] Pickering K E, Dickerson R R, Luke W T.Clear-sky vertical profiles of trace gases as influenced by upstream convective activity.J Geophys Res, 1989, 94:14879-14892. doi: 10.1029/JD094iD12p14879 [4] Waddicor D, Vaughan G, Choularton T.Aerosol nucleation and growth in the TTL due to tropical convection during the ACTIVE campaign.Egu General Assembly Conference, 2009, 11(8):634-635. http://adsabs.harvard.edu/abs/2009EGUGA..11.8979W [5] Hamilton J F, Allen G, Watson N M.Observations of an atmospheric chemical equator and its implications for the tropical warm pool region.Journal of Geophysical Research:Atmospheres, 2008, 113(D20):2230-2237. http://www.wanfangdata.com.cn/details/detail.do?_type=perio&id=ea7fdd199d71ecfda69a6226b115f908 [6] Allen G, Vaughan G, Bower K N.Aerosol and trace-gas measurements in the Darwin area during the wet season.Journal of Geophysical Research:Atmospheres, 2008, 113(D6):304-312. http://www.wanfangdata.com.cn/details/detail.do?_type=perio&id=9a11c92cb1dfd3c3730f4a171f416ccf [7] Cotton W R, Alexander G D, Hertenstein R, et al.Cloud venting-A review and some new global annual estimates.Earth Sci Rev, 1995, 39:169-206. doi: 10.1016/0012-8252(95)00007-0 [8] Prather M J, Jacob D J.A persistent imbalance in HOx and NOx photochemistry of upper troposphere driven by deep tropical convection.Geophys Res Lett, 1997, 24:3189-3192. doi: 10.1029/97GL03027 [9] Browell E V, Fenn M A, Butler C F, et al.Ozone and aerosol distributions and air mass characteristics over the South Atlantic Basin during the burning season.J Geophys Res, 1996, 101(D19):24043-24068. doi: 10.1029/95JD02536 [10] 李冰, 刘小红, 洪钟祥, 等.深对流云输送对于对流层O3, NOx再分布的作用.气候与环境研究, 1999, 4(3):291-296. doi: 10.3878/j.issn.1006-9585.1999.03.10 [11] 李冰, 刘小红, 洪钟祥, 等.三维对流云对大气光化学组分的再分布作用及其化学效应.大气科学, 2001, 25(2):260-268. doi: 10.3878/j.issn.1006-9895.2001.02.12 [12] 银燕, 曲平, 金莲姬, 等.热带深对流云对CO、NO、NOx和O3的垂直输送作用.大气科学, 2010, 34(5):925-936. doi: 10.3878/j.issn.1006-9895.2010.05.08 [13] 刘宁微, 马建中.东亚区域对流层臭氧及其前体物的季节性关联.应用气象学报, 2017, 28(4):427-435. http://qikan.camscma.cn/jams/ch/reader/view_abstract.aspx?file_no=20170404&flag=1 [14] 洪盛茂, 焦荔, 何曦, 等.杭州市区大气臭氧浓度变化及气象要素影响.应用气象学报, 2009, 20(5):602-611. doi: 10.3969/j.issn.1001-7313.2009.05.012 [15] 黄健, 刘作挺, 黄敏辉, 等.珠江三角洲区域大气输送和扩散的季节特征.应用气象学报, 2010, 21(6):698-708. doi: 10.3969/j.issn.1001-7313.2010.06.006 [16] 李莹, 赵春生, 方圆圆, 等.利用卫星资料分析对流层臭氧柱总量分布特征及其可能的原因.应用气象学报, 2007, 18(2):181-186. doi: 10.3969/j.issn.1001-7313.2007.02.007 [17] Whiteway J, Cook C, Gallagher M, et al.Anatomy of cirrus clouds:Results from the Emerald airborne campaigns.Geophys Res Lett, 2004, 31, L24102, DOI: 10.1029/2004GL021201. [18] Gallagher M W, Connolly P J, Whiteway J, et al.An overview of the microphysical structure of cirrus clouds observed during EMERALD-1.Q J R Meteorol Soc, 2005, 131:1143-1169. doi: 10.1256/qj.03.138 [19] 谢健标, 林良勋, 颜文胜, 等.广东2005年"3·22"强飑线天气过程分析.应用气象学报, 2007, 18(3):321-329. doi: 10.3969/j.issn.1001-7313.2007.03.008 [20] 姚建群, 戴建华, 姚祖庆, 等.一次强飑线的成因及维持和加强机制分析.应用气象学报, 2005, 16(6):746-753. doi: 10.3969/j.issn.1001-7313.2005.06.005 [21] 陈淑琴, 章丽娜, 俞小鼎, 等.浙北沿海连续3次飑线演变过程的环境条件.应用气象学报, 2017, 28(3):357-367. http://qikan.camscma.cn/jams/ch/reader/view_abstract.aspx?file_no=20170309&flag=1 [22] 王彦, 于莉莉, 李艳伟, 等.边界层辐合线对强对流系统形成和发展的作用.应用气象学报, 2011, 22(6):724-731. doi: 10.3969/j.issn.1001-7313.2011.06.010 [23] Maddox R A.Meso-scale convective complex.Bull Amer Meteor Soc, 1980, 61:1374-1387. doi: 10.1175/1520-0477(1980)061<1374:MCC>2.0.CO;2 -

计量
- 摘要浏览量: 2428
- HTML全文浏览量: 1205
- PDF下载量: 247
- 被引次数: 0
