
 设为首页
设为首页 加入收藏
加入收藏

Observation of the Whole Discharge Process During a Multi-stroke Triggered Lightning by Continuous Interferometer
-
摘要: 基于自主研发的闪电连续干涉仪,对2019年6月11日在中国气象局雷电野外科学试验基地广州从化人工引雷试验场成功触发的一次多回击闪电放电全过程进行观测,结合通道底部电流数据和电场变化数据,共同揭示触发闪电全放电过程:连续干涉仪能够定位到最小为8 A的不连续的先驱电流脉冲辐射信号,初始先驱电流脉冲(IPCP)的平均转移电荷量约为先驱电流脉冲(PCP)的2倍;上行正先导连续发展后为初始连续电流(ICC)过程,最初正流光通道以105 m·s-1量级的速度继续发展延伸,之后出现反冲先导放电;在ICC阶段出现的经典M分量,可由向前的106 m·s-1量级速度的正流光(先导)产生,也可由已有通道头部产生的反冲先导产生,且整个M分量过程中,多个反冲先导维持了放电过程的持续;之后的回击间过程以反冲先导为主要放电形式,回击电流脉冲之前存在多次反冲先导过程,但多数未发展到接地通道,只处于企图先导阶段,直至成功的先导回击产生;而前两次回击具有超短的时间间隔,约为4.5 ms,这是由于两次回击前的先导来源于云内不同分支的反冲先导过程。Abstract: The discharge process is often discussed in the lightning physics. VHF (very high frequency) observations play an important role in studying lightning discharge processes, because they show where air breakdown occurs. Triggered lightning flashes are ideal research objects, because they are generated in a fixed time and place. Regular experiments of triggering lightning have been conducted by Chinese Academy of Meteorological Sciences since 2006, and 189 lightning flashes are triggered successfully. Besides regular observations, such as fast/slow antenna, channel-based current and high-speed video, the continuous interferometer (CINTF) is developed and deployed at the site for triggered lightning after 2016 in order to observe detailed discharge processes. The CINTF can provide high-precision location with time resolution of around 1 μs.A multi-stroke triggered lightning with 8 return strokes is observed by a self-developed lightning continuous interferometer during Guangdong Comprehensive Observation Experiment on Lightning Discharge on 11 June 2019. The whole discharge processes, including precursor current pulse, initial precursor current pulse, initial continuous current and return strokes, last for about 1600 ms. The channel-based current, electric field change and radiation source positions are obtained. CINTF results show that the radiation signal generated from discrete precursor current pulse with a minimum value of about 8 A can be detected. The average transfer charge of initial precursor current pulse is twice as much as that of the precursor current pulse. During the initial continuous current stage after continuously developing of the upward positive leader, the obviously forward channel extension is the main discharge form at the beginning, and then the extension can be accompanied by discontinuously backward propagation, and recoil leader often occurs in the following stage. M-component in the ICC stage is caused by two discharge processes:Forward positive streamer (or leader) or recoil leader generated in the existing channel. Multi recoil leaders occur during the whole M process, which maintain M discharge. The main discharge form in return stroke stage is recoiling discharge. There are multi recoil leaders before return strokes, however, most of them cannot develop to ground, keep as an attempted leader until the last leader-stroke occurs. Adjacent two strokes with a short duration time of 4.5 ms have the same optical channel in optical images, but they are obviously different in development paths, which lead to a very short RS interval.
-

图 2 触发闪电全过程辐射源分布、通道电流(红线)和电场变化波形(辐射源颜色代表时间)
(a)慢电场波形, (b)辐射源时间-仰角分布和对应电流波形, (c)辐射源半球投影, (d)辐射源方位角-仰角分布
Fig. 2 Radiation sources distribution, channel-base current and electric field change waveform during the whole triggered lightning (colors of radiation sources corresponding to time)
(a)waveform of slow electric field change, (b)elevation of radiation sources versus time and the corresponding current waveform, (c)hemispherical projection of radiation sources, (d)elevation of radiation sources versus azimuth
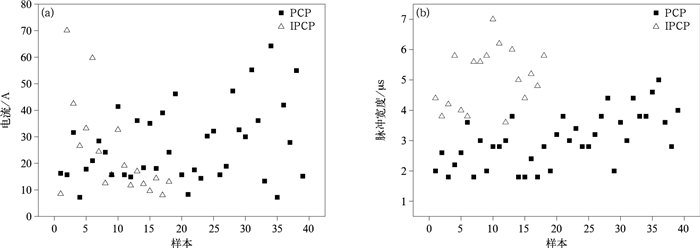
图 3 PCP和IPCP的电流峰值分布(a)和脉冲宽度分布(b)
Fig. 3 Distribution of peak current(a) and distribution of pulse width(b) for PCP and IPCP

图 4 ICC阶段辐射源分布、通道电流(红线)和电场变化波形(辐射源颜色代表时间)
(a)慢电场波形, (b)辐射源时间-仰角分布和对应电流波形, (c)辐射源半球投影, (d)辐射源方位角-仰角分布
Fig. 4 Radiation sources distribution, channel-base current and electric field change waveform during ICC stage (colors of radiation sources corresponding to time)
(a)waveform of slow electric field change, (b)elevation of radiation sources versus time and the corresponding current waveform, (c)hemispherical projection of radiation sources, (d)elevation of radiation sources versus azimuth
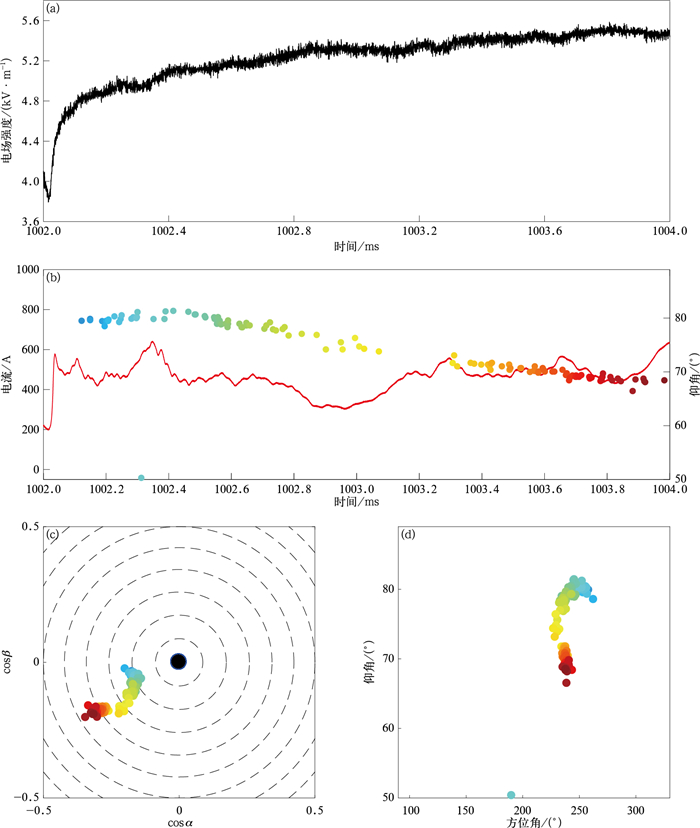
图 5 1002~1004 ms辐射源分布、通道电流(红色曲线)和电场变化波形(辐射源颜色代表时间)
(a)慢电场波形, (b)辐射源时间-仰角分布和对应电流波形, (c)辐射源半球投影, (d)辐射源方位角-仰角分布
Fig. 5 Radiation sources distribution, channel-base current and electric field change waveform during 1002-1004 ms (colors of radiation sources corresponding to time)
(a)waveform of slow electric field change, (b)elevation of radiation sources versus time and the corresponding current waveform, (c)hemispherical projection of radiation sources, (d)elevation of radiation sources versus azimuth
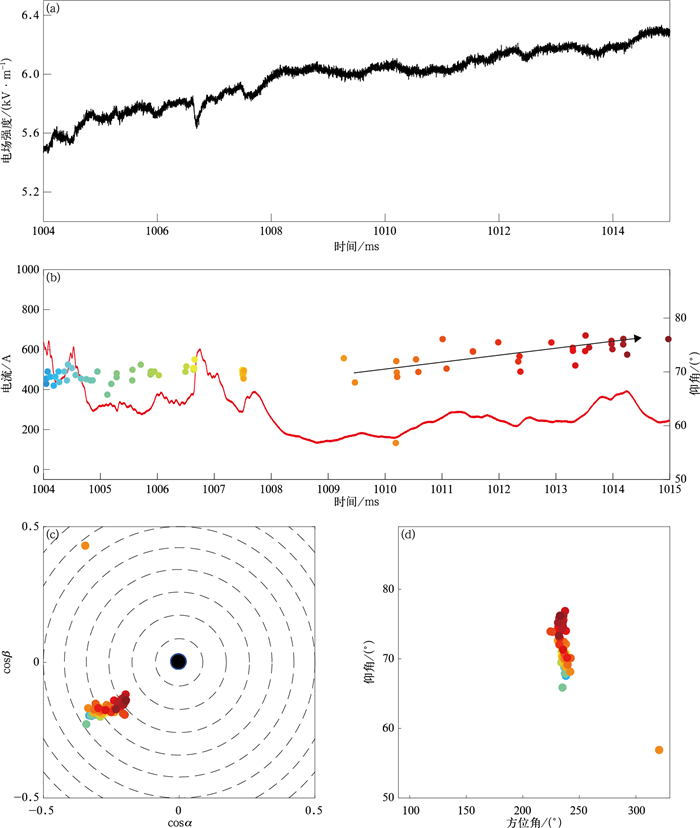
图 6 1004~1015 ms的辐射源分布、电流波形(红色曲线)和电场变化波形(辐射源颜色代表时间)
(a)慢电场波形, (b)辐射源时间-仰角分布和对应电流波形, (c)辐射源半球投影, (d)辐射源方位角-仰角分布
Fig. 6 Radiation sources distribution, channel-base current and electric field change waveform during 1004-1015 ms (colors of radiation sources corresponding to time)
(a)waveform of slow electric field change, (b)elevation of radiation sources versus time and the corresponding current waveform, (c)hemispherical projection of radiation sources, (d)elevation of radiation sources versus azimuth

图 7 一个M分量的辐射源分布、电流波形(红色曲线)和电场变化波形(辐射源颜色代表时间)
(a)慢电场波形, (b)辐射源时间-仰角分布和对应电流波形, (c)辐射源半球投影, (d)辐射源方位角-仰角分布
Fig. 7 Radiation sources distribution, channel-base current and electric field change waveform during a M discharge (colors of radiation sources corresponding to time)
(a)waveform of slow electric field change, (b)elevation of radiation sources versus time and the corresponding current waveform, (c)hemispherical projection of radiation sources, (d)elevation of radiation sources versus azimuth
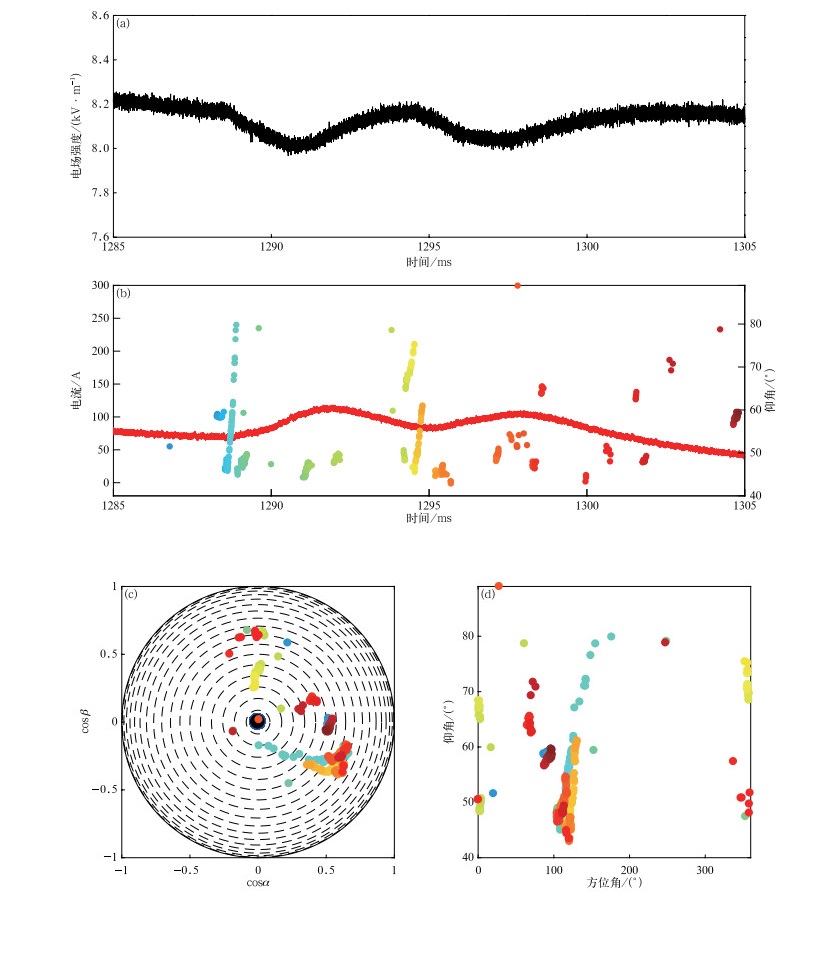
图 8 1285~1305 ms M分量的辐射源分布、电流波形(红色曲线)和电场变化波形(辐射源颜色代表时间)
(a)慢电场波形, (b)辐射源时间-仰角分布和对应电流波形, (c)辐射源半球投影, (d)辐射源方位角-仰角分布
Fig. 8 Radiation sources distribution, channel-base current and electric field change waveform during M discharge during 1285-1305 ms (colors of radiation sources corresponding to time)
(a)waveform of slow electric field change, (b)elevation of radiation sources versus time and the corresponding current waveform, (c)hemispherical projection of radiation sources, (d)elevation of radiation sources versus azimuth

图 9 第1、2次回击间放电的辐射源分布、电流波形(红线)和电场变化波形(辐射源颜色代表时间,指向RS1和RS2的箭头分别代表第1和第2次回击前的发展路径)
(a)慢电场波形, (b)辐射源时间-仰角分布和对应电流波形, (c)辐射源半球投影, (d)辐射源方位角-仰角分布
Fig. 9 Radiation sources distribution, channel-base current and electric field change waveform during the 1st RS and the 2nd RS (colors of radiation sources corresponding to time, arrows to RS1 and RS2 represent development paths before the first return stroke and the second return stroke)
(a)waveform of slow electric field change, (b)elevation of radiation sources versus time and the corresponding current waveform, (c)hemispherical projection of radiation sources, (d)elevation of radiation sources versus azimuth
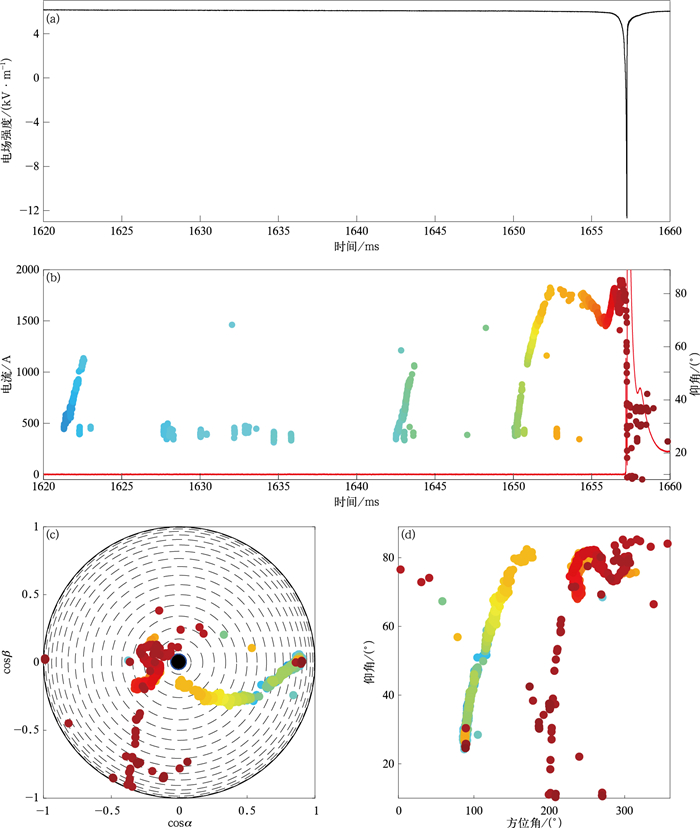
图 10 第6次回击前放电的辐射源分布、电流波形(红色曲线)和电场变化波形(辐射源颜色代表时间)
(a)慢电场波形, (b)辐射源时间-仰角分布和对应电流波形, (c)辐射源半球投影, (d)辐射源方位角-仰角分布
Fig. 10 Radiation sources distribution, channel-base current and electric field change waveform before the 6th RS (colors of radiation sources corresponding to time)
(a)waveform of slow electric field change, (b)elevation of radiation sources versus time and the corresponding current waveform, (c)hemispherical projection of radiation sources, (d)elevation of radiation sources versus azimuth
表 1 先驱放电过程的电流参量
Table 1 Current parameters during precursor current pulse stage
发展阶段 脉冲样本量 持续时间 平均峰值/A 脉冲宽度/μs 平均转移电荷/μC 整体转移电荷/μC PCP 39 650 ms 26.8 3.0 21.0 824 IPCP 18 400 μs 23.9 4.9 41.3 743  下载: 导出CSV
表 2 回击过程电流参量
Table 2 Current parameters during return stroke stage
回击次序 时间间隔/ms 峰值/ kA 转移电荷量/C 1 0 10.57 0.59 2 4.5 5.66 0.48 3 87.6 12.69 0.66 4 30 13.73 0.66 5 70 13.82 0.73 6 100 20.86 1.66 7 90 16.55 0.90 8 190 36.45 5.32 平均值 71 16.29 1.37
下载: 导出CSV
-
[1] 武斌, 张广庶, 文军, 等.闪电初始预击穿过程辐射脉冲特征及电流模型.应用气象学报, 2017, 28(5):555-567. doi: 10.11898/1001-7313.20170504 [2] 张义军, 周秀骥.雷电研究的回顾和进展.应用气象学报, 2006, 17(6):829-834. doi: 10.3969/j.issn.1001-7313.2006.06.019 [3] 谢盟, 张阳, 张义军, 等.两种类型M分量物理特征和机制对比.应用气象学报, 2015, 26(4):69-77. doi: 10.11898/1001-7313.20150407 [4] 肖桐, 张阳, 吕伟涛, 等.人工触发闪电M分量的电流与电磁场特征.应用气象学报, 2013, 24(4):446-454. doi: 10.3969/j.issn.1001-7313.2013.04.007 [5] 谭涌波, 张冬冬, 周博文, 等.地闪近地面形态特征的数值模拟.应用气象学报, 2015, 26(2):211-220. doi: 10.11898/1001-7313.20150209 [6] 张义军, 杨少杰, 吕伟涛, 等.2006-2011年广州人工触发闪电观测试验和应用.应用气象学报, 2012, 23(5):513-522. doi: 10.3969/j.issn.1001-7313.2012.05.001 [7] 周方聪, 张义军, 吕伟涛, 等.人工触发闪电连续电流过程与M分量特征.应用气象学报, 2014, 25(3):330-338. doi: 10.3969/j.issn.1001-7313.2014.03.010 [8] Qie X S, Zhang Y J, Yuan T, et al.A review of atmospheric electricity research in China.Adv Atmos Sci, 2015, 32(2):169-191. doi: 10.1007/s00376-014-0003-z [9] Rakov V A, Uman M A, Rambo K J, et al.New insights into lightning processes gained from triggered-lightning experiments in Florida and Alabama.J Geophys Res, 1998, 103(D12):14117-14130. doi: 10.1029/97JD02149 [10] 钱勇, 张阳, 张义军, 等.人工触发闪电先驱电流脉冲波形特征及模拟.应用气象学报, 2016, 27(6):716-724. doi: 10.11898/1001-7313.20160608 [11] 张义军, 吕伟涛, 陈绍东, 等.广东野外雷电综合观测试验十年进展.气象学报, 2016, 74(5):655-671. http://d.old.wanfangdata.com.cn/Periodical/qxxb201605001 [12] Lu W T, Zhang Y J, Zhou X J, et al.Simultaneous optical and electrical observations on the initial processes of altitude-triggered negative lightning.Atmos Res, 2009, 91(2/4):353-359. [13] 李俊, 吕伟涛, 张义军, 等.一次多分叉多接地的空中触发闪电过程.应用气象学报, 2010, 21(1):95-100. doi: 10.3969/j.issn.1001-7313.2010.01.013 [14] Winn W P, Eastvedt E M, Trueblood J J, et al.Luminous pulses during triggered lightning.J Geophys Res, 2012, 117:D10204. http://d.old.wanfangdata.com.cn/NSTLQK/NSTL_QKJJ0227153095/ [15] Edens H E, Eack K B, Eastvedt E M, et al.VHF lightning mapping observations of a triggered lightning flash.Geophys Res Let, 2012, 39(19):L19807. [16] Shao X M, Stanley M A, Krehbiel P R, et al.Results of Observations with the New Mexico Tech VHF Interferometer//10th International Conference on Atmospheric Electricity, Soc of Atmos Electr of Jpn, Toyokawa, 1996: 317-320. [17] Dong W, Liu X, Yu Y, et al.Broadband interferometer observations of a triggered lightning.Chin Sci Bull, 2001, 46(18):1561-1565. doi: 10.1007/BF02900582 [18] Sun Z, Qie X, Jiang R, et al.Characteristics of a rocket-triggered lightning flash with large stroke number and the associated leader propagation.J Geophys Res Atmos, 2014, 119:13388-13399. doi: 10.1002/2014JD022100 [19] Stock M G, Akita M, Krehbiel P R, et al.Continuous broadband digital interferometry of lightning using a generalized cross-correlation algorithm.J Geophys Res Atmos, 2014, 119:3134-3165. http://www.wanfangdata.com.cn/details/detail.do?_type=perio&id=5ce957f0750878109425a7f7aca55b5a [20] Li Y, Qiu S, Shi L, et al.Three-dimensional reconstruction of cloud-to-ground lightning using high-speed video and VHF broadband interferometer.J Geophys Res Atmos, 2017, 122:13420-13435. doi: 10.1002/2017JD027214 [21] Zhang Y, Krehbiel P R, Zhang Y J, et al.Observations of the initial stage of a rocket-and-wire triggered lightning discharge.Geophys Res Lett, 2017, 44(9):4332-4340. doi: 10.1002/2017GL072843 [22] Chen Z, Zhang Y, Zheng D, et al.A method of three-dimensional location for LFEDA combining the time of arrival method and the time reversal technique.J Geophys Res Atmos, 2019, 124:6484-6500. doi: 10.1029/2019JD030401 [23] Zhang Y, Zhang Y J, Zheng D, et al.Characteristics and discharge processes of M events with large current in triggered lightning.Radio Science, 2018, 53(8):974-985. doi: 10.1029/2018RS006552 [24] Zhang Y, Zhang Y J, Xie M, et al.Characteristics and correlation of return stroke, M component and continuing current for triggered lightning.Electric Power System Research, 2016, 139:10-15. doi: 10.1016/j.epsr.2015.11.024 [25] William R, Krehbiel P R, Stock M G, et al.Observations of narrow bipolar events reveal how lightning is initiated in thunderstorms.Nature Communications, 2016, 7:10721. doi: 10.1038/ncomms10721 [26] Shao X M, Krehbiel P R, Thomas R J, et al.Radio interferometric observations of cloud-to-ground lightning phenomena in Florida.J Geophys Res, 1995, 100(D2):2749-2783. doi: 10.1029/94JD01943 [27] Yoshida S, Biagi C J, Rakov V A, et al.Three-dimensional imaging of upward positive leaders in triggered lightning using VHF broadband digital interferometers.Geophys Res Lett, 2010, 37:L05805. http://www.wanfangdata.com.cn/details/detail.do?_type=perio&id=d12d3932c283cf68cba0ed713759dbc6 [28] Zheng D, Zhang Y J, Zhang Y, et al.Characteristics of the initial stage and return stroke currents of rocket-triggered lightning flashes in southern China.J Geophys Res Atmos, 2017, 122(12):6431-6452. doi: 10.1002/2016JD026235 [29] 张广庶, 赵玉祥, 郄秀书, 等.利用无线电窄带干涉仪定位系统对地闪全过程的观测与研究.中国科学(D辑), 2008, 38(9):1167-1180. doi: 10.3321/j.issn:1006-9267.2008.09.013 -

计量
- 摘要浏览量: 3192
- HTML全文浏览量: 1198
- PDF下载量: 61
- 被引次数: 0
