
 设为首页
设为首页 加入收藏
加入收藏

Extremity Analysis on the Precipitation and Environmental Field of Typhoon Rumbia in 2018
-
摘要: 利用多种观测及分析资料对台风温比亚(1818)暴雨过程的降水演变、极端降水特点及环境场物理量特征等进行分析。此次台风暴雨日降水量极端性显著,降水主要分为登陆前后、深入内陆并转向以及冷空气作用和变性3个阶段,其中第2阶段为最强降水时段。受其影响,河南、山东等地多个站点的日降水量突破历史极值。温比亚(1818)最大小时降水量达127.7 mm,其中74个站点小时降水量超过80 mm,短时强降水维持时间长达14 h,高降水效率及长持续时间造成极端降水。对流层中、低层存在标准化异常小于-4倍标准差的异常低压环流,造成极端低层辐合,叠加高空急流和高压边缘的极端高空辐散,动力条件极端性显著,200 hPa辐散和850 hPa辐合均接近或远超1988—2017年日降水量排名前30(HT30)降水日的最大值。受台风东侧水汽输送影响,降水区假相当位温、整层大气可降水量和水汽通量散度无论与气候态相比,还是与HT30降水日相比,均具有显著极端性,且极端水汽维持时间长达30 h。Abstract: Using a variety of observational and analytical data, the evolution of heavy precipitation, features of extreme precipitation and physical characteristics of environmental field causing extreme precipitation of Typhoon Rumbia in 2018 are analyzed. Obvious extremity can be seen with the daily rainfall at many national observational stations breaking historic records. The rainstorm process of Typhoon Rumbia can be divided into three stages: Landing, moving further inland and turning, and extratropical transition due to cold air intrusion. In the second stage, the typhoon moves very slowly and the circulation of Typhoon Rumbia stays over Henan Province for very long time, which makes the second stage the strongest precipitation period. Influenced by Typhoon Rumbia, historical daily precipitation records of many national stations in eastern Henan, southwestern Shandong and northern Shandong are broken. The observed maximum hourly precipitation is 127.7 mm, and as many as 74 stations experience an hourly precipitation of more than 80 mm. Furthermore, short-term heavy rainfall feature is very obvious, for more than 14 hours, the hourly accumulated precipitation exceeds 20 mm. Influenced by both the high precipitation efficiency and the long duration, extreme precipitation happens. Due to the atmospheric circulation characteristics of Typhoon Rumbia, there is an abnormal low pressure circulation with the standardized anomaly smaller than -4 times climate standard deviation in middle and lower troposphere, which results in extreme low-level convergence. At the same time, extreme upper divergence, induced by the combined actions of both upper tropospheric jet and high-pressure edge, can be seen in upper level. Therefore, there are obvious extreme characteristics in dynamic conditions. Compared with top 30 precipitation days in recent 30 years, 200 hPa divergence and 850 hPa convergence of Typhoon Rumbia are either close to or far beyond the historical maximum. Substantial water vapor is brought and converged in the rainstorm area continuously through the water vapor transport belt on the east side of typhoon, resulting in an extreme water vapor environmental condition. Significant extremity can be seen in many moisture-related physical parameters, such as pseudo-equivalent potential temperature, atmospheric precipitable water and vapor flux divergence, compared with both climatic mean state and historical heavy precipitation days in recent 30 years, and the extreme vapor condition lasts for up to 30 hours.
-
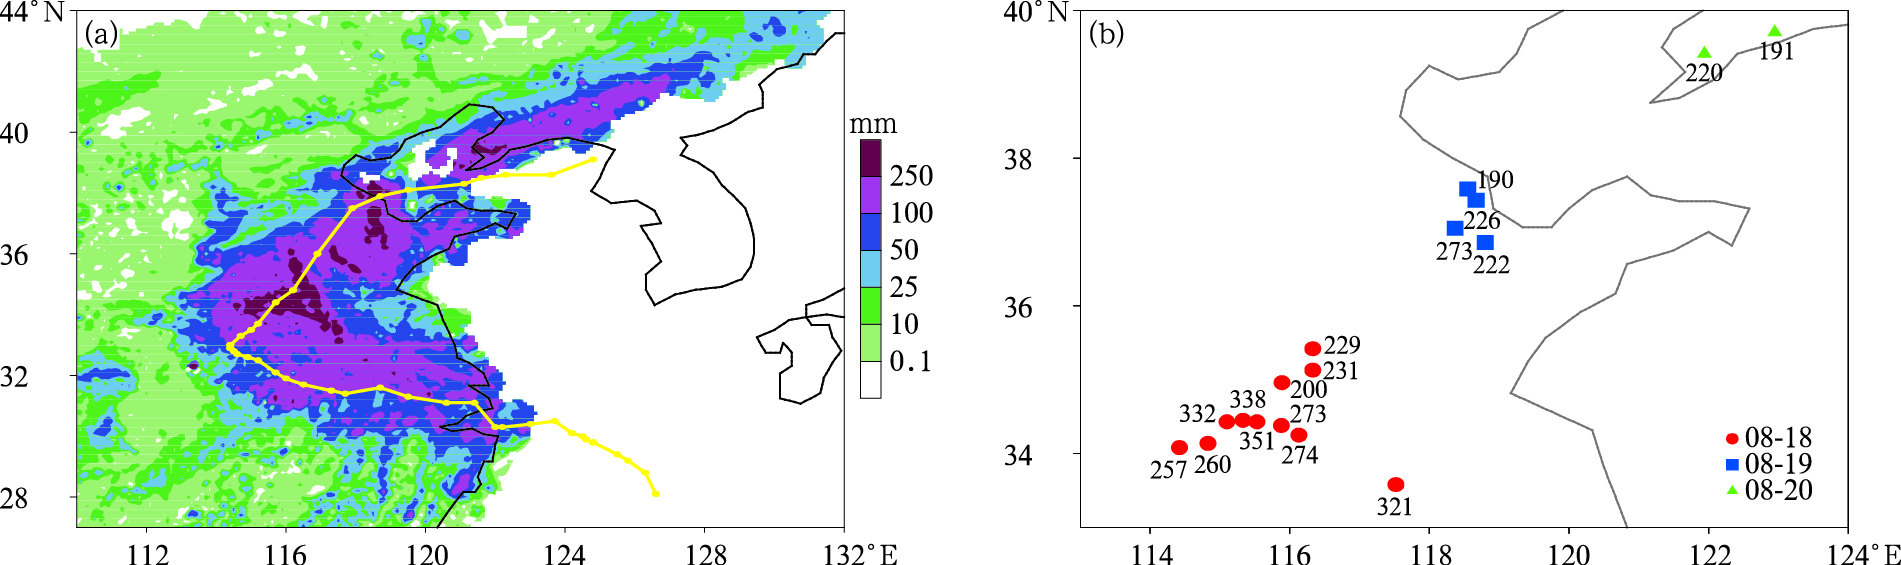
图 1 台风温比亚(1818)降水分布
(a)2018年8月16日08:00—21日08:00过程累积降水量(黄色线条为2018年8月15日14:00—8月20日23:00台风路径),(b)2018年8月18—20日日降水量突破极值站点分布及降水量(单位:mm,不含自动气象站)
Fig. 1 Precipitation distribution of Typhoon Rumbia in 2018
(a)process accumulated precipitation from 0800 BT 16 Aug to 0800 BT 21 Aug in 2018(typhoon track from 1400 BT 15 Aug to 2300 BT 20 Aug 2018 is shown by the yellow line), (b)distribution of extreme precipitation stations and daily precipitation (unit:mm) from 18 Aug to 20 Aug in 2018 (not including automatic weather stations)
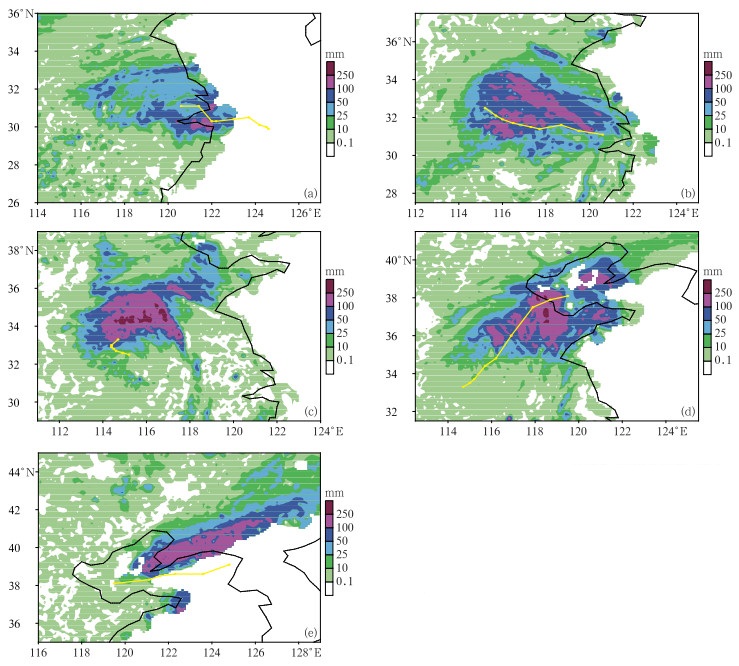
图 2 台风温比亚(1818)24 h累积降水量(填色)及台风路径(黄色线条)
(a)8月16日08:00—17日08:00,(b)17日08:00— 18日08:00,(c)18日08:00—19日08:00,
(d)19日08:00—20日08:00,(e)20日08:00—21日08:00Fig. 2 24 h accumulated precipitation(the shaded) and track (the yellow line) of Typhoon Rumbia in 2018
(a)0800 BT 16 Aug to 0800 BT 17 Aug, (b)0800 BT 17 Aug to 0800 BT 18 Aug, (c)0800 BT 18 Aug to 0800 BT 19 Aug, (d)0800 BT 19 Aug to 0800 BT 20 Aug, (e)0800 BT 20 Aug to 0800 BT 21 Aug
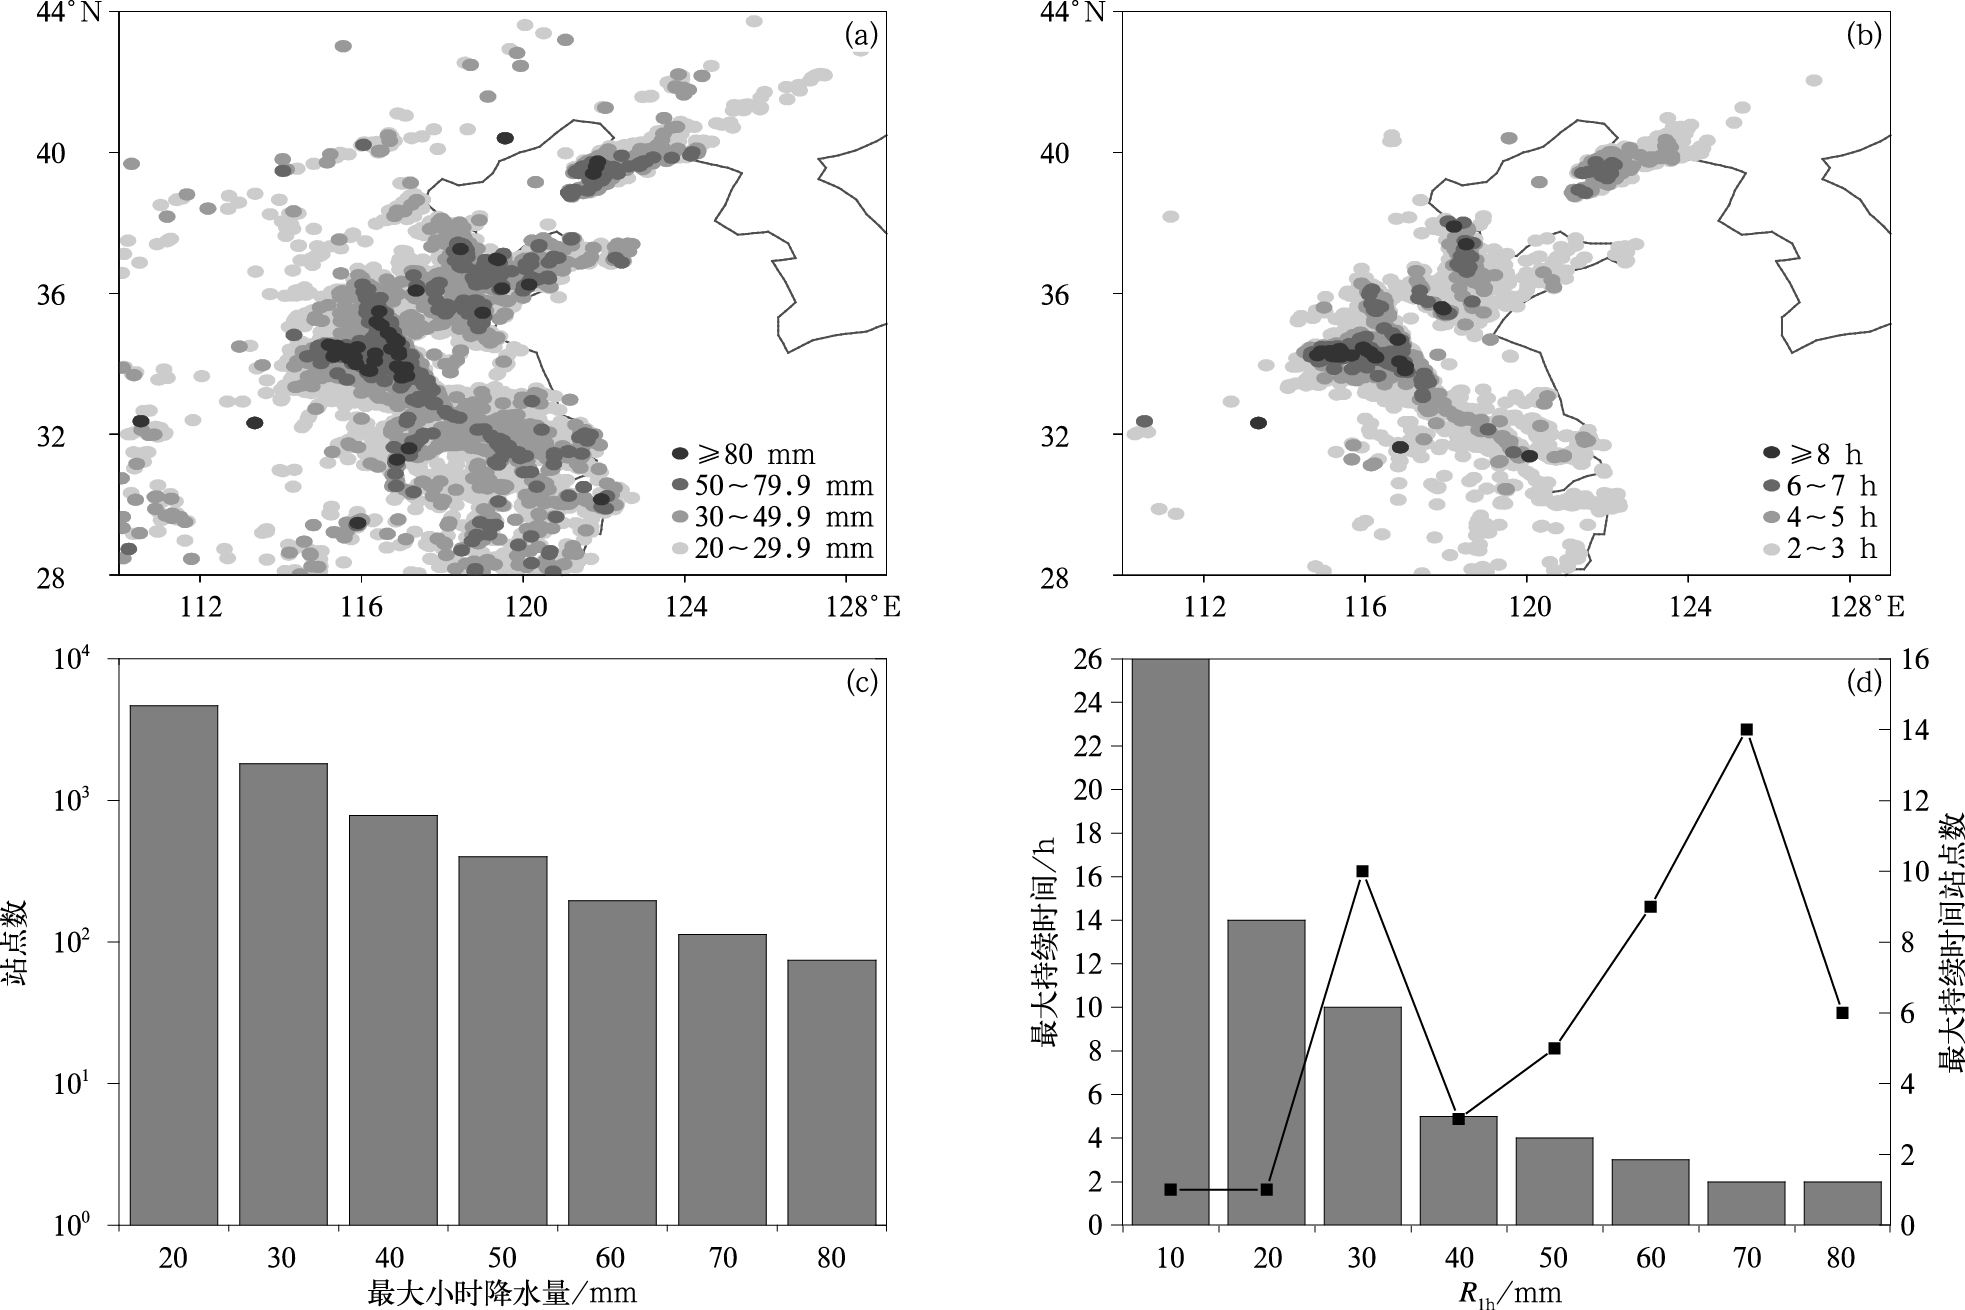
图 3 台风温比亚(1818)小时降水量特征
(a)最大小时降水量空间分布,(b)短时强降水(R1h≥20 mm)持续时间,(c)不同量级小时降水量站点数量直方图,(d)不同量级小时降水量的最大持续时间(直方图)及相应站点数(黑线)
Fig. 3 Characteristics of hourly precipitation of Typhoon Rumbia in 2018
(a)the distribution of maximum hourly precipitation, (b)the duration time of hourly precipitation no less than 20 mm, (c)station numbers of different maximum hourly precipitation, (d)duration time(the histogram) its station numbers(the black line) of different hourly precipitation
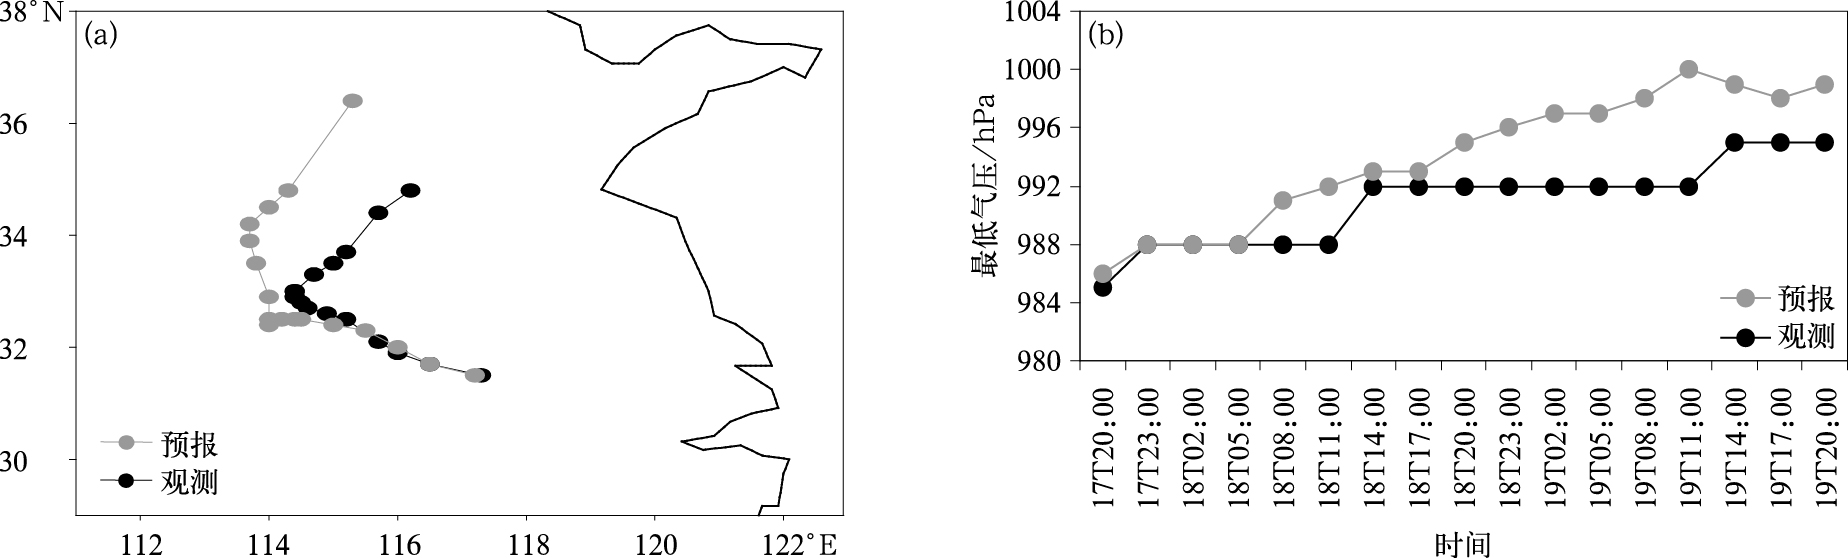
图 4 ECMWF模式预报(2018年8月17日20:00起报)与观测对比
(a)17日20:00—19日20:00台风路径,
(b)17日20:00—19日20:00台风海平面最低气压Fig. 4 Observation and ECMWF forecast of typhoon from 2000 BT 17 Aug to 2000 BT 19 Aug in 2018(initialed at 2000 BT 17 Aug 2018)
(a)track of typhoon, (b)minimum sea-level pressure of typhoon

图 5 ECMWF模式2018年8月17日20:00起报的风场及湿度场预报检验
(a)模式预报18日08:00风场沿34.43°N纬向垂直剖面,(b)17日20:00—19日08:00整层大气可降水量预报检验
Fig. 5 Wind and humidity forecast of ECMWF initialed at 2000 BT 17 Aug 2018
(a)the predicted wind field along 34.43°N at 0800 BT 18 Aug 2018, (b)verification of atmospheric precipitable water forecast from 2000 BT 17 Aug to 0800 BT 19 Aug in 2018
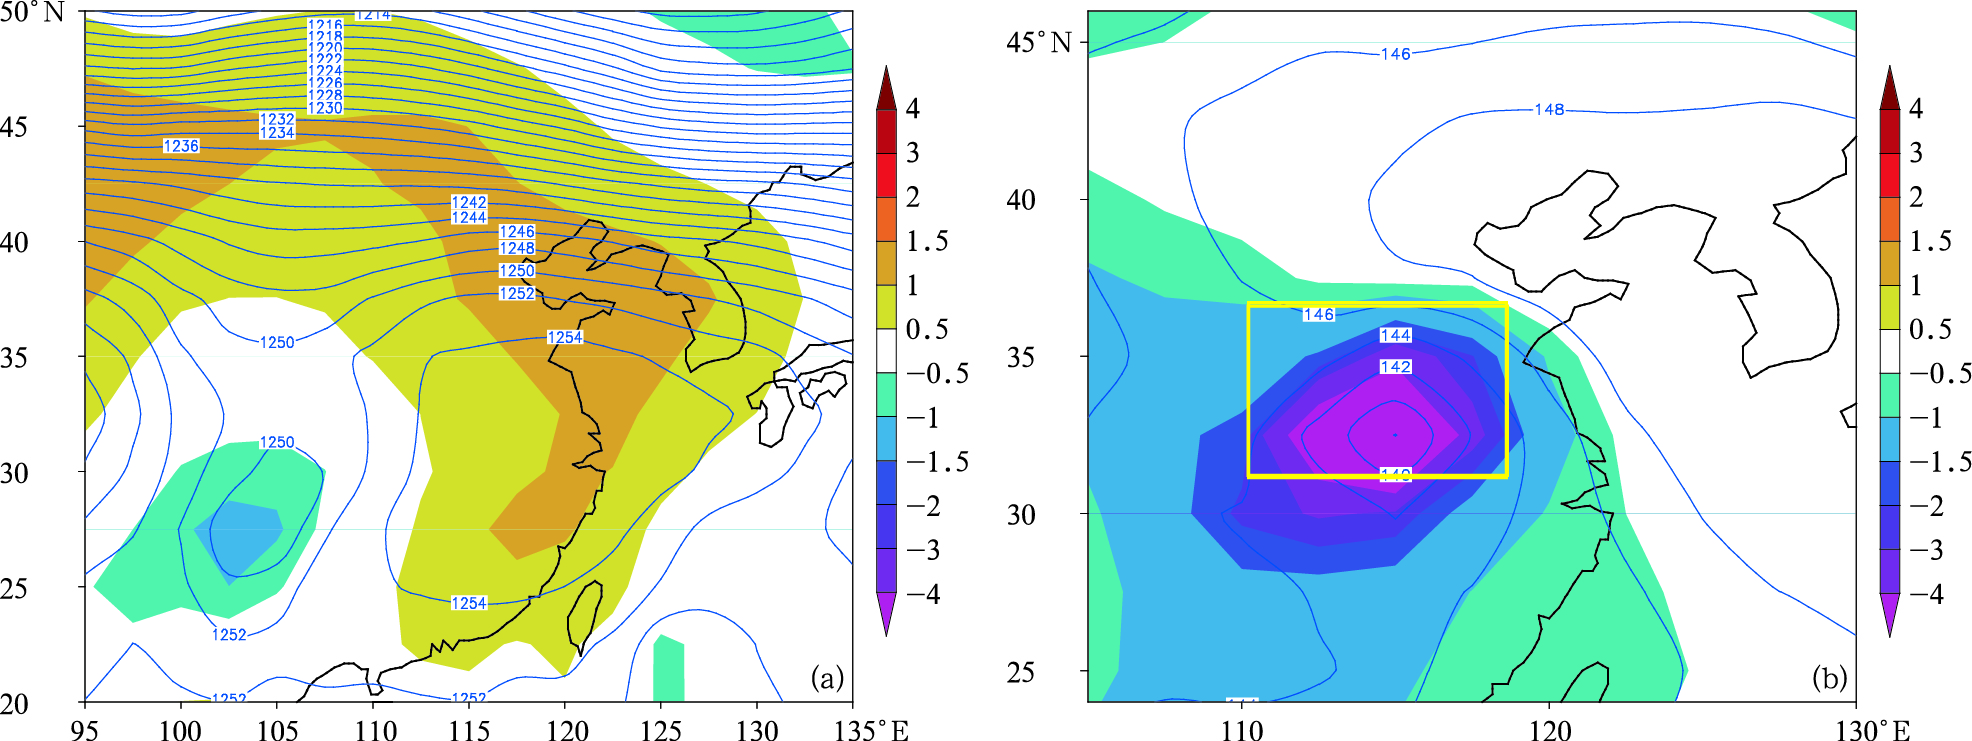
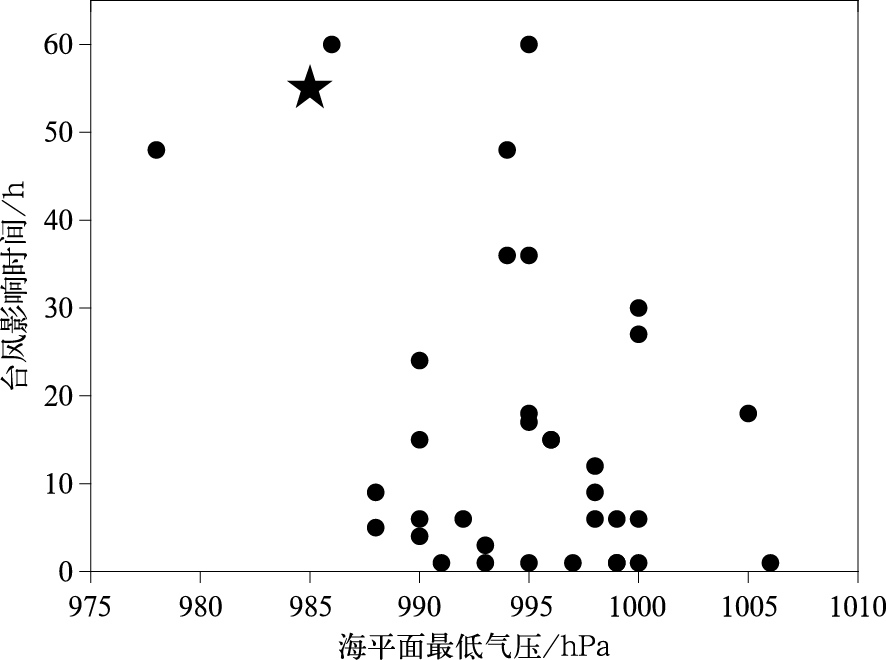
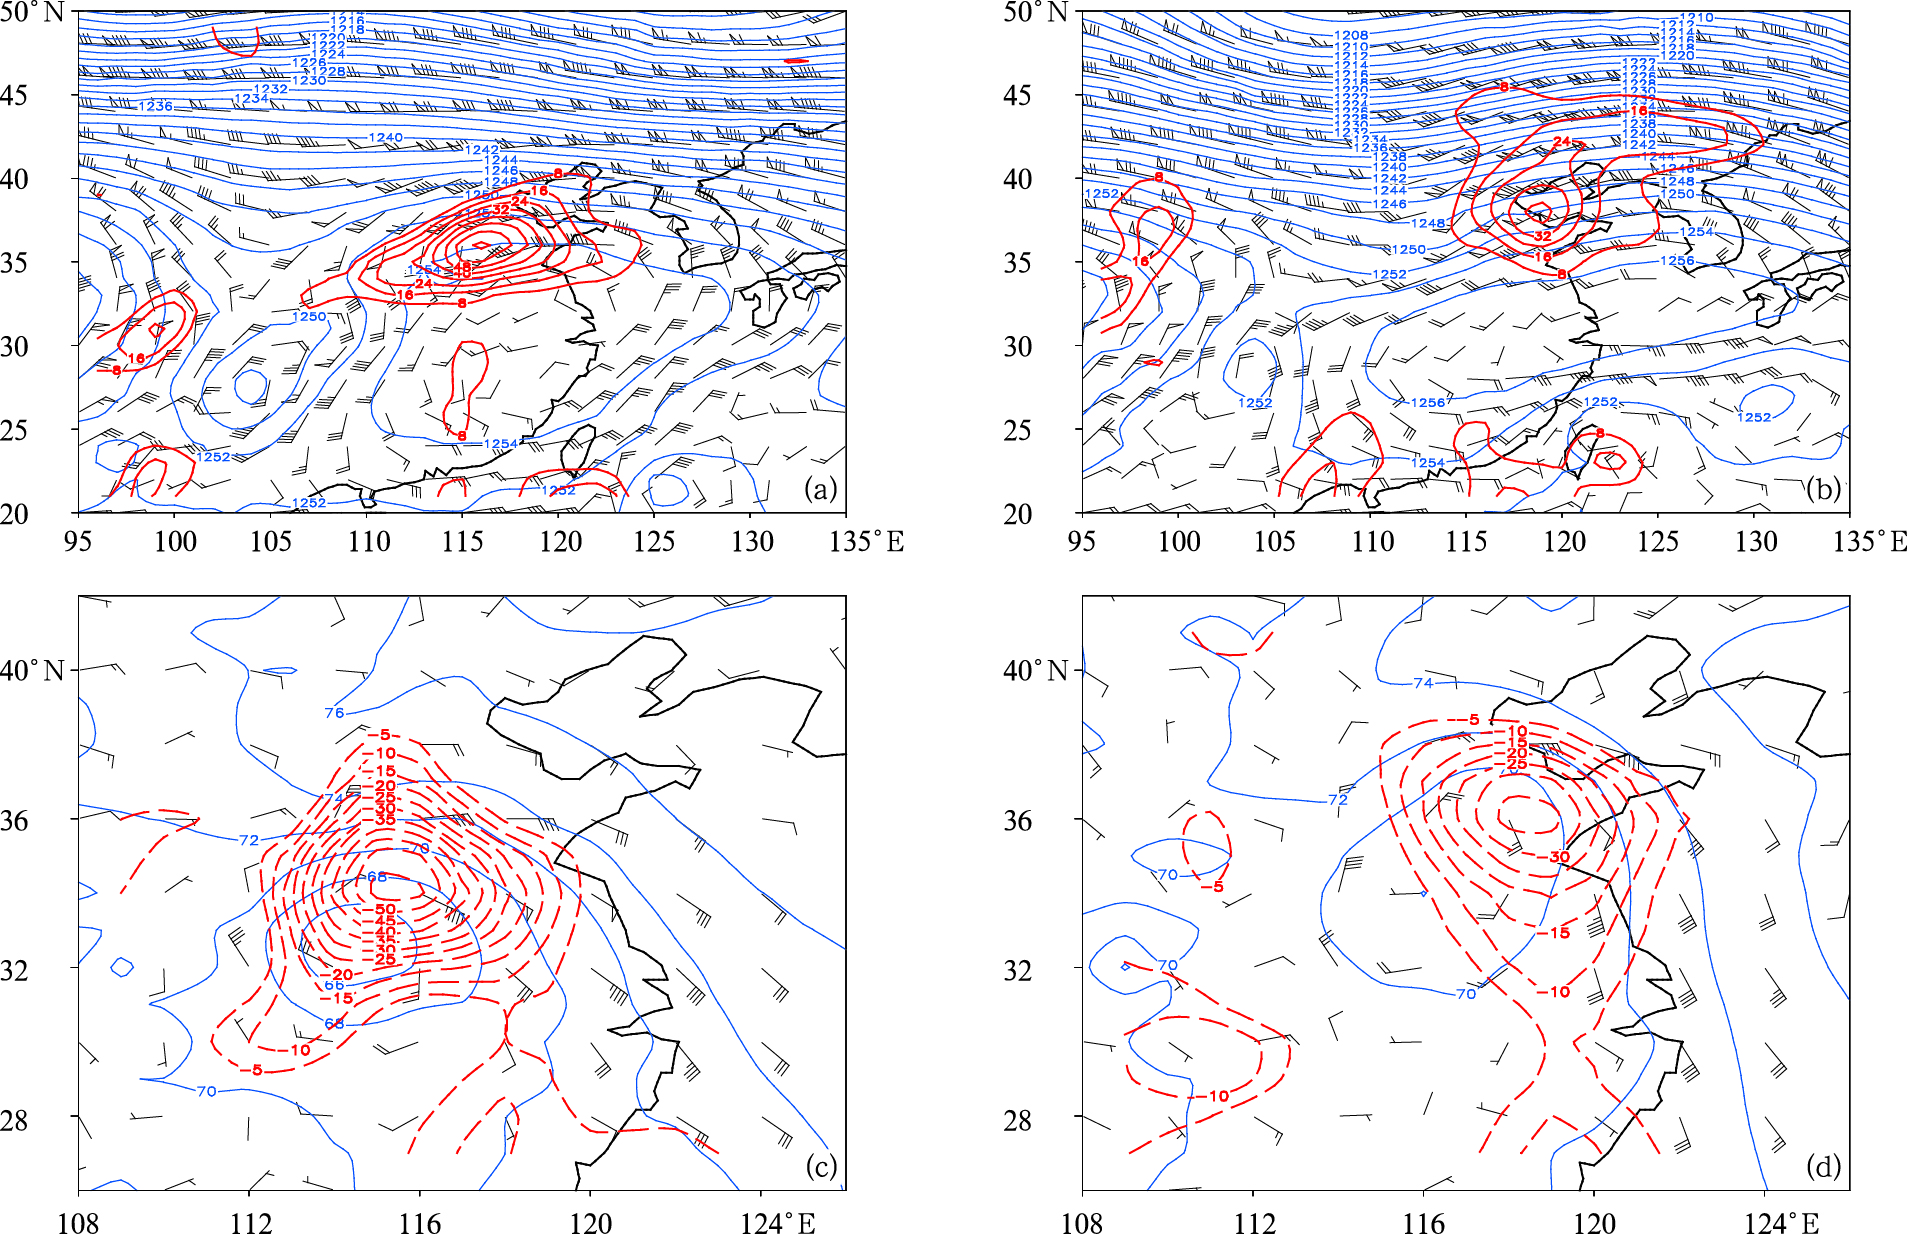
图 8 台风温比亚(1818)影响下的位势高度(蓝色实线,单位:dagpm)、风场(风羽)和散度(红色虚线,单位:10-6 s-1)
(a)200 hPa,2018年8月18日20:00,(b)200 hPa,2018年8月19日20:00,(c)850 hPa,2018年8月18日20:00,(d)850 hPa,2018年8月19日20:00
Fig. 8 Geopotential height(the blue solid line, unit:dagpm), wind(the wind barb) and divergence(the red dashed line, unit:10-6 s-1) of Typhoon Rumbia in 2018
(a)200 hPa, 2000 BT 18 Aug 2018, (b)200 hPa, 2000 BT 19 Aug 2018, (c)850 hPa, 2000 BT 18 Aug 2018, (d)850 hPa, 2000 BT 19 Aug 2018

图 9 商丘、嘉祥和广饶站台风温比亚(1818)强降水过程(虚线)与1988—2017年前30降水日(柱状)的物理量对比
Fig. 9 Comparison of physical parameters of Typhoon Rumbia in 2018(the dashed line) and top 30 precipitation days(the column) from 1988 to 2017 at Shangqiu, Jiaxiang and Guangrao
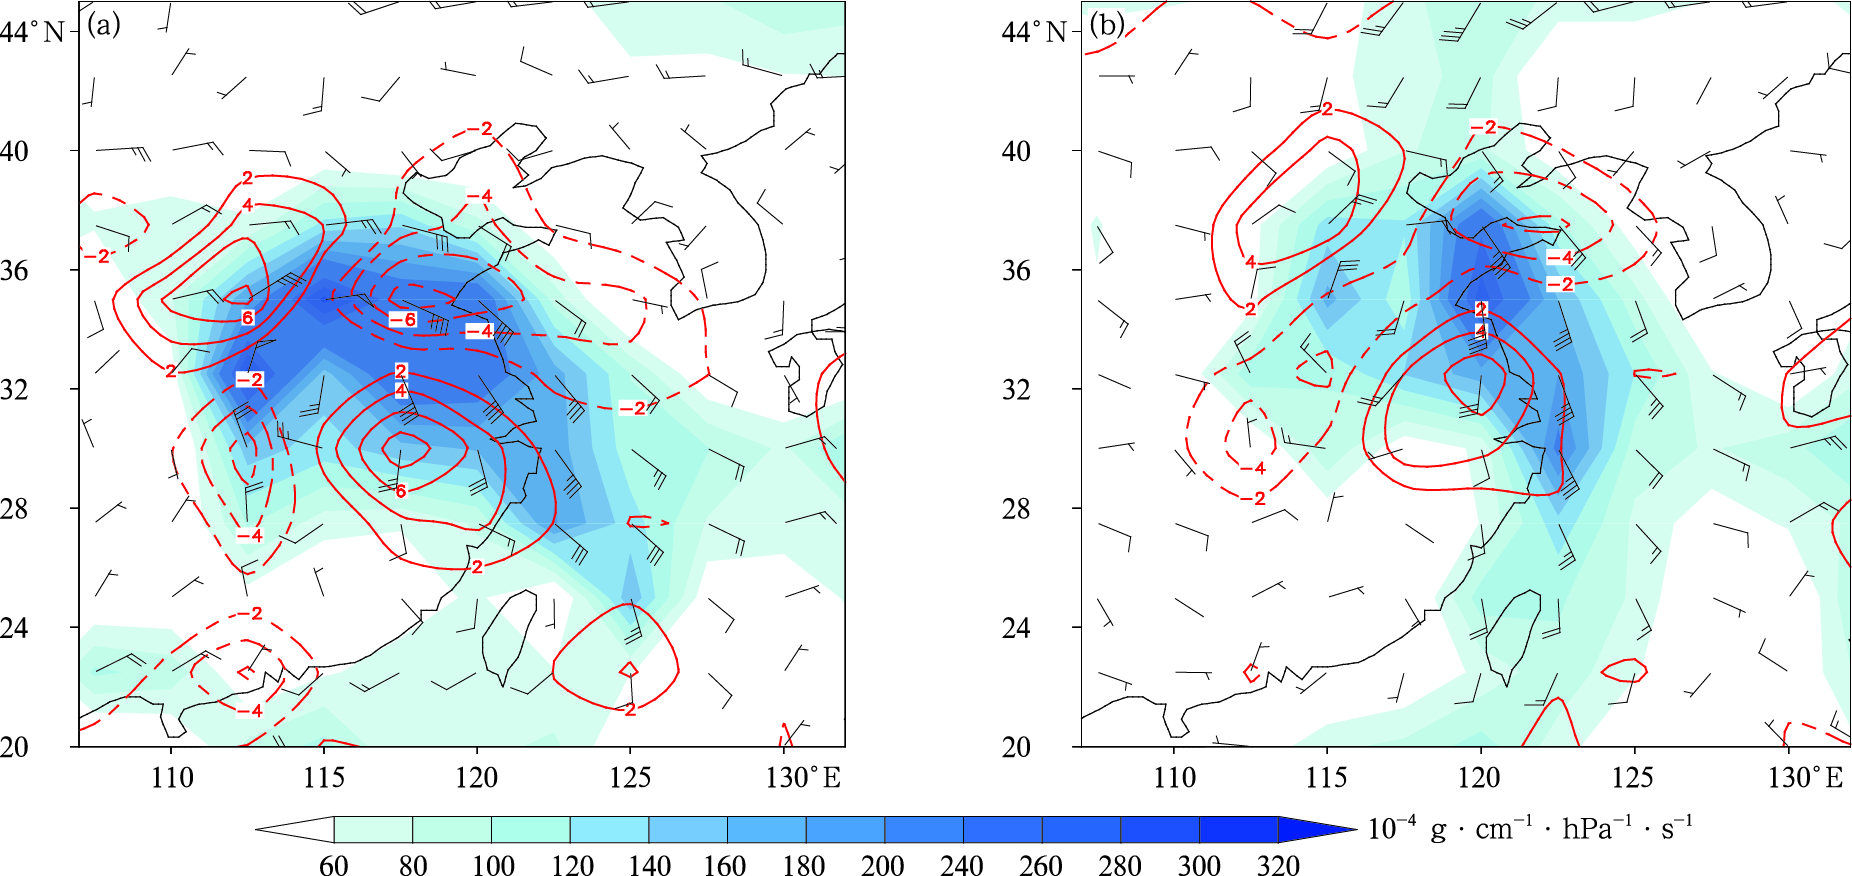
图 10 台风温比亚(1818)850 hPa风场(风羽),水汽通量(填色)和水汽通量散度(红线,单位:10-9 g·cm-2·hPa-1·s-1)
(a)8月18日20:00, (b)8月19日20:00
Fig. 10 850 hPa wind(wind barb), water vapor flux(the shaded) and water vapor flux divergence (the red line, unit:10-9 g·cm-2·hPa-1·s-1) of Typhoon Rumbia in 2018
(a)2000 BT 18 Aug, (b)2000 BT 19 Aug
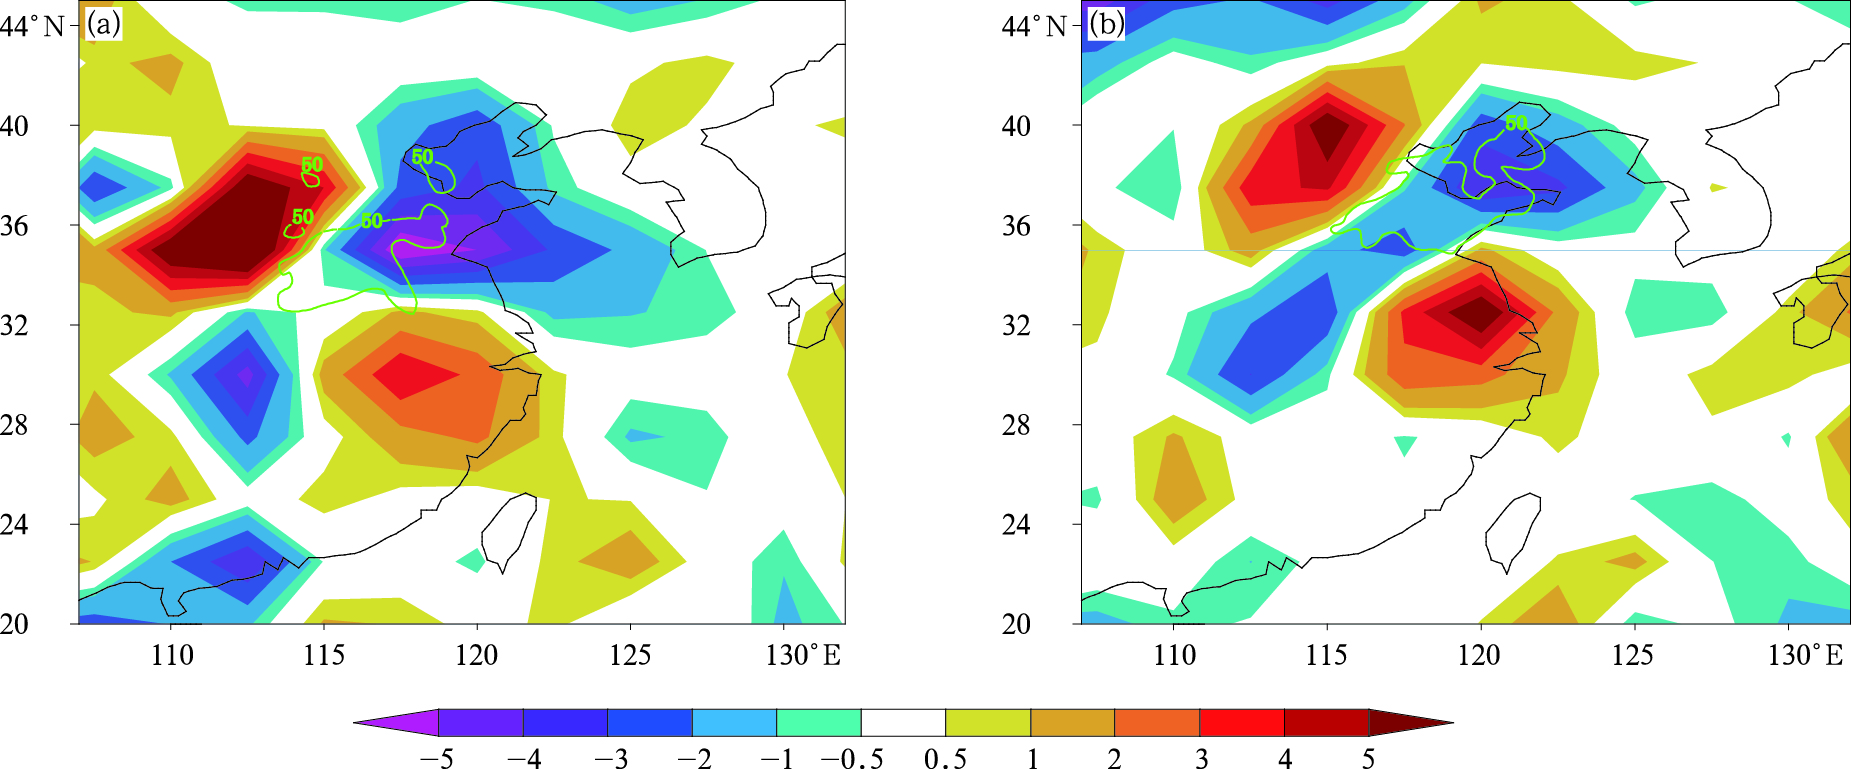
图 11 台风温比亚(1818)850 hPa水汽通量散度标准化异常(填色)
(绿线内分别为8月18日08:00—19日08:00和8月19日08:00—20日08:00 24 h累积降水量不低于50 mm区域)
(a)8月18日20:00, (b)8月19日20:00Fig. 11 Standardized anomaly of water vapor flux divergence(the shaded) of Typhoon Rumbia in 2018
(the area circled by green line denotes 24 h accumulated precipitation no less than 50 mm from 0800 BT 18 Aug to 0800 BT 19 Aug and from 0800 BT 19 Aug to 0800 BT 20 Aug in 2018)
(a)2000 BT 18 Aug, (b)2000 BT 19 Aug -
[1] 陈联寿, 徐祥德, 罗哲贤, 等.热带气旋动力学引论.北京:气象出版社, 2002. [2] Wang B, Wei M, Hua W, et al.Characteristics and possible formation mechanisms of severe storms in the outer rainbands of Typhoon Mujigae(1522).J Meteor Res, 2016, 31:612-624. http://www.wanfangdata.com.cn/details/detail.do?_type=perio&id=qxxb-e201703014 [3] 王淑静, 黎明, 陈高峰.解释台风暴雨落区判断的探讨.应用气象学报, 1997, 8(2):167-174. http://qikan.camscma.cn/jamsweb/article/id/19970223 [4] 陶诗言.中国之暴雨.北京:科学出版社, 1980. [5] Chen L, Li Y, Cheng Z.An overview of research and forecasting on rainfall associated with landfalling tropical cyclones.Adv Atmos Sci, 1980, 27(5):967-976. http://www.wanfangdata.com.cn/details/detail.do?_type=perio&id=dqkxjz-e201005001 [6] 江漫, 漆梁波.1959-2012年我国极端降水台风的气候特征分析.气象, 2016, 42(10):1230-1236. http://d.old.wanfangdata.com.cn/Periodical/qx201610008 [7] Chang C, Lei Y, Sui C, et al.Tropical cyclone and extreme rainfall trends in East Asian summer monsoon since Mid-20th Century.Geophys Res Lett, 2010, DOI: 10.1029/2012GL052945. [8] 任福民, 邱文玉, 吴立广, 等.我国东南沿海台风极端降水特征及成因初探.第30届中国气象学会年会, 2013. http://d.old.wanfangdata.com.cn/Conference/8188367 [9] 胡坚, 费亮.台风异常北上时期的天气和次天气尺度环境场特征.应用气象学报, 1990, 1(2):199-204. http://qikan.camscma.cn/jamsweb/article/id/19900228 [10] 程正泉, 陈联寿, 李英.应用气象学报, 2013, 24(3):257-267. http://qikan.camscma.cn/jamsweb/article/id/20130301 [11] 陈艳, 宿海良, 寿绍文, 等.麦莎台风造成冀东大暴雨的数值模拟和诊断分析.应用气象学报, 2008, 19(2):209-218. http://qikan.camscma.cn/jamsweb/article/id/20080237 [12] Li Y, Chen L.Numerical study on impact of the boundary layer fluxes over wetland on sustention and rainfall of landfalling tropical cyclones.Acta Meteor Sinica, 2007, 21(1):34-46. http://www.wanfangdata.com.cn/details/detail.do?_type=perio&id=qxxb-e200701004 [13] 叶成志, 李昀英.热带气旋"碧利斯"与南海季风相互作用的强水汽特征数值研究.气象学报, 2011, 69(3):496-507. http://www.cnki.com.cn/Article/CJFDTotal-QXXB201103010.htm [14] 林文, 林长城, 李白良, 等.登陆台风麦德姆不同部位降水强度及谱特征.应用气象学报, 2016, 27(2):239-248. doi: 10.11898/1001-7313.20160212 [15] 杨舒楠, 陈涛, 刘建勇.两次台风暴雨冷空气影响对比分析.气象科技, 2018, 46(2):324-335. http://d.old.wanfangdata.com.cn/Periodical/qxkj201802017 [16] 刘建勇, 冠博, 顾思楠, 等.台风菲特暴雨诊断分析.气象科技, 2014, 42(6):1047-1056. http://d.old.wanfangdata.com.cn/Periodical/qxkj201406018 [17] 徐文慧, 倪允琪.登陆台风环流内的一次中尺度对流过程.应用气象学报, 2009, 20(3):267-275. http://qikan.camscma.cn/jamsweb/article/id/20090302 [18] 钮学新, 董加斌, 杜惠良.华东地区台风降水及影响降水因素的气候分析.应用气象学报, 2005, 16(3):402-407. http://qikan.camscma.cn/jamsweb/article/id/20050349 [19] 曹爱琴, 程华, 王东勇, 等.基于TRMM卫星资料的"麦莎"台风降水特征分析.中国农学通报, 2016, 32(26):143-156. http://www.wanfangdata.com.cn/details/detail.do?_type=perio&id=zgnxtb201626026 [20] 朱龙彪, 郑铮, 何彩芬.0414号台风"云娜"多普勒雷达探测.应用气象学报, 2005, 16(4):500-508. http://qikan.camscma.cn/jamsweb/article/id/20050463 [21] 屈右铭, 蔡荣辉, 朱立娟.云分析系统在台风莫拉菲数值模拟中的应用.应用气象学报, 2012, 23(5):551-561. http://qikan.camscma.cn/jamsweb/article/id/20120505 [22] 孙军, 张福青.中国日极端降水和趋势.中国科学(地球科学), 2017, 47(12):1469-1482. http://www.wanfangdata.com.cn/details/detail.do?_type=perio&id=zgkx-cd201712009 [23] Hart R, Grumm R.Using normalized climatological anomalies to rank synoptic-scale events objectively.Mon Wea Rev, 2001, 129:2426-2442. http://cn.bing.com/academic/profile?id=b6925b3fd5766b238c207b2e36cacf41&encoded=0&v=paper_preview&mkt=zh-cn [24] Junker N, Grumm R, Hart R, et al.Use of normalized anomaly fields to anticipate extreme rainfall in the mountains of Northern California.Wea Forecasting, 2008, 23:336-356. http://www.wanfangdata.com.cn/details/detail.do?_type=perio&id=bbed793fe5663e5ee3603fa088b559a4 [25] 孙军, 谌芸, 杨舒楠, 等.北京721特大暴雨极端性分析及思考(二)极端性降水成因初探及思考.气象, 2012, 38(10):1267-1277. doi: 10.7519/j.issn.1000-0526.2012.10.013 -

 下载:
下载:
计量
- 摘要浏览量: 3782
- HTML全文浏览量: 652
- PDF下载量: 148
- 被引次数: 0
