Multi-model Consensus Forecasting Technology with Optimal Weight for Precipitation Intensity Levels
-
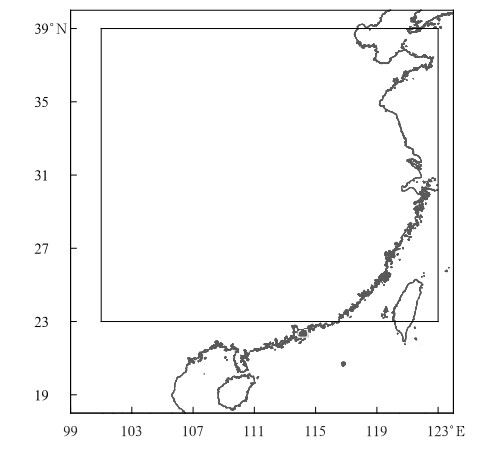
摘要: 为综合不同模式对不同量级降水的预报优势,设计一种全球模式与区域模式结合的降水分级最优化权重集成预报算法,集成经最优TS评分订正法(optimal threat score,OTS)订正后的欧洲中期天气预报中心降水预报产品(以下简称EC-OTS)和华东区域中尺度模式降水预报产品(以下简称SMS-OTS)。以泛长江区域(23°~39°N,101°~123°E)为研究范围,基于2018年不同降水量级的TS评分最优化确定SMS-OTS和EC-OTS在不同降水量级时的最优权重系数以及最优集成方案,并以2019年降水数据为独立样本进行预报试验。结果表明:对于最优权重系数,EC-OTS在低降水量级权重较大,随着降水量级的加大,SMS-OTS的权重也逐渐加大;最优集成方案为初始集成降水量预报取SMS-OTS,集成运算迭代3次;集成预报在几乎所有预报时效、所有降水量级的TS评分均高于EC-OTS和SMS-OTS,其平均绝对误差略小于EC-OTS,显著小于SMS-OTS;集成预报12 h累积降水预报的TS评分较省级预报员主观预报高-0.009~0.041,24 h累积降水预报的TS评分较国家气象中心预报员主观预报高0.009~0.023。Abstract: In the daily weather forecasting business, different model outputs are available for forecasters, but it's difficult to quickly and accurately make quantitative precipitation forecasts based on subjective analysis. Therefore, statistical post-processing techniques are required to scientifically and rationally integrate the multi-model forecast results, so as to obtain a forecast result that take advantages of each model, and the multi-model consensus forecasting technology is introduced. In the past, the research of multi-model consensus precipitation forecast is either based on global model or regional model, but they are rarely integrated. In addition, for a certain forecast, weights are constant, rarely considering variation of forecast ability among different models and precipitation intensity levels. It is found that the unrevised global and regional model present different advantages in forecasting precipitation of different intensities. Multi-model consensus forecasting for precipitation based on both global and regional models, integrating respective advantages of models at different precipitation levels would produce better objective forecasts.To synthesize both forecasting advantages in global and regional models, a consensus forecasting technology combining global and regional models with optimized weights for different precipitation intensity levels is designed. The consensus forecast combined revised ECMWF-IFS's(European Center for Medium-Range Weather Forecasts-Integrated Forecast System) and SMS-WARMS's(Shanghai Meteorological Service WRF ADAS Real-Time Modeling System) precipitation forecasts, which are revised by optimal threat score method(abbreviated as EC-OTS and SMS-OTS) in the Pan-Yangtze River region(23°-39°N, 101°-123°E). Take 2018 as the model training period of consensus weight and 2019 as the independent sample forecast test period. Comparing the consensus forecast with EC-OTS, SMS-OTS and subjective forecast of forecasters, results show that EC-OTS has a greater weight at low precipitation levels, with the increase of precipitation level, the weight of SMS-OTS gradually increases. The average absolute error of the consensus forecast is slightly smaller than EC-OTS and significantly smaller than SMS-OTS with all lead times. The consensus forecast has higher threat scores than EC-OTS and SMS-OTS with almost all lead times at all precipitation levels. The threat score of the 12 h accumulated precipitation of the consensus forecast is -0.009 to 0.041 higher than the subjective forecast of local forecasters, and the threat score of 24 h accumulated precipitation forecast is 0.009 to 0.023 higher than the subjective forecast of China National Meteorological Center forecasters.
-
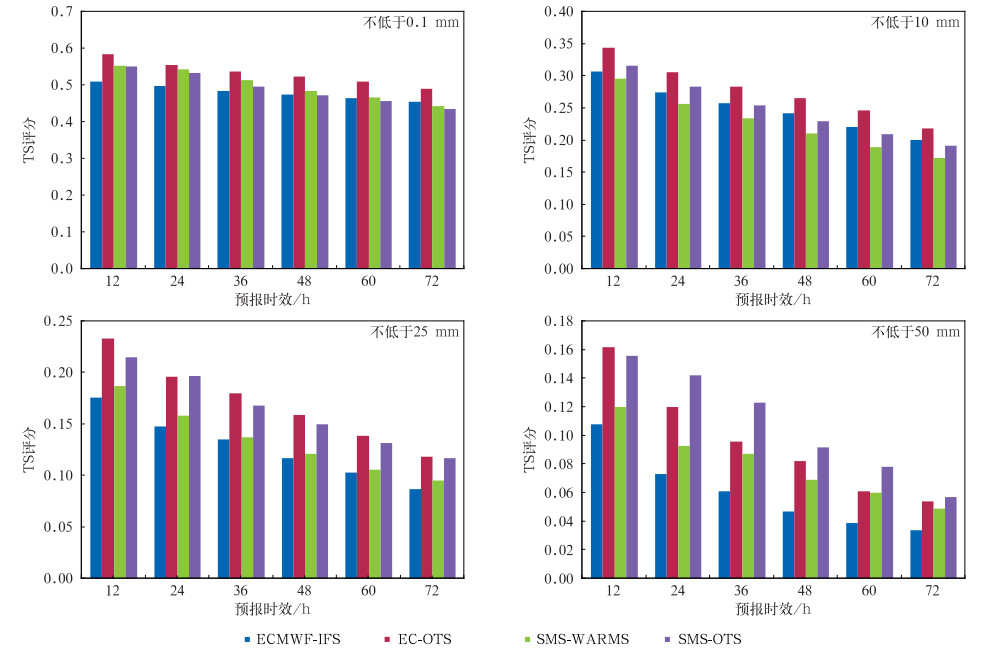
图 2 2018年ECMWF-IFS,EC-OTS,SMS-WARMS和SMS-OTS的12 h累积降水预报在不低于0.1 mm、不低于10 mm、不低于25 mm和不低于50 mm降水量级的TS评分
Fig. 2 Threat score of 12 h accumulated precipitation forecasted by ECMWF-IFS, EC-OTS, SMS-WARMS and SMS-OTS with ranges of no less than 0.1 mm, no less than 10 mm, no less than 25 mm and no less than 50 mm in 2018
图 3 2018年EC-OTS,SMS-OTS和集成预报的12 h累积降水预报在24 h预报时效的TS评分、空报率、漏报率及12~72 h预报时效的平均绝对误差
Fig. 3 Threat score, false alarm ratio, missing ratio of 12 h accumulated precipitation from EC-OTS, SMS-OTS and consensus forecast with lead time of 24 h and mean absolute error of 12 h accumulative precipitation with lead time from 12 h to 72 h in 2018
图 4 2019年EC-OTS,SMS-OTS和集成预报的12 h累积降水预报在24 h预报时效的TS评分、空报率、漏报率和12~72 h预报时效的平均绝对误差
Fig. 4 Threat score, false alarm ratio, miss ratio of 12 h accumulated precipitation from EC-OTS, SMS-OTS and consensus forecast with lead time of 24 h and mean absolute error of 12 h accumulated precipitation with lead time from 12 h to 72 h in 2019
图 6 2019年6月21日20:00起报的SMS-OTS,EC-OTS和集成预报36 h预报时效的24 h累积降水预报以及2019年6月22日08:00—23日08:00降水实况分布
Fig. 6 Twenty-four-hour accumulated precipitation forecasted by SMS-OTS, EC-OTS and consensus forecast initiated at 2000 BT 21 Jun 2019 with lead time of 36 h and observed precipition from 0800 BT 22 Jun to 0800 BT 23 Jun in 2019
表 1 SMS-OTS在不同预报时效、不同降水量级的最优权重系数(EC-OTS的权重系数为1减去SMS-OTS的权重系数)
Table 1 Optimal weight coefficients of SMS-OTS with different lead times and precipitation levels (the weight coefficient of EC-OTS is 1 minus the weight coefficient of SMS-OTS)
降水量级 预报时效/h 12 24 36 48 60 72 不低于0.1 mm 0.03 0.03 0.02 0.02 0.01 0.02 不低于1 mm 0.10 0.10 0.06 0.06 0.06 0.07 不低于5 mm 0.38 0.34 0.26 0.24 0.27 0.31 不低于10 mm 0.30 0.40 0.34 0.32 0.32 0.37 不低于25 mm 0.35 0.53 0.31 0.40 0.39 0.45 不低于35 mm 0.40 0.47 0.51 0.47 0.45 0.40 不低于50 mm 0.43 0.58 0.67 0.72 0.63 0.91 不低于75 mm 0.56 0.88 0.97 0.80 0.90 0.55 不低于100 mm 0.65 0.91 0.81 0.80 1.00 0.78 表 2 10种集成方案的参数设置
Table 2 Parameters of ten integrated schemes
集成方案 初始集成降水量预报Y0生成方法 迭代次数 备注 1 方法1 1 2 方法1 2 3 方法1 3 4 方法2 1 5 方法2 2 6 方法2 3 7 方法3 1 8 方法3 2 9 方法3 3 10 等权重集成 表 3 2018年不同集成方案12 h累积降水预报在不同预报时效的一般性降水TS评分
Table 3 Ordinary rainfall threat score of 12 h accumulated precipitation forecasted by different integration schemes with different lead times in 2018
集成方案 预报时效/h 12 24 36 48 60 72 1 0.589 0.564 0.546 0.529 0.515 0.497 2 0.588 0.563 0.545 0.529 0.514 0.497 3 0.588 0.564 0.546 0.529 0.515 0.497 4 0.588 0.562 0.542 0.525 0.509 0.489 5 0.588 0.563 0.545 0.528 0.513 0.495 6 0.588 0.563 0.545 0.528 0.514 0.495 7 0.588 0.564 0.544 0.527 0.511 0.492 8 0.588 0.563 0.545 0.529 0.514 0.496 9 0.588 0.564 0.546 0.529 0.514 0.497 10 0.574 0.540 0.506 0.486 0.475 0.456 表 4 2018年不同集成方案12 h累积降水预报在不同预报时效暴雨及以上量级降水TS评分
Table 4 Rainstorm threat score of 12 h accumulated precipitation forecasted by different integration schemes with different lead times in 2018
集成方案 预报时效/h 12 24 36 48 60 72 1 0.184 0.143 0.117 0.082 0.063 0.045 2 0.189 0.150 0.128 0.090 0.066 0.048 3 0.188 0.151 0.126 0.084 0.066 0.047 4 0.186 0.153 0.134 0.099 0.076 0.064 5 0.190 0.156 0.135 0.097 0.081 0.058 6 0.190 0.155 0.136 0.099 0.080 0.064 7 0.190 0.151 0.127 0.088 0.071 0.051 8 0.190 0.151 0.131 0.091 0.071 0.056 9 0.190 0.151 0.126 0.088 0.071 0.051 10 0.189 0.151 0.130 0.091 0.071 0.056 表 5 2019年泛长江区域预报员逐12 h精细化天气预报报文与集成预报的12 h累积降水预报的TS评分对比
Table 5 Comparison of threat score of 12 h accumulated precipitation in the Pan-Yangtze River region between local forecaster and consensus forecast in 2019
降水量级 预报方法 预报时效/h 12 24 36 48 60 不低于0.1 mm 主观预报 0.543 0.522 0.502 0.489 0.472 集成预报 0.550 0.536 0.519 0.507 0.494 不低于10 mm 主观预报 0.310 0.292 0.272 0.256 0.236 集成预报 0.345 0.323 0.302 0.283 0.261 不低于25 mm 主观预报 0.218 0.195 0.176 0.155 0.135 集成预报 0.259 0.231 0.206 0.193 0.159 不低于50 mm 主观预报 0.133 0.114 0.096 0.078 0.064 集成预报 0.165 0.144 0.118 0.096 0.075 不低于100 mm 主观预报 0.079 0.074 0.047 0.016 0.010 集成预报 0.089 0.065 0.055 0.049 0.030 表 6 2019年泛长江区域国家气象中心预报员逐24 h累积定量降水预报与集成预报的24 h累积降水预报的TS评分对比
Table 6 Comparison of threat score of 24 h accumulated precipitation in the Pan-Yangtze River region between China National Meteorological Center forecaster and consensus forecast in 2019
降水量级 预报方法 预报时效/h 24 48 不低于0.1 mm 主观预报 0.608 0.580 集成预报 0.620 0.592 不低于10 mm 主观预报 0.405 0.374 集成预报 0.421 0.383 不低于25 mm 主观预报 0.311 0.277 集成预报 0.332 0.286 不低于50 mm 主观预报 0.226 0.182 集成预报 0.243 0.198 不低于100 mm 主观预报 0.142 0.092 集成预报 0.157 0.115 -
[1] 毕宝贵, 代刊, 王毅, 等.定量降水预报技术进展.应用气象学报, 2016, 27(5):534-549. doi: 10.11898/1001-7313.20160503 [2] 李婧华, 田晓阳, 贾朋群.国外气象业务中心核心预报能力的比较和发展.气象科技进展, 2019, 9(1):8-15. http://www.wanfangdata.com.cn/details/detail.do?_type=perio&id=qxkjjz201901006 [3] 王雨, 公颖, 陈法敬, 等.区域业务模式6 h降水预报检验方案比较.应用气象学报, 2013, 24(2):171-178. http://qikan.camscma.cn/article/id/20130205 [4] 杨学胜.业务集合预报系统的现状及展望.气象, 2001, 27(6):3-9. http://www.wanfangdata.com.cn/details/detail.do?_type=perio&id=qx200106001 [5] 刘长征, 杜良敏, 柯宗建, 等.国家气候中心多模式解释应用集成预测.应用气象学报, 2013, 24(6):677-685. http://qikan.camscma.cn/article/id/20130604 [6] 代刊, 朱跃建, 毕宝贵.集合模式定量降水预报的统计后处理技术研究综述.气象学报, 2018, 76(4):493-510. http://www.wanfangdata.com.cn/details/detail.do?_type=perio&id=qxxb201804001 [7] 李芳.基于多模式集合方案的中国东部夏季降水概率季度预测.气象学报, 2012, 70(2):183-191. http://www.wanfangdata.com.cn/details/detail.do?_type=perio&id=qxxb201202003 [8] Kharin V V, Zwiers F W.Climate predictions with multi-model ensembles.J Climate, 2002, 15:793-799. doi: 10.1175/1520-0442(2002)015<0793:CPWME>2.0.CO;2 [9] Kang I S, Yoo J H.Examination of multi-model ensemble seasonal prediction methods using a simple climate system.Clim Dyn, 2006, 26:285-294. doi: 10.1007/s00382-005-0074-8 [10] 林春泽, 智协飞, 韩艳, 等.基于TIGGE资料的地面气温多模式超级集合预报.应用气象学报, 2009, 20(6):706-712. http://qikan.camscma.cn/article/id/20090608 [11] 王亚男, 智协飞.多模式降水集合预报的统计降尺度研究.暴雨灾害, 2012, 31(1):1-7. http://www.wanfangdata.com.cn/details/detail.do?_type=perio&id=hbqx201201001 [12] 林春泽, 祁海霞, 智协飞, 等.中国夏季降水多模式集成概率预报研究.暴雨灾害, 2013, 32(4):354-359. http://www.wanfangdata.com.cn/details/detail.do?_type=perio&id=hbqx201304008 [13] 王海霞, 智协飞.基于TIGGE多模式降水量预报的统计降尺度研究.气象科学, 2015, 35(4):430-437. http://www.wanfangdata.com.cn/details/detail.do?_type=perio&id=qxkx201504007 [14] 金龙, 陈宁, 林振山.基于人工神经网络的集成预报方法研究和比较.气象学报, 1999, 57(2):198-207. http://www.wanfangdata.com.cn/details/detail.do?_type=perio&id=QK199900533784 [15] 周兵, 赵翠光, 赵声蓉.多模式集合预报技术及其分析与检验.应用气象学报, 2006, 17(1):104-109. http://www.wanfangdata.com.cn/details/detail.do?_type=perio&id=yyqxxb2006z1015 [16] 赵声蓉.多模式温度集成预报.应用气象学报, 2006, 17(1):52-58. http://qikan.camscma.cn/article/id/20060109 [17] 智协飞, 林春泽, 白永清, 等.北半球中纬度地区地面气温的超级集合预报.气象科学, 2009, 29(5):569-574. http://www.wanfangdata.com.cn/details/detail.do?_type=perio&id=qxkx200905001 [18] 陈超辉, 李崇银, 谭言科, 等.基于交叉验证的多模式超级集合预报方法研究.气象学报, 2010, 68(4):464-476. http://www.wanfangdata.com.cn/details/detail.do?_type=perio&id=qxxb201004003 [19] 智协飞, 季晓东, 张璟, 等.基于TIGGE资料的地面气温和降水的多模式集成预报.大气科学学报, 2013, 36(3):257-266. http://www.wanfangdata.com.cn/details/detail.do?_type=perio&id=njqxxyxb201303001 [20] 吴振玲, 潘璇, 董昊, 等.天津市多模式气温集成预报方法.应用气象学报, 2014, 25(3):293-301. http://qikan.camscma.cn/article/id/20140305 [21] 熊敏诠.基于集合预报系统的日最高和最低气温预报.气象学报, 2017, 75(2):211-222. http://www.wanfangdata.com.cn/details/detail.do?_type=perio&id=qxxb201702002 [22] 智协飞, 黄闻.基于卡尔曼滤波的中国区域气温和降水的多模式集成预报.大气科学学报, 2019, 42(2):197-206. http://www.wanfangdata.com.cn/details/detail.do?_type=perio&id=njqxxyxb201902004 [23] Coelho C A S, Pezzulli S, Balmaseda M, et al.Forecast calibration and combination:A simple bayesian approach for ENSO.J Climate, 2004, 17:1504-1516. doi: 10.1175/1520-0442(2004)017<1504:FCACAS>2.0.CO;2 [24] Li F, Zeng Q C, Li C F.A Bayesian scheme for probabilistic multi-model ensemble prediction of summer rainfall over the Yangtze River Valley.Atmos Oceanic Sci Lett, 2009, 2(5):314-319. doi: 10.1080/16742834.2009.11446815 [25] 吴启树, 韩美, 刘铭, 等.基于评分最优化的模式降水预报订正算法对比.应用气象学报, 2017, 28(3):306-317. doi: 10.11898/1001-7313.20170305 [26] 王晓峰, 许晓林, 徐同, 等.华东区域数值预报系统对极端降水预报能力的评估.气象科技进展, 2017, 7(6):67-74. http://www.wanfangdata.com.cn/details/detail.do?_type=perio&id=qxkjjz201706017 [27] 徐同, 杨玉华, 李佳, 等.SMS-WARMS V2.0模式对中国西南地区降水预报能力的客观检验.气象, 2019, 45(8):1065-1074. http://www.wanfangdata.com.cn/details/detail.do?_type=perio&id=qx201908003 [28] 吴启树, 韩美, 郭弘, 等.MOS温度预报中最优训练期方案.应用气象学报, 2016, 27(4):426-434. doi: 10.11898/1001-7313.20160405 -


 设为首页
设为首页 加入收藏
加入收藏


 下载:
下载:


