
 设为首页
设为首页 加入收藏
加入收藏

Chemical Characteristics of PM10 at Background Stations of Central and Eastern China in 2016-2017
-
摘要: 对中国中东部3个区域大气本底观测站2015年12月—2017年12月PM10质量浓度及其化学成分空间分布与季节变化特征进行研究,结果显示:研究期间龙凤山站、临安站和金沙站平均PM10质量浓度分别为57.5,62.2 μg·m-3和57.6 μg·m-3。其中临安站和金沙站2017年PM10质量浓度较2016年有所下降,但龙凤山站有所上升。与2013年相比,临安站和金沙站平均PM10质量浓度分别降低29.3%和26.2%。临安站SO42-,NO3-和NH4+平均质量浓度分别为9.9,8.2 μg·m-3和3.7 μg·m-3,金沙站分别为10.2,6.7 μg·m-3和2.6 μg·m-3,均高于龙凤山站的5.9,4.9 μg·m-3和2.1 μg·m-3,其中龙凤山站和临安站的NO3-与SO42-质量浓度比值较高(0.9和0.8),金沙站较低(0.6)。龙凤山站的有机碳(OC)和元素碳(EC)质量浓度分别为10.1 μg·m-3和2.7 μg·m-3,临安站为6.7 μg·m-3和3.1 μg·m-3,金沙站为4.7 μg·m-3和2.3 μg·m-3,即龙凤山站OC最高,金沙站最低,3个站点的EC基本相当,临安站略高。与2013年相比,研究期间临安站SO42-,NH4+和OC分别下降38.1%,26.0%和55.6%,金沙站分别下降46.3%,51.9%和44.7%,但临安站和金沙站的NO3-分别上升12.3%和15.5%;临安站EC下降27.9%,金沙站EC上升4.5%。3个站点夏季PM10,NO3-,EC质量浓度及NO3-与SO42-质量浓度比值均最低。Abstract: The characteristics of PM10 and its chemical composition from December 2015 to December 2017 are studied at three regional atmospheric background stations (Longfengshan, Lin'an, and Jinsha) in central and eastern China. The water-soluble ions (F-, Cl-, NO3-, SO42-, PO43-, Na+, K+, NH4+, Ca2+, Mg2+), carbon-containing compounds (OC, EC) and main elements in PM10 samples are analyzed. The average PM10 concentration at Lin'an (62.2±36.6 μg·m-3) during the whole period is the highest, followed by Jinsha (57.6±31.8 μg·m-3), and that at Longfengshan (57.5±55.3 μg·m-3) is the lowest. At those stations, the annual PM10 mass concentrations are lower than the national second-level air quality standard. The concentrations of PM10 in 2016-2017 show a downward trend, with the reductions of concentrations about 29.3% at Lin'an and 26.2% at Jinsha compared with the results during the year of 2013.The concentrations of SO42-, NO3-, and NH4+ during the whole period are 9.9, 8.2 μg·m-3 and 3.7 μg·m-3 at Lin'an, and 10.2, 6.7 μg·m-3 and 2.6 μg·m-3 at Jinsha, respectively, which are all higher than those at Longfengshan, with the average concentrations of 5.9 μg·m-3 for SO42-, 4.9 μg·m-3 for NO3-, and 2.1 μg·m-3 for NH4+. However, the ratio of NO3-/SO42- at Longfengshan and Lin'an are relatively higher. The concentrations of OC and EC during the whole period are 10.1 μg·m-3 and 2.7 μg·m-3 at Longfengshan, 6.1 μg·m-3 and 3.1 μg·m-3 at Lin'an, and 4.7 μg·m-3 and 2.3 μg·m-3 at Jinsha. Compared to the year of 2013, the concentrations of SO42-, NH4+ and OC during the whole period decrease by 38.1%, 26.0%, and 55.6% at Lin'an, respectively, and decrease by 46.3%, 51.9%, and 44.7% at Jinsha, while the concentrations of NO3- increase by 12.3% and 15.5% at Lin'an and Jinsha, respectively. The concentrations of EC decreases by 27.9% at Lin'an, but increases by 4.5% at Jinsha. The ratio of NO3-/SO42- increase obviously at all the stations, which indicates the increases of nitrate aerosols, due to the continuously control of coal combustion emissions and increase of car ownership.The seasonal concentrations of PM10, NO3-, EC and the ratio of NO3-/SO42- are lowest in summer at three stations. Meanwhile, the mass concentrations of SO42-, NO3- and NH4+ are basically higher in winter than in other seasons.
-
Key words:
- PM10;
- aerosol chemical compositions;
- background station
-
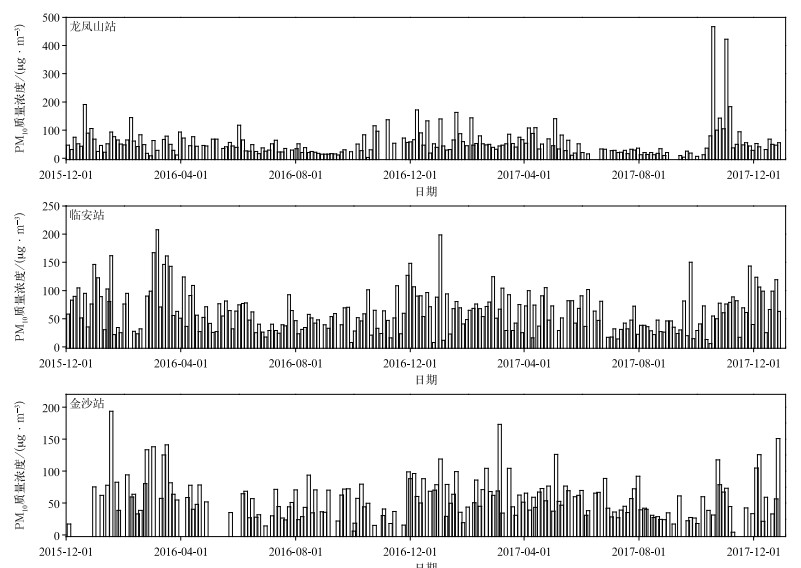
图 2 2015年12月—2017年12月PM10日平均质量浓度时间序列
Fig. 2 The average mass concentration of PM10 from Dec 2015 to Dec 2017

图 3 2015年12月—2017年12月PM10中无机离子浓度逐月变化
Fig. 3 The monthly average ion composition concentration in PM10 from Dec 2015 to Dec 2017
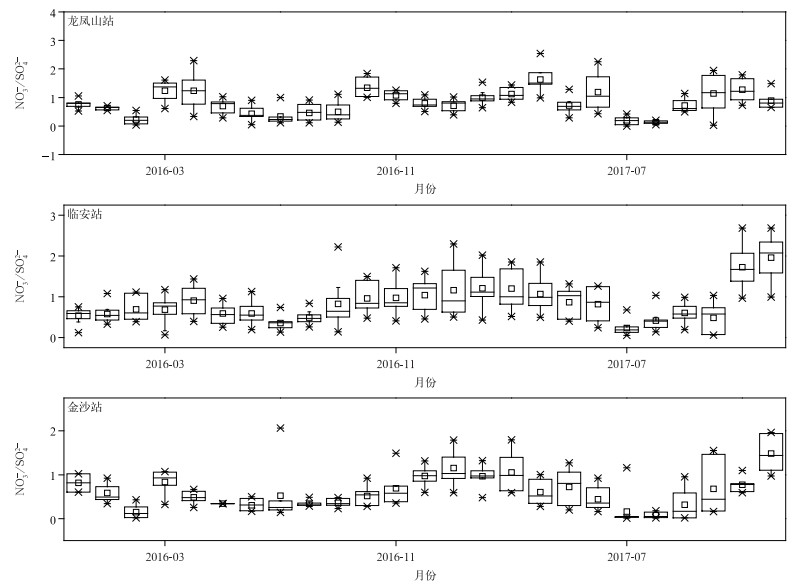
图 4 2015年12月—2017年12月PM10中NO3-/SO42-时间序列
Fig. 4 NO3-/SO42-in PM10 from Dec 2015 to Dec 2017
表 1 龙凤山站、临安站和金沙站PM10年、季节平均质量浓度
Table 1 The annual and seasonal average mass concentration of PM10 at Longfengshan, Lin'an and Jinsha stations
时间 龙凤山站 临安站 金沙站 质量浓度/(μg·m-3) 样本量 质量浓度/(μg·m-3) 样本量 质量浓度/(μg·m-3) 样本量 2016年冬季* 63.1±39.5 26 73.9+39.1 25 74.9±44.9 14 2016年春季* 65.4±40.7 22 80.7±49.2 26 75.1±35.2 14 2016年夏季* 35.0±22.1 25 45.5±19.9 25 44.7±20.9 22 2016年秋季* 54.7±46.9 19 51.8±28.8 25 44.4±26.2 19 2017年冬季* 70.8±43.1 26 76.6±39.9 26 67.7±24.8 24 2017年春季* 58.7±30.6 25 61.8±27.1 24 65.6±31.4 24 2017年夏季* 22.5±7.9 22 42.1±23.1 25 45.4±20.1 24 2017年秋季* 93.6±125.9 21 56.1±36.4 26 44.3±27.6 18 2016年平均* 54.0±38.9 89 63.3±39.0 101 59.1±33.1 75 2017年平均* 59.1±68.4 92 59.4±34.1 100 56.6±30.7 89 研究期间 57.5±55.3 193 62.2±36.6 210 57.6±31.8 166 2013年[19] 88.0 78.0 2006—2007年[17] 81.8 114.2 107.4 *注:年平均值计算为当年1—12月平均,季节平均按照自然季节的月份划分,下同。  下载: 导出CSV
表 2 2015年12月—2017年12月龙凤山站PM10中无机离子成分年平均和季节平均(单位:μg·m-3)
Table 2 The annual and seasonal average ion composition in PM10 at Longfengshan Station from Dec 2015 to Dec 2017 (unit:μg·m-3)
时间 Cl- SO42- NO3- PO43- Na+ NH4+ K+ Mg2+ Ca2+ 2016年冬季 0.3 9.3 5.6 1.3 1.0 3.1 0.9 0.1 0.7 2016年春季 0.8 4.9 5.3 0.6 0.3 1.4 0.4 0.1 0.9 2016年夏季 0.2 4.8 1.3 3.3 0.5 0.5 0.1 0.1 2.0 2016年秋季 0.6 4.3 4.3 2.8 0.2 1.2 0.4 0.1 2.4 2017年冬季 0.3 10.1 8.9 1.4 0.8 4.0 0.7 0.1 1.0 2017年春季 0.7 5.0 5.6 0.4 0.3 1.4 0.5 0.1 0.9 2017年夏季 0.0 2.3 0.6 0.2 0.3 0.3 0.1 0.0 0.6 2017年秋季 3.3 5.4 7.2 0.2 0.4 4.5 2.0 0.1 0.8 2016年平均 0.5 5.8 4.1 2.0 0.5 1.6 0.5 0.08 1.4 2017年平均 1.1 5.3 5.2 0.6 0.4 2.3 0.8 0.07 0.9 研究期间 0.7 5.9 4.9 1.3 0.5 2.1 0.6 0.07 1.1 2006—2007年[17] 0.7 10.0 4.9 2.5
下载: 导出CSV
表 3 2015年12月—2017年12月临安站PM10无机离子成分年平均和季节平均(单位:μg·m-3)
Table 3 The annual and seasonal average ion composition in PM10 at Lin'an Station from Dec 2015 to Dec 2017 (unit:μg·m-3)
时间 Cl- SO42- NO3- PO43- Na+ NH4+ K+ Mg2+ Ca2+ 2016年冬季 0.8 14.8 8.7 0.6 1.2 5.1 0.6 0.1 1.1 2016年春季 0.5 12.7 9.3 1.7 0.7 4.6 0.4 0.2 1.0 2016年夏季 0.5 8.6 4.4 3.2 1.3 2.1 0.2 0.1 1.6 2016年秋季 0.7 9.5 8.1 0.2 0.6 3.0 0.2 0.1 0.4 2017年冬季 0.8 12.3 13.8 0.3 0.5 5.3 0.3 0.1 0.3 2017年春季 0.2 8.2 8.7 0.1 0.5 3.0 0.5 0.1 1.5 2017年夏季 0.1 6.8 3.3 0.4 0.3 1.5 0.3 0.1 1.1 2017年秋季 0.6 6.4 6.5 0.1 0.8 2.3 0.2 0.2 1.5 2016年平均 0.6 11.1 8.0 1.4 0.8 3.7 0.3 0.1 0.8 2017年平均 0.5 8.0 8.3 0.2 0.5 3.5 0.3 0.2 1.3 研究期间 0.6 9.9 8.2 0.8 0.7 3.7 0.3 0.1 1.1 2013年[19] 16.0 7.3 5.0 2006—2007年[17] 1.0 21.7 8.6 6.8
下载: 导出CSV
表 4 2015年12月—2017年12月金沙站PM10无机离子成分年平均和季节平均(单位:μg·m-3)
Table 4 The annual and seasonal average ion composition in PM10 at Jinsha Station from Dec 2015 to Dec 2017 (unit:μg·m-3)
时间 Cl- SO42- NO3- PO43- Na+ NH4+ K+ Mg2+ Ca2+ 2016年冬季 0.3 12.9 4.9 0.1 0.3 3.9 0.9 0.2 0.3 2016年春季 0.3 12.9 9.1 3.0 0.7 4.6 0.7 0.1 2.1 2016年夏季 0.1 9.4 3.6 0.4 0.1 1.9 0.1 0.1 1.3 2016年秋季 0.2 10.0 5.3 6.9 1.8 2.1 0.3 0.1 3.6 2017年冬季 0.2 12.7 13.0 0.5 0.5 4.5 0.4 0.2 1.4 2017年春季 0.3 10.0 7.9 0.1 0.2 1.4 0.3 0.1 1.5 2017年夏季 0.3 7.3 1.8 0.2 0.3 0.8 0.3 0.1 1.3 2017年秋季 0.8 8.4 4.3 0.5 1.0 1.8 0.7 0.1 2.0 2016年平均 0.2 11.3 6.2 2.6 0.7 3.1 0.4 0.1 1.9 2017年平均 0.3 9.3 7.0 0.3 0.4 2.2 0.4 0.1 1.7 研究期间 0.3 10.2 6.7 1.3 0.6 2.6 0.4 0.1 1.8 2013年[19] 19.0 5.8 5.4 2006—2007年[17] 0.6 26.6 7.2 7.6
下载: 导出CSV
表 5 2015年12月—2017年12月OC与EC质量浓度、OC/EC平均值
Table 5 The average of OC mass concentration, EC mass concentration and OC/EC from Dec 2015 to Dec 2017
站点 时段 OC/(μg·m-3) EC/(μg·m-3) OC/EC平均值 龙凤山 2016年冬季 12.0 3.1 3.7 2016年春季 7.6 1.5 6.3 2016年夏季 7.0 1.1 8.4 2016年秋季 10.6 2.3 4.0 2017年冬季 12.6 3.2 5.3 2017年春季 9.2 2.7 3.5 2017年夏季 3.3 1.6 2.1 2017年秋季 20.8 5.9 2.8 2016年平均 9.1 2.1 5.7 2017年平均 10.6 3.2 3.4 研究期间 10.1 2.7 4.5 临安 2016年冬季 9.0 3.1 3.0 2016年春季 7.9 2.9 2.8 2016年夏季 5.7 1.9 9.5 2016年秋季 5.4 2.3 2.3 2017年冬季 9.0 3.0 3.0 2017年春季 6.1 3.9 1.5 2017年夏季 4.3 2.4 2.1 2017年秋季 5.6 3.7 1.5 2016年平均 7.2 2.7 3.8 2017年平均 6.1 3.4 1.9 研究期间 6.7 3.1 3.6 2013年[19] 15.1 4.3 ~3.5 2006—2007年[17] 12.0 2.5 ~4.8 金沙 2016年冬季 7.0 3.3 3.6 2016年春季 5.8 2.1 2.8 2016年夏季 3.9 1.7 3.3 2016年秋季 4.9 2.0 2.4 2017年冬季 6.4 2.4 3.0 2017年春季 3.2 2.1 1.7 2017年夏季 4.1 1.9 2.2 2017年秋季 3.2 2.2 1.8 2016年平均 5.3 2.3 3.0 2017年平均 4.2 2.3 1.9 研究期间 4.7 2.3 2.4 2013年[19] 8.5 2.2 ~3.9 2006—2007年[17] 15.3 3.0 ~5.1
下载: 导出CSV
表 6 PM10中OC和EC斜率k和相关系数R (2015年12月—2017年11月)
Table 6 Slope k and correlation coefficient R of OC and EC in PM10 from Dec 2015 to Nov 2017
时段 龙凤山站 临安站 金沙站 k R k R k R 2016年冬季 3.56 0.90 2.57 0.78 0.35 0.53 2016年春季 4.67 0.74 2.43 0.92 3.28 0.67 2016年夏季 3.89 0.22 0.51 0.25 1.53 0.80 2016年秋季 5.58 0.90 2.91 0.88 2.67 0.75 2017年冬季 2.56 0.88 2.67 0.94 1.64 0.75 2017年春季 3.35 0.65 1.97 0.77 1.00 0.67 2017年夏季 2.16 0.74 0.84 0.43 1.59 0.61 2017年秋季 4.13 0.98 1.68 0.95 1.21 0.82 *注:[OC]=k×[EC]+b, b为截距。
下载: 导出CSV
表 7 2015年12月—2017年12月主要元素质量浓度和富集因子
Table 7 The average mass concentration and enrichment factor of main elements from Dec 2015 to Dec 2017
元素 龙凤山站 临安站 金沙站 平均质量浓度/(μg·m-3) 富集因子 平均质量浓度/(μg·m-3) 富集因子 平均质量浓度/(μg·m-3) 富集因子 As 0.01 1364.05 0.01 508.28 0.01 1247.22 Se 0.01 59804.33 0.01 42485.78 0.01 75625.97 Cr 0.01 21.27 0.01 16.82 0.01 19.00 Sb 0.86 1450911.93 0.81 600178.50 0.95 1284530.96 Zn 0.13 637.56 0.24 517.69 0.18 695.69 Sr 0.06 51.51 0.06 22.80 0.07 47.63 Pb 0.03 723.59 0.05 571.71 0.05 1010.90 Ni 0.00 17.29 0.01 17.33 0.02 64.43 Co 0.01 149.63 0.02 94.44 0.02 244.75 Cd 0.34 571539.73 0.29 215363.69 0.36 491680.50 Mn 0.10 34.02 0.12 18.59 0.11 30.52 Mg 1.18 18.89 1.28 9.09 1.36 17.53 V 0.00 3.74 0.00 3.20 0.00 5.58 Ca 6.75 62.45 7.30 29.86 7.70 57.23 Cu 0.26 1596.15 0.26 703.39 0.18 874.59 Ti 0.07 4.97 0.07 2.45 0.04 2.45 Sc 0.00 61.05 0.01 43.97 0.01 66.56 Al 0.40 1.66 0.69 1.26 0.42 1.38 Na 0.38 4.50 0.33 1.75 0.38 3.66 K 2.06 26.67 1.64 9.43 2.04 21.27 S 1.30 1672.84 2.21 1262.25 1.74 1805.41
下载: 导出CSV
-
[1] Molnár A, Mészáros E, Hansson H C, et al.Importance of organic and elemental carbon in the fine atmospheric aerosol particles.Atmos Environ, 1999, 17(33): 2745-2750. [2] 李德平, 程兴宏, 孙治安, 等.北京不同区域气溶胶辐射效应.应用气象学报, 2018, 29(5): 609-618. doi: 10.11898/1001-7313.20180509Li D P, Cheng X H, Sun Z A, et al.Radiative effects of aerosols in different areas of Beijing.J Appl Meteor Sci, 2018, 29(5): 609-618. doi: 10.11898/1001-7313.20180509 [3] 马肖琳, 高西宁, 刘煜, 等.气溶胶对东亚冬季风影响的数值模拟.应用气象学报, 2018, 29(3): 333-343. doi: 10.11898/1001-7313.20180307Ma X L, Gao X N, Liu Y, et al.Simulations of aerosol influences on the East Asian winter monsoon.J Appl Meteor Sci, 2018, 29(3): 333-343. doi: 10.11898/1001-7313.20180307 [4] 梁苑新, 车慧正, 王宏, 等.北京一次污染过程气溶胶光学特性及辐射效应.应用气象学报, 2020, 31(5): 583-594. doi: 10.11898/1001-7313.20200506Liang Y X, Che H Z, Wang H, et al.Aerosol optical properties and radiative effects during a pollution episode in Beijing.J Appl Meteor Sci, 2020, 31(5): 583-594. doi: 10.11898/1001-7313.20200506 [5] Heintzenberg J.Fine particles in the global troposphere-A review.Tellus, 1989, 41B: 149-160. [6] Xu J, Bergin M H, Yu X, et al.Measurement of aerosol chemical, physical, and radiative properties in the Yangtze delta region of China.Atmos Environ, 2002, 36: 161-173. doi: 10.1016/S1352-2310(01)00455-1 [7] Matta E, Facchini M C, Decesari S, et al.Mass closure on the chemical species in size-segregated atmospheric aerosol collected in an urban area of the Po Valley, Italy.Atmos Chem Phys, 2003, 3(3): 623-637. doi: 10.5194/acp-3-623-2003 [8] Fridlind A M, Jacobson M Z.A study of gas-aerosol equilibrium and aerosol pH in the remote marine boundary layer during the First Aerosol Characterization Experiment (ACE 1).J Geophys Res Atmos, 2000, 105(D13): 17325-17340. doi: 10.1029/2000JD900209 [9] Svenningsson B, Hansson H C, Wiedensohler A, et al.Hygroscopic growth of aerosol particles and its influence on nucleation scavenging in cloud:Experimental results from Kleiner Feldberg.J Atmos Chem, 1994, 19(1): 129-152. [10] Tao J, Ho K F, Chen L G, et al.Effect of chemical composition of PM2.5 on visibility in Guangzhou, China, 2007 spring.Particuology, 2009, 7(1): 68-75. doi: 10.1016/j.partic.2008.11.002 [11] Offenberg J H, Baker J E.Aerosol size distributions of elemental organic carbon in urban and over-water atmosphere.Atmos Environ, 2000, 34(10): 1509-1517. doi: 10.1016/S1352-2310(99)00412-4 [12] Zheng B, Tong D, Li M, et al.Trends in China's anthropogenic emissions since 2010 as the consequence of clean air actions.Atmos Chem Phys, 2018, 18(19): 14095-14111. doi: 10.5194/acp-18-14095-2018 [13] Zhao S P, Yin D Y, Yu Y, et al.PM2.5 and O3 pollution during 2015-2019 over 367 Chinese cities:Spatiotemporal variations, meteorological and topographical impacts.Environ Pollut, 2020, 264: 114694. doi: 10.1016/j.envpol.2020.114694 [14] Wang Y S, Li W J, Gao W K, et al.Trends in particulate matter and its chemical compositions in China from 2013-2017.Sci China Earth Sci, 2019, 62: 1857-1871. doi: 10.1007/s11430-018-9373-1 [15] Zhang Y M, Vu V T, Sun J Y, et al.Significant changes in chemistry of fine particles in wintertime Beijing from 2007 to 2017:Impact of clean air actions.Environ Sci Technol, 2019, 54: 1344-1352. [16] 张养梅, 颜鹏, 杨东贞, 等.临安大气气溶胶理化特性季节变化.应用气象学报, 2007, 18(5): 635-644. doi: 10.3969/j.issn.1001-7313.2007.05.008Zhang Y M, Yan P, Yang D Z, et al.Seasonal physical and chemical features variation of ambient aerosol in Lin'an.J Appl Meteor Sci, 2007, 18(5): 635-644. doi: 10.3969/j.issn.1001-7313.2007.05.008 [17] Zhang X Y, Wang Y Q, Niu T, et al.Atmospheric aerosol compositions in China:Spatial/Temporal variability, chemical signature, regional haze distribution and comparisons with global aerosols.Atmos Chem Phys, 2012, 12(2): 779-799. doi: 10.5194/acp-12-779-2012 [18] 栾天, 郭学良, 张天航, 等.不同降水强度对PM2.5的清除作用及影响因素.应用气象学报, 2019, 30(3): 279-291. doi: 10.11898/1001-7313.20190303Luan T, Guo X L, Zhang T H, et al.The scavenging process and physical removing mechanism of pollutant aerosols by different precipitation intensities.J Appl Meteor Sci, 2019, 30(3): 279-291. doi: 10.11898/1001-7313.20190303 [19] Zhang X Y, Wang J Z, Wang Y Q, et al.Changes in chemical components of aerosol particles in different haze regions in China from 2006 to 2013 and contribution of meteorological factors.Atmos Chem Phys, 2015, 15(22): 12935-12952. doi: 10.5194/acp-15-12935-2015 [20] Wang Y H, Gao W, Wang S, et al.Contrasting trends of PM2.5 and surface-ozone concentrations in China from 2013 to 2017.National Science Review, 2020, 7(8): 1331-1339. doi: 10.1093/nsr/nwaa032 [21] 柯华兵, 龚山陵, 何建军, 等.露天生物质燃烧对地面PM2.5浓度的影响评估.应用气象学报, 2020, 31(1): 105-116. doi: 10.11898/1001-7313.20200110Ke H B, Gong S L, He J J, et al.Assessment of open biomass burning impacts on surface PM2.5 concentration.J Appl Meteor Sci, 2020, 31(1): 105-116. doi: 10.11898/1001-7313.20200110 [22] 张方健, 徐敬, 马建中, 等.京津冀周边秸秆燃烧对PM2.5无机组分影响.应用气象学报, 2019, 30(4): 467-478. doi: 10.11898/1001-7313.20190407Zhang F J, Xu J, Ma J Z, et al.Impact of crop residue burning on PM2.5 inorganic components in Beijing-Tianjin-Hebei and surrounding areas.J Appl Meteor Sci, 2019, 30(4): 467-478. doi: 10.11898/1001-7313.20190407 [23] Yan P, Zhang R J, Huan N, et al.Characteristics of aerosols and mass closure study at two WMO GAW regional background stations in eastern China.Atmos Environ, 2012, 60: 121-131. doi: 10.1016/j.atmosenv.2012.05.050 [24] 颜鹏, 毛节泰, 杨东贞, 等.临安一次沙尘暴过程影响气溶胶物理化学特性演变的初步分析.第四季研究, 2004, 24(4): 437-446.Yan P, Mao J T, Yang D Z, et al.The characterization of aerosol physical and chemical properties at Lin'an station during the transport of a sandstorm.Quaternary Sciences, 2004, 24(4): 437-446. [25] 张大伟, 王小菊, 刘保献, 等.北京城区大气PM2.5主要化学组分及污染特征.环境科学研究, 2015, 28(8): 1186-1192.Zhang D W, Wang X J, Liu B X, et al.Characteristics of PM2.5 and its chemical composition in the urban area of Beijing.Research of Environmental Sciences, 2015, 28(8): 1186-1192. [26] 杨素霞, 曹军骥, 沈振兴, 等.西安冬, 夏季PM2.5中水溶性无机离子的变化特征.环境化学, 2012, 31(8): 1179-1188.Yang S X, Cao J J, Shen Z X, et al.Variations of water-soluble ions in PM2.5 at Xi'an between summer and winter.Environmental Chemistry, 2012, 31(8): 1179-1188. [27] 张华, 安琪, 赵树云, 等.关于硝酸盐气溶胶光学特征和辐射强迫的研究进展.气象学报, 2017, 75(4): 539-551.Zhang H, An Q, Zhao S Y, et al.Advances in the research of optical properties and radiative forcing of nitrate aerosols.Acta Meteor Sinica, 2017, 75(4): 539-551. [28] Zhou L, Wang W, Hou S, et al.Heterogeneous uptake of nitrogen dioxide on Chinese mineral dust.J Environ Sci, 2015(36): 110-118. [29] 徐宏辉, 徐婧莎, 何俊, 等.杭甬地区大气中含碳气溶胶特征及来源分析.环境科学, 2018, 39(8): 3511-3517. https://www.cnki.com.cn/Article/CJFDTOTAL-HJKZ201808006.htmXu H H, Xu J S, He J, et al.Characteristics and source analysis of atmospheric carbonaceous aerosols in the cities of Hangzhou and Ningbo.Environmental Science, 2018, 39(8): 3511-3517. https://www.cnki.com.cn/Article/CJFDTOTAL-HJKZ201808006.htm [30] 贾小芳, 颜鹏, 孟昭阳, 等.2016年11-12月北京及周边重污染过程PM2.5特征.应用气象学报, 2019, 30(3): 302-315. doi: 10.11898/1001-7313.20190305Jia X F, Yan P, Meng Z Y, et al.Characteristics of PM2.5 in heavy pollution events in Beijing and surrounding areas from November to December in 2016.J Appl Meteor Sci, 2019, 30(3): 302-315. doi: 10.11898/1001-7313.20190305 [31] 颜鹏, 郇宁, 张养梅, 等.北京乡村地区分粒径气溶胶OC及EC分析.应用气象学报, 2012, 23(3): 285-293. http://yyqxxb.xml-journal.net/article/id/20120304Yan P, Huan N, Zhang Y M, et al.Size resolved aerosol OC, EC at a regional background station in the suburb of Beijing.J Appl Meteor Sci, 2012, 23(3): 285-293. http://yyqxxb.xml-journal.net/article/id/20120304 -

计量
- 摘要浏览量: 1335
- HTML全文浏览量: 267
- PDF下载量: 60
- 被引次数: 0
