Circulation Characteristics and Thermal and Dynamic Conditions 48 Hours Before Typhoon Formation in the South China Sea
-
摘要: 利用1979—2019年4—11月中国气象局上海台风研究所热带气旋最佳路径资料和静止卫星红外云图资料,筛选出189例南海台风,结合欧洲中期天气预报中心1°×1°再分析资料,分析南海台风生成前48 h至生成时刻的天气环流和动力、热力条件。结果表明:南海台风生成于热带洋面大范围的高海表温度、高水汽含量和高不稳定层结区,其生成前的主要环境背景环流是赤道辐合带、西南季风或东风波等;台风生成前扰动中心常常处于其北侧风切变小而南侧风切变大的过渡带中,少数扰动中心倾向于风切变小值中心附近,风切变与扰动的发展之间无显著相关;扰动中心一般与垂直涡度中心重合,垂直涡度中心是表征扰动自身强弱的物理量,但垂直涡度自身的大小与未来扰动发展趋势关系不明显,而Okubo-Weiss(OW)指数则对于扰动的发展以及扰动位置确定有较好的指示意义;在扰动发展过程中,扰动中心附近存在一个贯穿整个对流层的位涡柱,低层扰动部分与位涡柱中的中低层位涡相互作用,有利于扰动发展。Abstract: Based on the tropical cyclone best track data from Shanghai Typhoon Institute of China Meteorological Administration and the geostationary infrared satellite cloud image from April to November during 1979-2019, 189 typhoons formed in the South China Sea are selected as target cases. The circulation characteristics, dynamic and thermal conditions from 48 hours before typhoon formation to the time of typhoon generation are analyzed using the reanalysis data of the European Centre for Medium-Range Weather Forecasts (ECMWF) with 1°×1° grid. The results indicate that the typhoon in the South China Sea is formed in a large range of tropical ocean with high surface temperature, high water vapor content and unstable stratification. The development of deep convection and its distance to the tropical disturbance center can be used as an observation criterion for whether the tropical disturbance can develop into typhoon in the next 48 hours. Intertropical convergence is the dominant background circulation of typhoon formation in the South China Sea, and south-west monsoon or easterly wave are also main large-scale circulation. The center of typhoon disturbance is often in the transition zone of the vertical shear, where the vertical shear of the north side of the disturbance becomes smaller and the vertical shear of the south side becomes larger. Sometimes the disturbance center is slightly inclined to the weak vertical shear center. As a whole, there is no significant correlation between wind vertical shear and typhoon disturbance development. The center of tropical disturbance generally coincides with the center of vertical vorticity, and the center of vertical vorticity could be considered as a physical quantity representing the strength of disturbance itself. Furthermore, it is difficult to define the development of the vertical vorticity as an indicator to characterize the development trend of disturbance, while the Okubo-Weiss (OW) index is a good indicator for the development of disturbance and the determination of the disturbance location. In the process of typhoon disturbance development, there is a potential vortex column running through the whole troposphere near the disturbance center. Within the potential vortex column near the disturbance center, the interaction between lower disturbance and the potential vortex in middle and low layer is beneficial to the development of typhoon disturbance.
-
图 2 南海台风米克拉(0220)生成前48 h的2002年9月23日08:00(北京时,下同)静止卫星GMS红外云图(a)和南海台风灿都(0405)生成前的48 h 2004年6月9日02:00静止卫星GOE红外云图(b)
(为扰动中心位置,直径1.5个纬度圆为距离扰动中心最近的广阔深对流)
Fig. 2 The infrared cloud image of geostationary satellite GMS at 0800 BT 23 Sep 2002 for Typhoon Mekkhala(a) and the infrared cloud image of geostationary satellite GOE at 0200 BT 9 Jun 2004 for Typhoon Chanthu(b) in the South China Sea 48 hours before typhoon formation
( denotes the center of tropical disturbance, the circle with diameter 1.5 degree denotes the area of vast deep convection closest to the disturbance center)
图 4 2011年南海台风海马(1104)(a)、2011年南海台风海棠(1118)(b)生成前48 h海表温度(等值线,单位:℃,红色等值线为26.5℃)和对流有效位能(填色)
(实心圆及其红色连线为台风生成前48 h内扰动路径,生成前48 h位置为黑色实心圆;台风符号为台风生成最佳路径位置)
Fig. 4 The sea surface temperature(the contour, unit:℃, the red one is 26.5℃) and the convective potential energy(the shaded) 48 hours before typhoon formation for Typhoon Haima in 2011(a) and Typhoon Haitang in 2011(b) in the South China Sea
(the solid circle and red connector denotes the disturbance track inner 48 hours prior to typhoon formation, the black solid circle denotes the position of disturbance center at 48 hours before typhoon formation, the typhoon symbol is the location for typhoon formation)
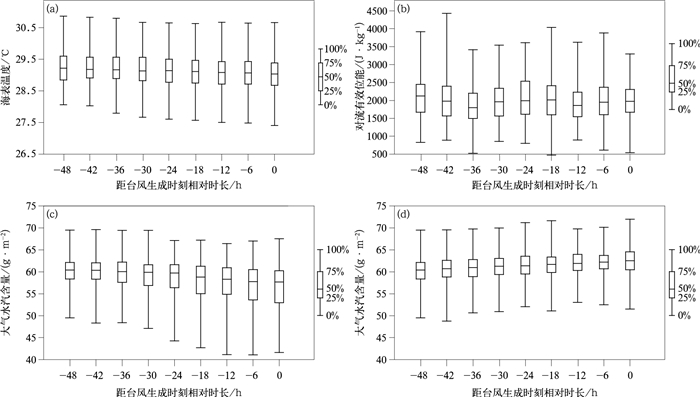
图 5 南海台风生成前48 h内扰动中心附近海表温度(a)、对流有效位能(b)箱体图及台风生成前48 h(c)和台风生成时刻(d)扰动路径上海表至300 hPa扰动中心大气水汽含量变化箱体图
Fig. 5 The box diagram for the time evolution of the sea surface temperature(a) and convective potential energy(b) of the disturbance center inner 48 hours prior to typhoon formation with the box diagram for the water vapor content of the disturbance center from sea-level surface to 300 hPa along the track of the disturbance 48 hours before typhoon formation(c) and at the time of typhoon formation(d)
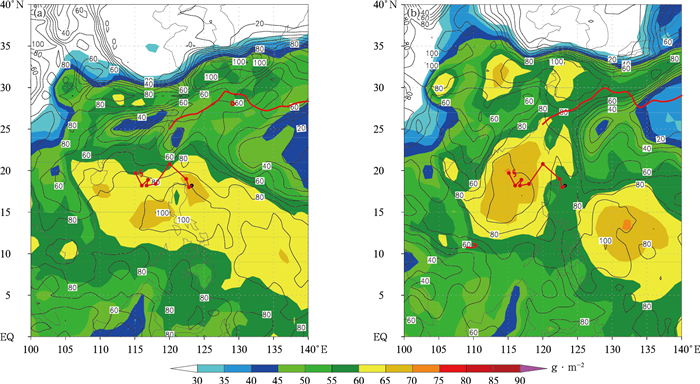
图 6 2011年南海台风海马(1104)生成前48 h(a)、生成时刻(b)可降水量(填色)与600 hPa相对湿度(等值线,单位:%)(其他说明同图 4)
Fig. 6 The atmospheric precipitable water(the shaded) and relative humidity at 600 hPa(the contour, unit:%) 48 hours before typhoon formation(a) and the time of typhoon formation(b) for Typhoon Haima in 2011(the others same as in Fig. 4)
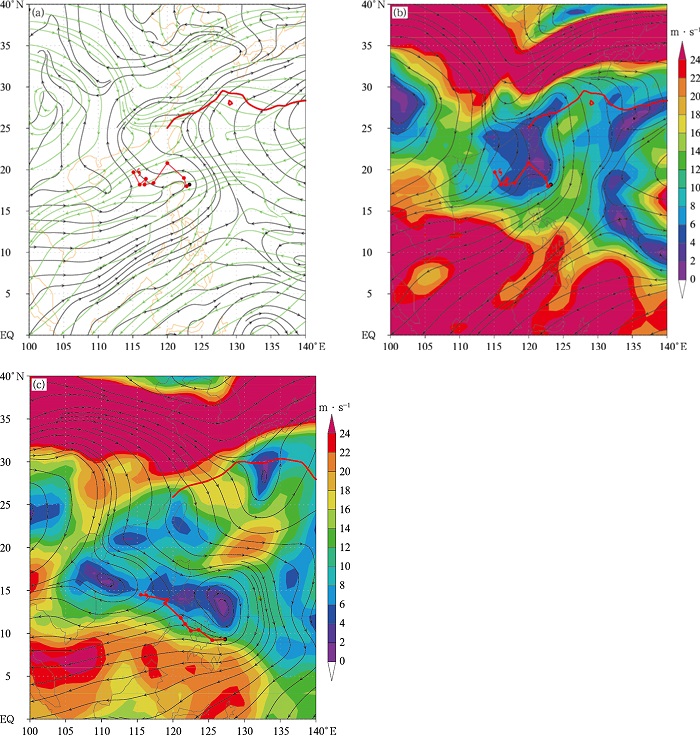
图 7 2011年南海台风海马(1104)生成前48 h 850 hPa流线(黑色)和200 hPa流线(绿色)(a)、200 hPa与850 hPa风垂直切变流线和风切变幅度(填色)(b) 及台风赫伯特(8005)生成前48 h 200 hPa与850 hPa风垂直切变流线和风切变幅度(填色)(c)
(其他说明同图 4)
Fig. 7 The streamline at 850 hPa(the black) and 200 hPa(the green) 48 hours before typhoon formation for Typhoon Haima in 2011(a), the streamline of the wind vertical shear and the wind shear amplitude(the shaded) between 200 hPa and 850 hPa 48 hours before typhoon formation for Typhoon Haima in 2011(b), the streamline of the wind vertical shear(black line) and the wind shear amplitude(the shaded) between 200 hPa and 850 hPa 48 hours before typhoon formation for Typhoon Herbert in 1980(c)
(the others same as in Fig. 4)
图 8 台风生成前48 h内扰动中心附近风切变时间演变箱体图(a)和台风生成前48 h扰动移动路径上扰动中心附近风切变箱体图(b)
Fig. 8 The box diagram for the wind shear amplitude change near the disturbance center inner 48 hours prior to typhoon formation(a) and the box diagram for the wind shear amplitude near the disturbance center along the track of the disturbance 48 hours before typhoon formation(b)
图 9 南海台风生成前48 h内扰动中心附近(a)和台风生成前48 h扰动路径上扰动中心附近(b)850 hPa垂直涡度变化箱体图
Fig. 9 The box diagram for the vertical vorticity change of the disturbance center at 850 hPa inner 48 hours prior to typhoon formation(a) and the disturbance center at 850 hPa along the track of the disturbance 48 hours before typhoon formation(b)
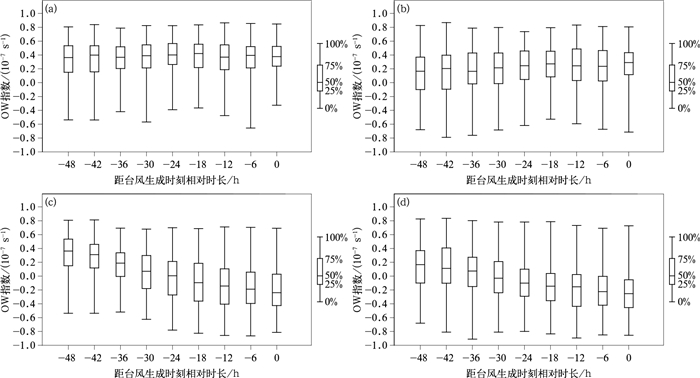
图 10 台风生成前48 h内扰动中心附近850 hPa(a)和500 hPa(b)OW指数演变箱体图以及台风生成前48 h扰动移动路径上扰动中心附近850 hPa(c)和500 hPa(d)OW指数箱体图
Fig. 10 The box diagram for the time evolution of OW index of the disturbance center at 850 hPa(a) and 500 hPa(b) inner 48 hours prior to typhoon formation with the change of OW index of the disturbance center along the track of the disturbance 48 hours before typhoon formation at 850 hPa(c) and 500 hPa(d)
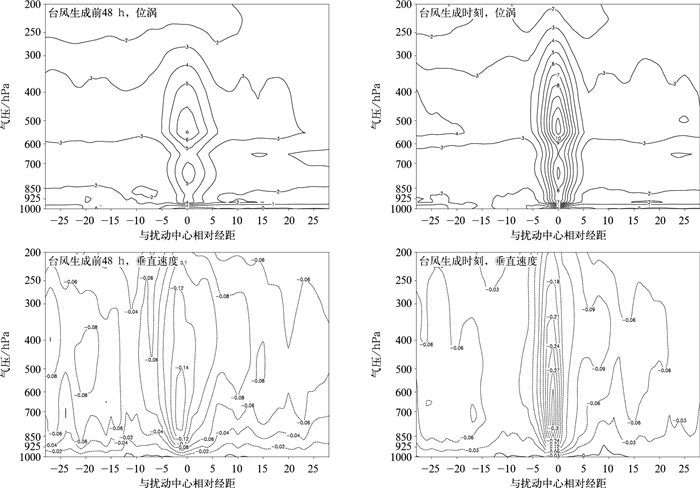
图 11 台风生成前48 h以及台风生成时刻过扰动中心位涡(单位:10-6 m2·K·s-1·kg-1)及垂直速度(单位:Pa·s-1)纬向垂直分布
Fig. 11 The zonal distribution of potential vortices(unit:10-6 m2·K·s-1·kg-1) and the vertical velocity(unit:Pa·s-1) on the isobaric surface of the disturbance center during typhoon formation at the time of 48 hours before typhoon formation and the time of typhoon formation
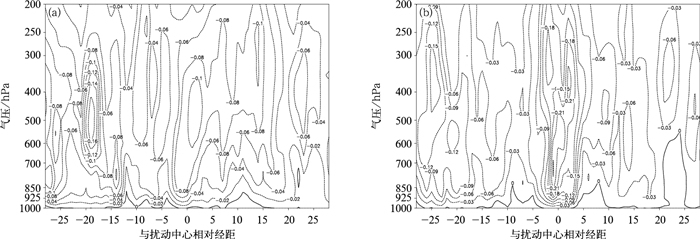
图 12 30个南海台风生成个例生成前48 h(a)及台风生成时刻(b)过扰动中心垂直速度(单位:Pa·s-1)纬向垂直分布
Fig. 12 The zonal distribution of the vertical velocity on the isobaric surface of the disturbance center during typhoon formation at the time of 48 hours before typhoon formation(a) and the time of typhoon formation(b) of 30 typhoon cases
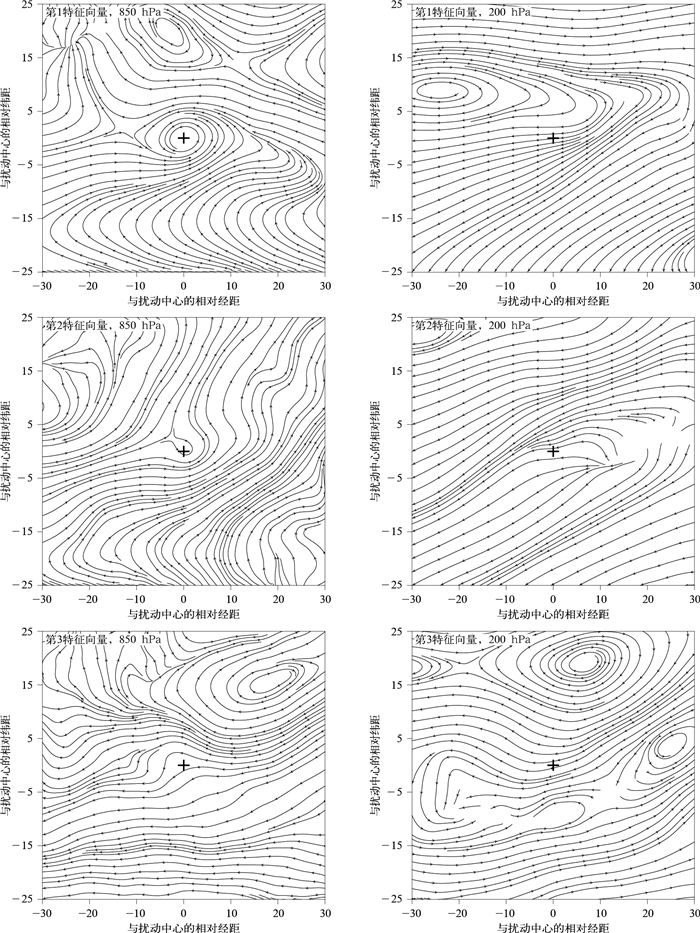
表 1 南海台风生成前48 h 850 hPa及200 hPa经向风和纬向风分量联合EOF分解前8个特征向量的方差贡献率和累计方差贡献率
Table 1 The variance contribution and the cumulative variance contribution of the first 8 eigenvectors of combined EOF analysis of u and v at 850 hPa and 200 hPa 48 hours before typhoon formation in the South China Sea
贡献率 特征向量 1 2 3 4 5 6 7 8 方差贡献率/% 57.2 9.2 5.4 3.2 2.5 1.6 1.4 1.1 累计方差贡献率/% 57.2 66.4 71.8 75.0 77.5 79.1 80.5 81.6 -
[1] 陈联寿, 丁一汇. 西太平洋台风概论. 北京: 科学出版社, 1979.Chen Lianshou, Ding Yihui. The Conspectus of Western Pacific Typhoon. Beijing: Science Press, 1979. [2] 何立富, 陈双, 郭云谦. 台风利奇马(1909)极端强降雨观测特征及成因. 应用气象学报, 2020, 31(5): 513-526. doi: 10.11898/1001-7313.20200501He Lifu, Chen Shuang, Guo Yunqian. Observation characteristics and synoptic mechanisms of Typhoon Lekima extreme rainfall in 2019. J Appl Meteor Sci, 2020, 31(5): 513-526. doi: 10.11898/1001-7313.20200501 [3] 麻素红, 吴俞, 瞿安祥, 等. T213与T639模式热带气旋预报误差对比. 应用气象学报, 2012, 23(2): 167-173. doi: 10.3969/j.issn.1001-7313.2012.02.005Ma Suhong, Wu Yu, Qu Anxiang, et al. Comparative analysis on tropical cyclone numerical forecast errors of T213 and T639 Models. J Appl Meteor Sci, 2012, 23(2): 167-173. doi: 10.3969/j.issn.1001-7313.2012.02.005 [4] 麻素红, 张进, 沈学顺, 等. 2016年GRAPES_TYM改进及对台风预报影响. 应用气象学报, 2018, 29(3): 257-269. doi: 10.11898/1001-7313.20180301Ma Suhong, Zhang Jin, Shen Xueshun, et al. The upgrade of GRAPE_TYM in 2016 and its impacts on tropical cyclone prediction. J Appl Meteor Sci, 2018, 29(3): 257-269. doi: 10.11898/1001-7313.20180301 [5] 瞿安祥, 麻素红, Liu Qingfu, 等. 全球数值模式中的台风初始化. Ⅰ: 方案设计. 气象学报, 2009, 67(5): 716-726. doi: 10.3321/j.issn:0577-6619.2009.05.005Qu Anxiang, Ma Suhong, Liu Qingfu, et al. The initialization of tropical cyclones in the NMC global model. Part Ⅰ: Scheme design. Acta Meteor Sinica, 2009, 67(5): 716-726. doi: 10.3321/j.issn:0577-6619.2009.05.005 [6] 瞿安祥, 麻素红, 李娟, 等. 全球数值模式中的台风初始化. Ⅱ: 业务应用. 气象学报, 2009, 67(5): 727-735. doi: 10.3321/j.issn:0577-6619.2009.05.006Qu Anxiang, Ma Suhong, Li Juan, et al. The initialization of tropical cyclones in the NMC global. Part Ⅱ: Implementation. Acta Meteor Sinica, 2009, 67(5): 727-735. doi: 10.3321/j.issn:0577-6619.2009.05.006 [7] 瞿安祥, 麻素红, 张进. T639全球模式的台风初始化方案升级试验. 气象, 2016, 42(6): 664-673. https://www.cnki.com.cn/Article/CJFDTOTAL-QXXX201606002.htmQu Anxiang, Ma Suhong, Zhang Jin. Updated experiments of tropical cyclone initialization in global model T639. Meteorological Monthly, 2016, 42(6): 664-673. https://www.cnki.com.cn/Article/CJFDTOTAL-QXXX201606002.htm [8] 吴俞, 麻素红, 肖天贵, 等. T213L31模式热带气旋路径数值预报误差分析. 应用气象学报, 2011, 22(2): 182-193. doi: 10.3969/j.issn.1001-7313.2011.02.007Wu Yu, Ma Suhong, Xiao Tiangui, et al. Error analysis of the numerical value forecast for tropical cyclone Paths with the T213L31 Model. J Appl Meteor Sci, 2011, 22(2): 182-193. doi: 10.3969/j.issn.1001-7313.2011.02.007 [9] 高拴柱, 董林, 许映龙, 等. 2016年西北太平洋台风活动特点和预报难点分析. 气象, 2018, 44(2): 284-293. https://www.cnki.com.cn/Article/CJFDTOTAL-QXXX201802008.htmGao Shuanzhu, Dong Lin, Xu Yinglong, et al. Analysis of the characters and forecast difficulties of typhoons in Western North Pacific in 2016. Meteorological Monthly, 2018, 44(2): 284-293. https://www.cnki.com.cn/Article/CJFDTOTAL-QXXX201802008.htm [10] Charney J G, Eliassen A. On the growth of the hurricane depression. J Atmos Sci, 1964, 21(1): 68-75. doi: 10.1175/1520-0469(1964)021<0068:OTGOTH>2.0.CO;2 [11] Emanuel K A. An air-sea interaction theory for tropical cyclone. Part Ⅰ: Steady state maintenance. J Atmos Sci, 1986, 43: 585-604. doi: 10.1175/1520-0469(1986)043<0585:AASITF>2.0.CO;2 [12] Emanuel K A, Neelin J D, Bretherton C S. On large-scale circulation in convection atmospheres. Quart J Roy Meteor Soc, 1994, 120: 1111-1144. doi: 10.1002/qj.49712051902 [13] 韦有暹, 王荫桐, 郭秀英, 等. 南海台风发生发展问题的初步探索. 气象学报, 1965, 35(2): 148-154. https://www.cnki.com.cn/Article/CJFDTOTAL-QXXB196502004.htmWei Youxian, Wang Yintong, Guo Xiuying, et al. Preliminary Research on the development of typhoon over the South China Sea. Acta Meteor Sinica, 1965, 35(2): 148-154. https://www.cnki.com.cn/Article/CJFDTOTAL-QXXB196502004.htm [14] 彭金泉, 梁经萍, 黄佩玲. 南海近海合风发展原因的初步探讨. 热带海洋, 1987, 6(4): 47-54.Peng Jinquan, Liang Jingping, Huang Peiling. A preliminary analysis on contributing factors to the development of typhoon over coastal waters of South China Sea. Tropic Oceanology, 1987, 6(4): 47-54. [15] 林晓能, 宋萍. 盛夏南海台风的结构分析. 海洋预报, 1992, 9(1): 41-46. https://www.cnki.com.cn/Article/CJFDTOTAL-HYYB199201005.htmLin Xiaoneng, Song Ping. Structural analysis of typhoon in the South China Sea in summer. Marine Forecasts, 1992, 9(1): 41-46. https://www.cnki.com.cn/Article/CJFDTOTAL-HYYB199201005.htm [16] 段朝霞, 苏百兴. 9902号南海台风发生发展的综合分析. 广东气象, 2000(增刊Ⅰ): 35-37. https://www.cnki.com.cn/Article/CJFDTOTAL-GDCX2000S1013.htmDuan Zhaoxia, Su Baixing. Comprehensive analysis of typhoon (9902) in the South China Sea. Guangdong Meteorology, 2000(Suppl Ⅰ): 35-37. https://www.cnki.com.cn/Article/CJFDTOTAL-GDCX2000S1013.htm [17] 罗秋红, 李天然, 何夏江. OLR与南海热带气旋发展的关系. 应用气象学报, 2004, 15(1): 81-87. doi: 10.3969/j.issn.1001-7313.2004.01.010Luo Qiuhong, Li Tianran, He Xiajiang. Relationship of OLR and development of tropical cyclone over South China Sea. J Appl Meteor Sci, 2004, 15(1): 81-87. doi: 10.3969/j.issn.1001-7313.2004.01.010 [18] 赵珊珊, 高歌, 孙旭光, 等. 西北太平洋热带气旋频数和强度变化趋势初探. 应用气象学报, 2009, 20(5): 555-563. doi: 10.3969/j.issn.1001-7313.2009.05.006Zhao Shanshan, Gao Ge, Sun Xuguang, et al. Climatological characteristics of tropical cyclones in the Northwestern Pacific. J Appl Meteor Sci, 2009, 20(5): 555-563. doi: 10.3969/j.issn.1001-7313.2009.05.006 [19] 叶婷婷. 南海热带气旋的若干气候特征分析. 南京: 南京大学, 2010.Ye Tingting. A Study to Several Climatological Characteristic of Tropical Cyclones from South China Sea. Nanjing: Nanjing University, 2010. [20] 杨亚新. 1949-2003年南海热带气旋的发生规律. 上海海事大学学报, 2005, 26(4): 16-19. doi: 10.3969/j.issn.1672-9498.2005.04.004Yang Yaxin. Occurrence regularity of tropical cyclone in South China Sea. Journal of Shanghai Maritime University, 2005, 26(4): 16-19. doi: 10.3969/j.issn.1672-9498.2005.04.004 [21] 吴迪生, 赵雪, 冯伟忠, 等. 南海灾害性土台风统计分析. 热带气象学报, 2005, 21(3): 300-314. https://www.cnki.com.cn/Article/CJFDTOTAL-RDQX200503010.htmWu Disheng, Zhao Xue, Feng Weizhong, et al. The statistical analysis to the local harmful typhoon of South China Sea. Tropical Meteorology, 2005, 21(3): 300-314. https://www.cnki.com.cn/Article/CJFDTOTAL-RDQX200503010.htm [22] Lee C S. Observational analysis of tropical cyclogenesis in the Western North Pacific. Part Ⅰ: Structure evolution of cloud clusters. J Atmos Sci, 1989, 46(16): 2580-2598. doi: 10.1175/1520-0469(1989)046<2580:OAOTCI>2.0.CO;2 [23] Fu B, Peng M S, Li T. Developing versus nondeveloping disturbances for tropical cyclone formation. Part Ⅱ: Western North Pacific. Mon Wea Rev, 2012, 140(4): 1067-1080. http://adsabs.harvard.edu/abs/2012MWRv..140.1067F [24] 彭治班, 刘建文, 郭虎, 等. 国外强对流天气的应用研究. 北京: 气象出版社, 2001: 89-95.Peng Zhiban, Liu Jianwen, Guo Hu, et al. Study and Application of Strong Convective Weather Abroad. Beijing: China Meteorological Press, 2001: 89-95. [25] 铃伟妙, 罗亚丽, 张人禾, 等. 引发舟曲特大泥石流灾害强降雨过程成因. 应用气象学报, 2011, 2(4): 385-397. doi: 10.3969/j.issn.1001-7313.2011.04.001Qian Weimiao, Luo Yali, Zhang Renhe, et al. The heavy rainfall event leading to the large debris flow at Zhouqu. J Appl Meteor Sci, 2011, 2(4): 385-397. doi: 10.3969/j.issn.1001-7313.2011.04.001 [26] 王黉, 李英, 宋丽莉, 等. 川藏地区雷暴大风活动特征和环境因子对比. 应用气象学报, 2020, 31(4): 435-446. doi: 10.11898/1001-7313.20200406Wang Hong, Li Ying, Song Lili, et al. Comparison of characteristics and environmental factors of thunderstorm gales over the Sichuan-Tibet Region. J Appl Meteor Sci, 2020, 31(4): 435-446. doi: 10.11898/1001-7313.20200406 [27] 孙继松, 陶祖钰. 强对流天气分析与预报中的若干基本问题. 气象, 2012, 38(2): 164-173. https://www.cnki.com.cn/Article/CJFDTOTAL-QXXX201202007.htmSun Jisong, Tao Zuyu. Some essential issues connected with sever convective weather analysis and forecast. Meteorological Monthly, 2012, 38(2): 164-173. https://www.cnki.com.cn/Article/CJFDTOTAL-QXXX201202007.htm [28] Moncrieff M, Miller M J. The dynamics and simulation of tropical cumulonimbus and squall lines. Quart J Roy Meteor Soc, 1976, 102: 373-394. doi: 10.1002/qj.49710243208 [29] Ghil M, Alien M R, Dettinger M D, et al. Advanced spectral methods for climatic time series. Rev Geophys, 2002, 40(1): 1-41. [30] 魏凤英. 现代气候统计诊断与预测技术(第二版). 北京: 气象出版社, 2007: 105-113.Wei Fengying. Modern Climate Statistical Diagnosis and Prediction Technology(2nd ed). Beijing: China Meteorological Press, 2007: 105-113. [31] Dunkerton T J, Montgomery M T, Wang Z. Tropical cyclogenesis in a tropical wave critical layer: Easterly waves. Atmos Chem Phys, 2009, 9(15): 5587-5646. doi: 10.5194/acp-9-5587-2009 [32] Tory K J, Dare R A, Davidson N E, et al. The importance of low-deformation vorticity in tropical cyclone formation. Atmos Chem Phys, 2013, 13(4): 2115-2132. doi: 10.5194/acp-13-2115-2013 [33] Montgomery M T, Lussier Ⅲ L L, Moore R W, et al. The genesis of Typhoon Nuri as observed during the Tropical Cyclone Structure 2008(TCS-08) Field Experiment. Part 1: The role of the easterly wave critical layer. Atmos Chem Phys, 2010, 10: 9879-9900. doi: 10.5194/acp-10-9879-2010 [34] Montgomery M T, Smith R K. The genesis of Typhoon Nuri as observed during the Tropical Cyclone Structure 2008(TCS08) Field Experiment. Part 2: Observations of the convective environment. Atmos Chem Phys, 2012, 12: 4001-4009. doi: 10.5194/acp-12-4001-2012 [35] Ge X Y, Li T, Melinda S P. Tropical cyclone genesis efficiency: Mid-level versus bottom vortex. Tropical Meteorology, 2013, 19(3): 197-213. http://www.cqvip.com/QK/85390X/20133/1002102656.html [36] 陈联寿. 热带气旋研究和业务预报技术的发展. 应用气象学报, 2006, 17(6): 672-681. doi: 10.3969/j.issn.1001-7313.2006.06.005Chen Lianshou. The evolution on research and operational forecasting techniques of tropical cyclones. J Appl Meteor Sci, 2006, 17(6): 672-681. doi: 10.3969/j.issn.1001-7313.2006.06.005 [37] Dvorak V F. Tropical Cyclone Intensity Analysis Using Satellite Data//NOAA Technical Report NESDIS 11, 1984. [38] Kishimoto K, Nishigaki T, Nishimura S, et al. Comparative Study on Organized Convective Cloud Systems Detected through Early Stage Dvorak Analysis and Tropical Cyclones in Early Developing Stage in the Western North Pacific and the South China Sea//Technical Review No. 9, RSMC Tokyo-Typhoon Center, 2007. [39] Chen Y S, Yau M K. Asymmetric structure in a simulated landfalling hurricane. J Atmos Sci, 2003, 60(18): 2293-2312. http://ci.nii.ac.jp/naid/80016120179 [40] Moller J D, Shapiro L J. Balanced contributions to the intensification of hurricane opal as diagnosed from a GFDL model forecast. Mon Wea Rev, 2002, 130(7): 1866-1881. doi: 10.1175/1520-0493(2002)130<1866:BCTTIO>2.0.CO;2 [41] Shapiro L J, Franklin J L. Potential vorticity in hurricane Gloria. Mon Wea Rev, 1995, 123(5): 1465-1475. doi: 10.1175/1520-0493(1995)123<1465:PVIHG>2.0.CO;2 [42] 井喜, 贺文彬, 毕旭, 等. 远距离台风影响陕北突发性暴雨成因分析. 应用气象学报, 2005, 16(5): 655-662. http://qikan.camscma.cn/article/id/20050584Jing Xi, He Wenbin, Bi Xu, et al. Analysis of the abrupt rainstorm in North Shaanxi in relation to typhoon far away. J Appl Meteor Sci, 2005, 16(5): 655-662. http://qikan.camscma.cn/article/id/20050584 [43] 孙力, 董伟, 药明, 等. 1215号"布拉万"台风暴雨及降水非对称性分布的成因分析. 气象学报, 2015, 73(1): 36-49. https://www.cnki.com.cn/Article/CJFDTOTAL-QXXB201501003.htmSun Li, Dong Wei, Yao Ming, et al. A diagnostic analysis of the causes of the torrential rain and precipitation asymmetric distribution of Typhoon Bolaven(2012). Acta Meteor Sinica, 2015, 73(1): 36-49. https://www.cnki.com.cn/Article/CJFDTOTAL-QXXB201501003.htm [44] Robert A H Jr. Clouds in tropical cyclones. Mon Wea Rev, 2010, 138: 293-344. doi: 10.1175/2009MWR2989.1 -


 设为首页
设为首页 加入收藏
加入收藏


 下载:
下载:


