
 设为首页
设为首页 加入收藏
加入收藏

Climatic Characteristics of Regional Persistent Heat Event in the Eastern China During Recent 60 Years
-
摘要: 利用1961—2019年中国2407个气象站的日最高气温资料,在判别华南、长江、黄淮和华北4个区域持续高温过程的基础上,比较各区域持续高温过程的气候变化特征。结果表明:华南区域性持续高温过程跨越季节最长,从5月中旬至10月初均可能出现;华南区域性持续高温指数存在显著的线性增长趋势,其增长率最高(3.3 d·(10 a)-1)。长江区域性持续高温过程持续性强,气候平均年累积日数最多,但通常出现区域持续高温过程最迟;长江区域性持续高温指数存在线性增长趋势。黄淮区域性持续高温指数的线性增长趋势不明显,但黄淮区域历史上仅有的4次非夏季持续高温过程均发生于20世纪90年代末至21世纪初。华北区域性持续高温过程气候平均年累积日数少、结束早;华北区域性持续高温指数存在显著的线性增长趋势,线性增长相关系数仅次于华南。长江和华南两区域持续高温指数的相对强弱存在显著的年代际变化,1961—1978年长江明显强于华南,1979—2019年则为华南略强于长江。Abstract: Regional persistent heat event is extensively studied and its intensity is normally investigated from the view of regional average. Climatic characteristics of persistent heat event in 4 regions in the eastern China are analyzed on the basis of distinguishing historical persistent heat event in the South China, the Yangtze River, the Huanghuai and the North China, using the daily maximum temperature data of 2407 stations in China during 1961-2019. The definition index of regional persistent heat event is established, in which the proximity of high temperature stations, the spatial range, the temporal consistency, the regional climate characteristics and the universality of methods are synthesized. Average times of regional persistent heat event in the South China, the Yangtze River, the Huanghuai and the North China are 3.3, 2.8, 2.2 and 0.8 per year respectively, with an average duration of 5.1 d, 6.4 d, 5.0 d and 3.9 d for per event, and the average annual cumulative days in climatology are 16.8 d, 17.8 d, 11.0 d, 3.1 d. Both the duration and the average annual cumulative days of persistent heat event are the longest in the Yangtze River, indicating that the persistent heat event in the Yangtze River is the most serious in climatology among these regions. The average annual cumulative days of persistent heat event in the North China are the least, and it usually ends at the end of July or before. There is a significant linear growing trend in the persistent heat event index in the South China, the North China, and the Yangtze River. There are only 4 non-summer persistent heat events in the Huanghuai in recent 20 years. The difference in strength of the persistent heat event index between the Yangtze River and the South China has significant inter-decadal trends. The index in the Yangtze River is obviously stronger than that in the South China during the first period of 1961-1978, while the index in the South China is slightly stronger than that in the Yangtze River during the second period of 1979-2019. The difference of persistent heat event between these two regions changes by nearly 10 d over these years.
-

图 1 夏季以江西弋阳站为基准点(红色圆点)得到的空间相关(等值线)(填色区为正相关达到0.05显著性水平,红色框表示长江区域)(a)及中国东部4个区域分布(蓝色点为气象站,红线框由南至北依次为华南区域、长江区域、黄淮区域和华北区域,红色圆点为各区的基准点)(b)
Fig. 1 Spatial correlation coefficients(the contour) of summer temperature in the eastern China with Yiyang Station in Jiangxi Province(the red dot) (the shaded denotes the positive correlation passing the test of 0.05 level.The red box is the Yangtze River domain)(a) and four domains in the eastern China(blue dots are stations; red boxes from south to north are named the South China domain, the Yangtze River domain, the Huanghuai domain and the North China domain;red dots are the reference points)(b)
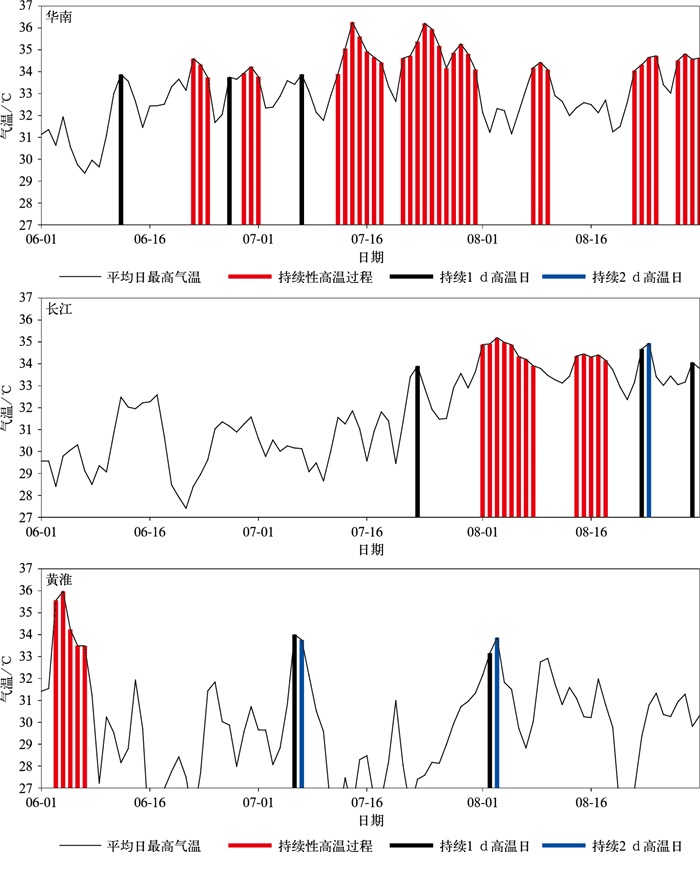
图 2 2020年6—8月华南区域、长江区域和黄淮区域的平均日最高气温
Fig. 2 Regional mean daily maximum temperature in the South China domain, the Yangtze River domain and the Huanghuai domain during Jun-Aug in 2020
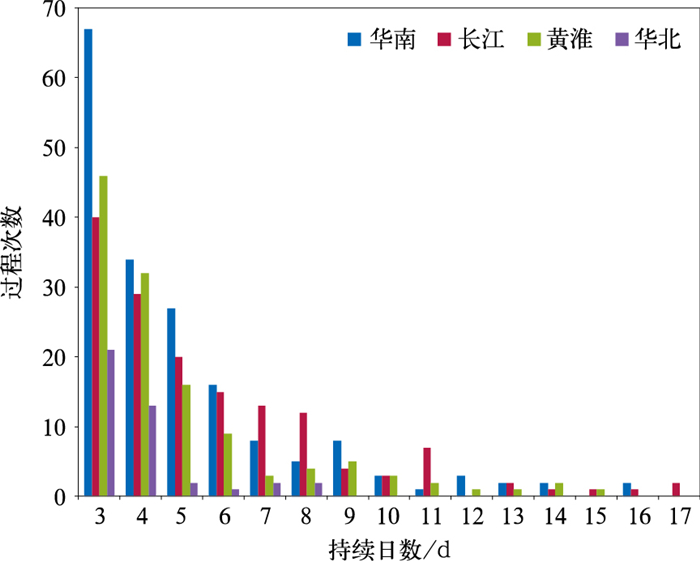
图 3 华南区域、长江区域、黄淮区域和华北区域持续高温过程次数与持续日数
Fig. 3 Frequency and duration of persistent heat event in the South China domain, the Yangtze River domain, the Huanghuai domain and the North China domain
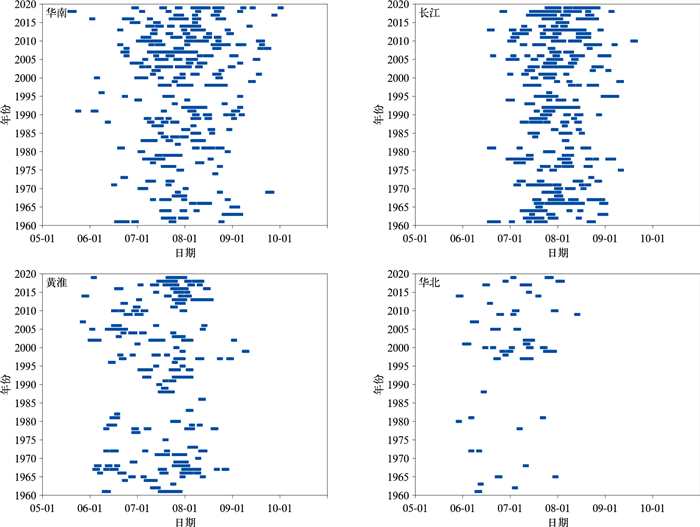
图 4 1961—2019年华南区域、长江区域、黄淮区域和华北区域的持续高温过程发生时间
Fig. 4 Occurrence time of persistent heat event during 1961-2019 in the South China domain, the Yangtze River domain, the Huanghuai domain and the North China domain
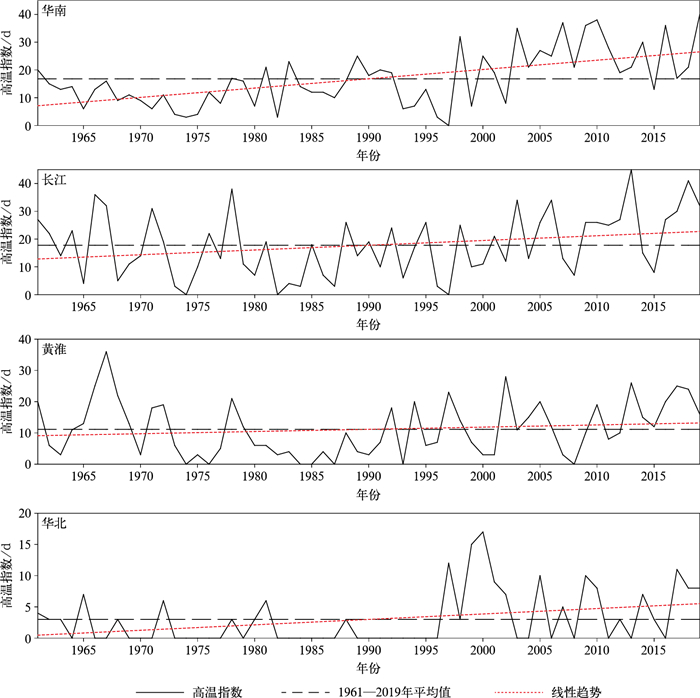
图 5 1961—2019年华南区域、长江区域、黄淮区域和华北区域的持续高温指数
Fig. 5 Persistent heat index in the South China domain, the Yangtze River domain, the Huanghuai domain and the North China domain during 1961-2019
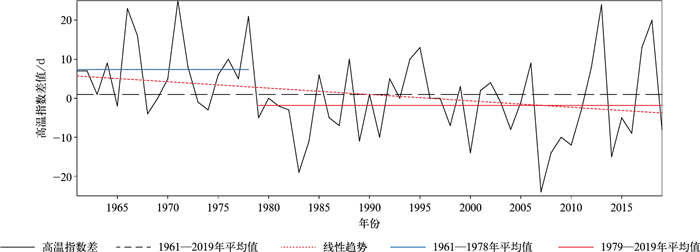
图 6 1961—2019年长江区域与华南区域的持续高温指数差值
Fig. 6 Difference of persistent heat index between the Yangtze River domain and the South China domain during 1961-2019

图 7 1961—2019年华南区域和长江区域的长持续高温过程年累积日数
Fig. 7 Accumulated days for long lived heat event in the South China domain and the Yangtze River domain during 1961-2019
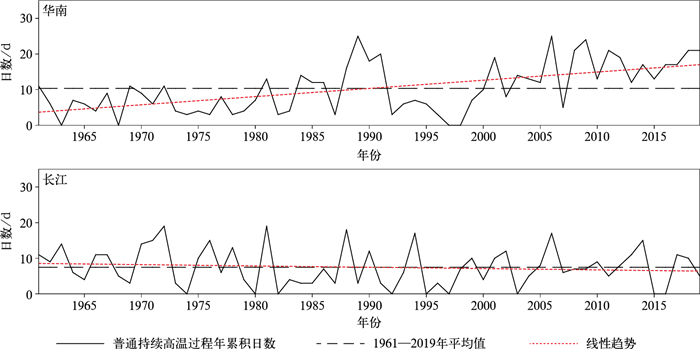
图 8 1961—2019年华南区域和长江区域的普通持续高温过程年累积日数
Fig. 8 Accumulated days for short lived heat event in the South China domain and the Yangtze River domain during 1961-2019
表 1 中国东部4个高温区的基准点、范围以及区域平均最高气温的第80百分位值
Table 1 Reference points of correlation analysis and 4 domains in the eastern China
区域 基准点 纬度 经度 第80百分位值/℃ 华南 广东罗定 21°~26°N 105°~120°E 33.7 长江 江西弋阳 26°~32°N 105°~122°E 33.8 黄淮 河南郾城 32°~37°N 105°~122°E 32.5 华北 北京通州 37°~43°N 105°~122°E 30.6  下载: 导出CSV
表 2 中国东部4个区域1961—2019年的持续高温过程次数及过程持续日数
Table 2 Number and duration of persistent heat event in 4 domains in the eastern China during 1961-2019
区域 过程总数 年平均次数 过程平均持续日数/d 最长持续日数/d 华南 193 3.3 5.1 32 长江 163 2.8 6.4 27 黄淮 131 2.2 5.0 15 华北 45 0.8 3.9 8
下载: 导出CSV
-
[1] Perkins S E, Alexander L V, Nairn J R. Increasing frequency, intensity and duration of observed global heat waves and warm spells. Geophys Res Lett, 2012, 39(20): L20714. http://adsabs.harvard.edu/abs/2012GeoRL..3920714P [2] Erdenebat E, Sato T. Recent increase in heat wave frequency around Mongolia: Role of atmospheric forcing and possible influence of soil moisture deficit. Atmos Sci Lett, 2016, 17(2): 135-140. doi: 10.1002/asl.616 [3] 陈辉, 黄卓, 田华, 等. 高温中暑气象等级评定方法. 应用气象学报, 2009, 20(4): 451-457. doi: 10.3969/j.issn.1001-7313.2009.04.009Chen H, Huang Z, Tian H, et al. An evaluation method of heatstroke grade with meteorological approaches. J Appl Meteor Sci, 2009, 20(4): 451-457. doi: 10.3969/j.issn.1001-7313.2009.04.009 [4] 叶殿秀, 尹继福, 陈正洪, 等. 1961-2010年我国夏季高温热浪的时空变化特征. 气候变化研究进展, 2013, 9(1): 15-20. doi: 10.3969/j.issn.1673-1719.2013.01.003Ye D X, Yin J F, Chen Z H, et al. Spatiotemporal change characteristics of summer heatwaves in China in 1961-2010. Climate Change Research, 2013, 9(1): 15-20. doi: 10.3969/j.issn.1673-1719.2013.01.003 [5] 孙建奇. 2013年北大西洋破纪录高海温与我国江淮-江南地区极端高温的关系. 科学通报, 2014, 59(27): 2714-2719. https://www.cnki.com.cn/Article/CJFDTOTAL-KXTB201427010.htmSun J Q. Record-breaking SST over mid-North Atlantic and extreme high temperature over the Jianghuai-Jiangnan region of China in 2013. Chinese Science Bulletin, 2014, 59(27): 2714-2719. https://www.cnki.com.cn/Article/CJFDTOTAL-KXTB201427010.htm [6] 邹海波, 吴珊珊, 单九生, 等. 2013年盛夏中国中东部高温天气的成因分析. 气象学报, 2015, 73(3): 481-495. https://www.cnki.com.cn/Article/CJFDTOTAL-QXXB201503006.htmZou H B, Wu S S, Shan J S, et al. Diagnostic study of the severe high temperature event over Mid-East China in 2013 summer. Acta Meteorologica Sinica, 2015, 73(3): 481-495. https://www.cnki.com.cn/Article/CJFDTOTAL-QXXB201503006.htm [7] Deng K, Yang S, Gu D, et al. Record-breaking heat wave in southern China and delayed onset of South China Sea summer monsoon driven by the Pacific subtropical high. Climate Dyn, 2020, 54: 3751-3764. doi: 10.1007/s00382-020-05203-8 [8] 钱婷婷, 王迎春, 郑祉芳, 等. 造成北京连续高温的河套高压结构分析. 应用气象学报, 2005, 16(2): 167-173. doi: 10.3969/j.issn.1001-7313.2005.02.005Qian T T, Wang Y C, Zheng Z F, et al. A case study of the structure of the Hetao high which caused long-lasting hot weather in Beijing. J Appl Meteor Sci, 2005, 16(2): 167-173. doi: 10.3969/j.issn.1001-7313.2005.02.005 [9] Deng K, Yang S, Ting M, et al. An intensified mode of variability modulating the summer heat waves in Eastern Europe and Northern China. Geophys Res Lett, 2018, 45(20): 11361-11369. http://www.researchgate.net/publication/328258529_An_Intensified_Mode_of_Variability_Modulating_the_Summer_Heat_Waves_in_Eastern_Europe_and_Northern_China [10] 霍治国, 尚莹, 邬定荣, 等. 中国小麦干热风灾害研究进展. 应用气象学报, 2019, 30(2): 129-141. doi: 10.11898/1001-7313.20190201Huo Z G, Shang Y, Wu D R, et al. Review on disaster of hot dry wind for wheat in China. J Appl Meteor Sci, 2019, 30(2): 129-141. doi: 10.11898/1001-7313.20190201 [11] 杨建莹, 霍治国, 王培娟, 等. 江西早稻高温热害发生时间分布特征. 应用气象学报, 2020, 31(1): 42-51. doi: 10.11898/1001-7313.20200104Yang J Y, Huo Z G, Wang P J, et al. Occurrence characteristics of early rice heat disaster in Jiangxi Province. J Appl Meteor Sci, 2020, 31(1): 42-51. doi: 10.11898/1001-7313.20200104 [12] 史军, 丁一汇, 崔林丽. 华东极端高温气候特征及成因分析. 大气科学, 2009, 33(2): 347-358. doi: 10.3878/j.issn.1006-9895.2009.02.13Shi J, Ding Y H, Cui L L. Climatic characteristics of extreme maximum temperature in East China and its causes. Chinese Journal of Atmospheric Sciences, 2009, 33(2): 347-358. doi: 10.3878/j.issn.1006-9895.2009.02.13 [13] Chen R, Wen Z, Lu R. Evolutions of the circulation anomalies and the quasi-biweekly oscillations associated with extreme heat events in South China. J Climate, 2016, 29(19): 6909-6921. doi: 10.1175/JCLI-D-16-0160.1 [14] 李庆祥, 黄嘉佑. 对我国极端高温事件阈值的探讨. 应用气象学报, 2011, 22(2): 138-144. doi: 10.3969/j.issn.1001-7313.2011.02.002Li Q X, Huang J Y. Threshold value on extreme high temperature event in China. J Appl Meteor Sci, 2011, 22(2): 138-144. doi: 10.3969/j.issn.1001-7313.2011.02.002 [15] 方宇凌, 简茂球. 2003年夏季华南持续高温天气过程及热力诊断. 热带海洋学报, 2011, 30(3): 30-37. doi: 10.3969/j.issn.1009-5470.2011.03.005Fang Y L, Jian M Q. Diagnosis study of persistent heat waves in South China during summer 2003. Journal of Tropical Oceanography, 2011, 30(3): 30-37. doi: 10.3969/j.issn.1009-5470.2011.03.005 [16] 杨涵洧, 封国林. 2013年盛夏中国持续性高温事件诊断分析. 高原气象, 2016, 35(2): 484-494. https://www.cnki.com.cn/Article/CJFDTOTAL-GYQX201602019.htmYang H W, Feng G L. Diagnostic analyses of characteristics and causes of regional and persistent high temperature event in China. Plateau Meteorology, 2016, 35(2): 484-494. https://www.cnki.com.cn/Article/CJFDTOTAL-GYQX201602019.htm [17] 彭京备, 刘舸, 孙淑清. 2013年我国南方持续性高温天气及副热带高压异常维持的成因分析. 大气科学, 2016, 40(5): 897-906. https://www.cnki.com.cn/Article/CJFDTOTAL-DQXK201605002.htmPeng J B, Liu G, Sun S Q. An analysis on the formation of the heat wave in southern China and its relation to the anomalous western Pacific subtropical high in the summer of 2013. Chinese Journal of Atmospheric Sciences, 2016, 40(5): 897-906. https://www.cnki.com.cn/Article/CJFDTOTAL-DQXK201605002.htm [18] 董晓峣, 武炳义. 江淮地区夏季高温事件与北极冷异常的动力联系. 应用气象学报, 2019, 30(4): 431-442. doi: 10.11898/1001-7313.20190404Dong X X, Wu B Y. Dynamic linkages between heat wave events in Jianghuai region and Arctic summer cold anomaly. J Appl Meteor Sci, 2019, 30(4): 431-442. doi: 10.11898/1001-7313.20190404 [19] 张芳华, 陶亦为, 高辉, 等. 2018年春末南方极端持续高温及MJO影响. 大气科学学报, 2019, 42(1): 100-108. https://www.cnki.com.cn/Article/CJFDTOTAL-NJQX201901011.htmZhang F H, Tao Y W, Gao H, et al. Persistent extreme high temperature event in southern China in late spring of 2018 and the effect of Madden-Julian Oscillation. Trans Atmos Sci, 2019, 42(1): 100-108. https://www.cnki.com.cn/Article/CJFDTOTAL-NJQX201901011.htm [20] 唐恬, 金荣花, 彭相瑜. 2013等年夏季我国南方区域性高温天气的极端性分析. 气象, 2014, 40(10): 1207-1215. doi: 10.7519/j.issn.1000-0526.2014.10.005Tang T, Jin R H, Peng X Y. Analysis on extremely high temperature over southern China in summer 2013. Meteorological Monthly, 2014, 40(10): 1207-1215. doi: 10.7519/j.issn.1000-0526.2014.10.005 [21] 王国复, 叶殿秀, 张颖娴, 等. 2017年我国区域性高温过程特征及异常大气环流成因分析. 气候变化研究进展, 2018, 14(4): 341-349. https://www.cnki.com.cn/Article/CJFDTOTAL-QHBH201804002.htmWang G F, Ye D X, Zhang Y X, et al. Characteristics and abnormal atmospheric circulation of regional high temperature process in 2017 over China. Climate Change Research, 2018, 14(4): 341-349. https://www.cnki.com.cn/Article/CJFDTOTAL-QHBH201804002.htm [22] 金荣花, 马杰, 任宏昌, 等. 我国10~30天延伸期预报技术进展与发展对策. 地球科学进展, 2019, 34(8): 814-825. https://www.cnki.com.cn/Article/CJFDTOTAL-DXJZ201908007.htmJin R H, Ma J, Ren H C, et al. Advances and development countermeasures of 10-30 days extended-range forecasting technology in China. Advances in Earth Science, 2019, 34(8): 814-825. https://www.cnki.com.cn/Article/CJFDTOTAL-DXJZ201908007.htm [23] 林爱兰, 谷德军, 彭冬冬, 等. 体现大尺度特征的区域持续性强降水过程定义指标. 热带气象学报, 2020, 36(3): 289-298. https://www.cnki.com.cn/Article/CJFDTOTAL-RDQX202003001.htmLin A L, Gu D J, Peng D D, et al. A definition index reflecting large-scale characteristics of regional persistent heavy rainfall events. Journal of Tropical Meteorology, 2020, 36(3): 289-298. https://www.cnki.com.cn/Article/CJFDTOTAL-RDQX202003001.htm [24] 孙建奇, 王会军, 袁薇. 我国极端高温事件的年代际变化及其与大气环流的联系. 气候与环境研究, 2011, 16(2): 199-208. doi: 10.3878/j.issn.1006-9585.2011.02.09Sun J Q, Wang H J, Yuan W. Decadal variability of the extreme hot event in China and its association with atmospheric circulations. Climatic and Environmental Research, 2011, 16(2): 199-208. doi: 10.3878/j.issn.1006-9585.2011.02.09 [25] 李纵横, 李崇银, 宋洁, 等. 1960~2011年江淮地区夏季极端高温日数的特征及成因分析. 气候与环境研究, 2015, 20(5): 511-522. https://www.cnki.com.cn/Article/CJFDTOTAL-QHYH201505003.htmLi Z H, Li C Y, Song J, et al. An analysis of the characteristics and causes of extremely high temperature days in the Yangtze-Huaihe River basins in summer 1960-2011. Climatic and Environmental Research, 2015, 20(5): 511-522. https://www.cnki.com.cn/Article/CJFDTOTAL-QHYH201505003.htm [26] 张嘉仪, 钱诚. 1960-2018年中国高温热浪的线性趋势分析方法与变化趋势. 气候与环境研究, 2020, 25(3): 225-239. https://www.cnki.com.cn/Article/CJFDTOTAL-QHYH202003001.htmZhang J Y, Qian C. Linear trends in occurrence of high temperature and heat waves in China for the 1960-2018 period: Method and analysis results. Climatic and Environmental Research, 2020, 25(3): 225-239. https://www.cnki.com.cn/Article/CJFDTOTAL-QHYH202003001.htm [27] 方宇凌, 夏冠聪, 朱舒曼, 等. 我国南方地区持续性高温气候特征分析. 气象研究与应用, 2013, 34(增刊1): 89-91. https://www.cnki.com.cn/Article/CJFDTOTAL-GXQX2013S1036.htmFang Y L, Xia G C, Zhu S M, et al. Climatic analysis of persistent high temperature in South China. Journal of Meteorological Research and Application, 2013, 34(Suppl Ⅰ): 89-91. https://www.cnki.com.cn/Article/CJFDTOTAL-GXQX2013S1036.htm [28] 王亚伟, 翟盘茂, 田华. 近40年南方高温变化特征与2003年的高温事件. 气象, 2006, 32(10): 27-33. https://www.cnki.com.cn/Article/CJFDTOTAL-QXXX200610003.htmWang Y W, Zhai P M, Tian H. Extreme high temperatures in southern China in 2003 under the background of climate change. Meteorological Monthly, 2006, 32(10): 27-33. https://www.cnki.com.cn/Article/CJFDTOTAL-QXXX200610003.htm [29] 任芝花, 张志富, 孙超, 等. 全国自动气象站实时观测资料三级质量控制系统研制. 气象, 2015, 41(10): 1268-1277. doi: 10.7519/j.issn.1000-0526.2015.10.010Ren Z H, Zhang Z F, Sun C. Development of three-step quality control system of real-time observation data from AWS in China. Meteorological Monthly, 2015, 41(10): 1268-1277. doi: 10.7519/j.issn.1000-0526.2015.10.010 [30] Xu W H, Li Q X, Wang X L, et al. Homogenization of Chinese daily surface air temperatures and analysis of trends in the extreme temperature indices. J Geophys Res Atmos, 2013, 118(17): 9708-9720. doi: 10.1002/jgrd.50791 [31] Davis R E. Predictability of sea-surface temperature and sea level pressure anomalies over the North Pacific Ocean. J Phys Oceanogr, 1976, 6(3): 249-266. doi: 10.1175/1520-0485(1976)006<0249:POSSTA>2.0.CO;2 [32] Chen W. Fluctuation in Northern Hemisphere 700 mb height field associated with Southern Oscillation. Mon Wea Rev, 1982, 110(7): 808-823. doi: 10.1175/1520-0493(1982)110<0808:FINHMH>2.0.CO;2 [33] 汪汇洁, 孙建华, 卫捷, 等. 近30年我国南方区域持续性暴雨过程的分类研究. 气候与环境研究, 2014, 19(6): 713-725. https://www.cnki.com.cn/Article/CJFDTOTAL-QHYH201406006.htmWang H J, Sun J H, Wei J, et al. Classification of persistent heavy rainfall events over southern China during recent 30 years. Climatic and Environmental Research, 2014, 19(6): 713-725. https://www.cnki.com.cn/Article/CJFDTOTAL-QHYH201406006.htm [34] 梁梅, 吴立广. 中国东部地区夏季极端高温的特征分析. 气象科学, 2015, 35(6): 701-709. https://www.cnki.com.cn/Article/CJFDTOTAL-QXKX201506005.htmLiang M, Wu L G. Analysis on features of summer extreme high temperature in eastern China. Journal of the Meteorological Sciences, 2015, 35(6): 701-709. https://www.cnki.com.cn/Article/CJFDTOTAL-QXKX201506005.htm [35] Ding T, Qian W, Yan Z. Changes in hot days and heat waves in China during 1961-2007. Int J Climatol, 2010, 30(10): 1452-1462. doi: 10.1002/joc.1989 [36] 祝从文, 刘伯奇, 左志燕, 等. 东亚夏季风次季节变化研究进展. 应用气象学报, 2019, 30(4): 401-415. doi: 10.11898/1001-7313.20190402Zhu C W, Liu B Q, Zuo Z Z, et al. Recent advances on sub-seasonal variability of East Asian summer monsoon. J Appl Meteor Sci, 2019, 30(4): 401-415. doi: 10.11898/1001-7313.20190402 [37] 彭艳玉, 刘煜, 缪育聪. 温室气体对亚洲夏季风影响的数值研究. 应用气象学报, 2021, 32(2): 245-256. doi: 10.11898/1001-7313.20210209Peng Y Y, Liu Y, Miao Y C. A numerical study on impacts of greenhouse gases on Asian summer monsoon. J Appl Meteor Sci, 2021, 32(2): 245-256. doi: 10.11898/1001-7313.20210209 [38] Ren G, Ding Y, Zhao Z, et al. Recent progress in studies of climate change in China. Adv Atmos Sci, 2012, 29(5): 958-977. doi: 10.1007/s00376-012-1200-2 [39] 王成刚, 魏夏潞, 严家德, 等. 气象探测环境等级评估方法及应用. 应用气象学报, 2019, 30(1): 117-128. doi: 10.11898/1001-7313.20190111Wang C, Wei X L, Yan J D, et al. Grade evaluation of detectioon environment of meterological stations in Beijing. J Appl Meteor Sci, 2019, 30(1): 117-128. doi: 10.11898/1001-7313.20190111 -

计量
- 摘要浏览量: 1810
- HTML全文浏览量: 655
- PDF下载量: 273
- 被引次数: 0
