
 设为首页
设为首页 加入收藏
加入收藏

Thunderstorm Feature Dataset and Characteristics of Thunderstorm Activities in China
-
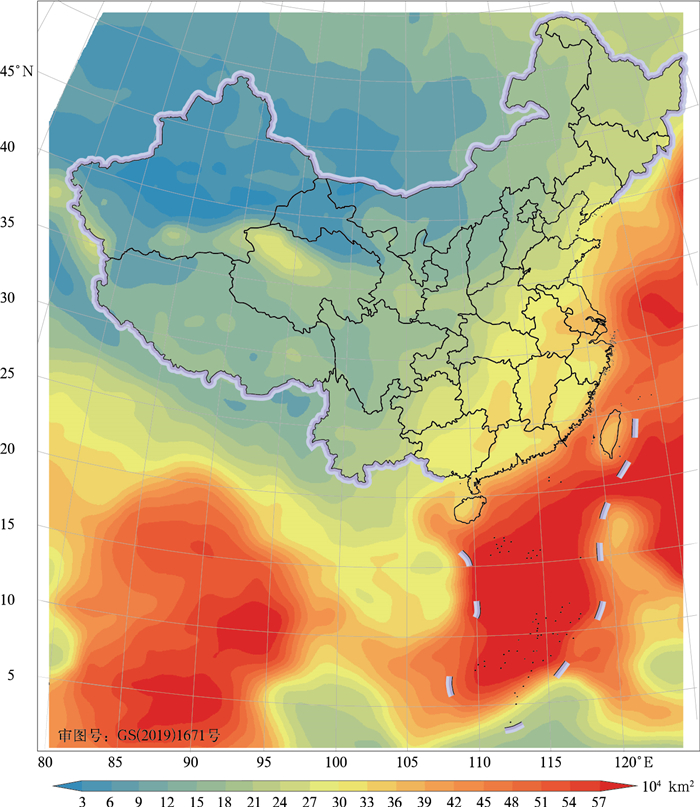
摘要: 基于FY-2E气象卫星相当黑体亮度温度(TBB)和云分类数据(CLC)及全球闪电探测网(WWLLN)闪电数据,通过对TBB不超过-32℃的云区进行椭圆拟合,定义1 h内上述云区或椭圆区域有WWLLN闪电发生的个例为雷暴云,获得雷暴云时间、位置、形态、结构、闪电活动等特征参量,构建雷暴云特征数据集,并基于该数据集初步分析了我国陆地和毗邻海域的雷暴活动特征。研究表明:我国华南、西南、青藏高原东、中部和南海雷暴最为活跃,华北和东北地区是北方雷暴活动较强的区域。雷暴活动时间变化海陆差异明显,陆地雷暴活动峰值出现在6—8月,南海雷暴活动一个峰值出现在5月左右,另一峰值出现在8月后,且纬度越低出现越晚。陆地大部分地区雷暴活动在14:00—20:00(北京时)达到峰值,毗邻海域雷暴活动峰值主要出现在早上。雷暴云TBB不超过-32℃面积符合对数正态分布,峰值区间位于1×10³~1×10⁴ km2,平均值为3.0×10⁴ km2。南海雷暴云面积最大,陆地上大于雷暴云面积平均值1.2×10⁵ km2的区域主要分布于我国地形的第一阶梯和柴达木盆地。Abstract: A thunderstorm feature dataset (TFD) is built up based on the black body temperature (TBB) product and cloud classification (CLC) product of FY-2E meteorological satellite as well as the lightning data of the World-Wide Lightning Location Network (WWLLN). In the TFD, thunderstorm cloud is determined when there is WWLLN lightning in the area with TBB not higher than -32℃ or its fitted ellipse. The characteristic parameters of thunderstorms including time, location, morphology, structure, and lightning activities are obtained to establish the TFD. Based on the dataset, thunderstorms in the land of China and the adjacent seas are analyzed after the quality control.The results show that South China, Southwest China, Eastern and Central of Tibetan Plateau and South China Sea are the areas with most frequent thunderstorm activities. North China and Northeast China are two areas with relatively frequent thunderstorm activities in the north part of China. Meanwhile, thunderstorm activity is the weakest in Northwest China.The seasonal variation of thunderstorm activity shows obvious differences between land and sea. The active stage of thunderstorms on land is from June to August. In high latitudes, the peak appears earlier. There is a peak of thunderstorm activity in the South China Sea around May, and another peak after August. The lower the latitude is, the later the second peak appears. The peak time of thunderstorm activity in diurnal variation in most parts of the land is from 1400 BT to 2000 BT and the peak of thunderstorm activity in adjacent sea areas mainly occurs in the morning. In the Sichuan Basin, thunderstorms are more frequent in the early morning. The diurnal variation of thunderstorm activity in the South China Sea is relatively weak.The area of thunderstorm cloud with TBB not higher than -32℃ follows a log-normal distribution, with the peak interval being 1×10³-1×10⁴ km2, and the average area is 3.0×10⁴ km2. The area of thunderstorm cloud over the sea is obviously larger than that of land, and the South China Sea has the largest area of thunderstorm clouds. On the land, the area of thunderstorm clouds in the east is larger than that in the west, and the average area of thunderstorm clouds greater than 1.2×10⁵ km2 can be predominantly found in the first step of Chinese topography. Meanwhile, there is a local center with an average area of thunderstorm clouds greater than 1.2×10⁵ km2 in the Qaidam Basin.
-
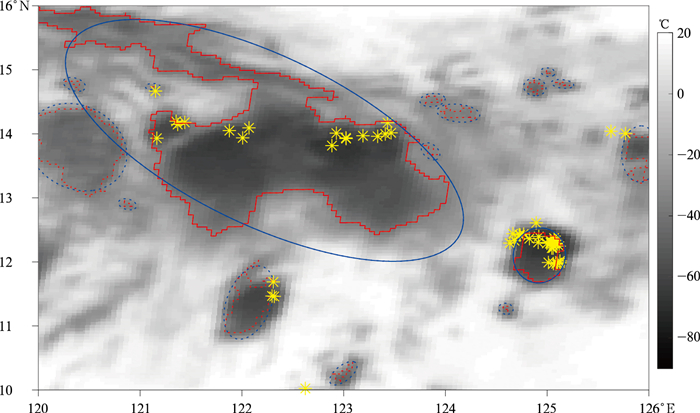
图 1 雷暴云区域识别示意图
(红线包围区域为TBB不超过-32℃的区域,蓝线表示针对上述区域的拟合椭圆,黄色*为叠加的1 h内WWLLN闪电;红色和蓝色实线表示雷暴云,红色和蓝色虚线表示非雷暴云)
Fig. 1 Schematic diagram of thunderstorm cloud area identification
(red lines enclose the areas with TBB not higher than-32℃, blue lines represent the fitted ellipses for these areas, and the yellow * marks superimposed one-hour WWLLN lightning flash;red and blue solid lines represent thunderstorms, and red and blue dashed lines represent non-thunderstorms)

图 2 2010—2018年不同闪电频次(F)和雷暴云面积(A)区间的样本量分布
Fig. 2 Sample number in lightning frequency(F) and thunderstorm cloud area(A)
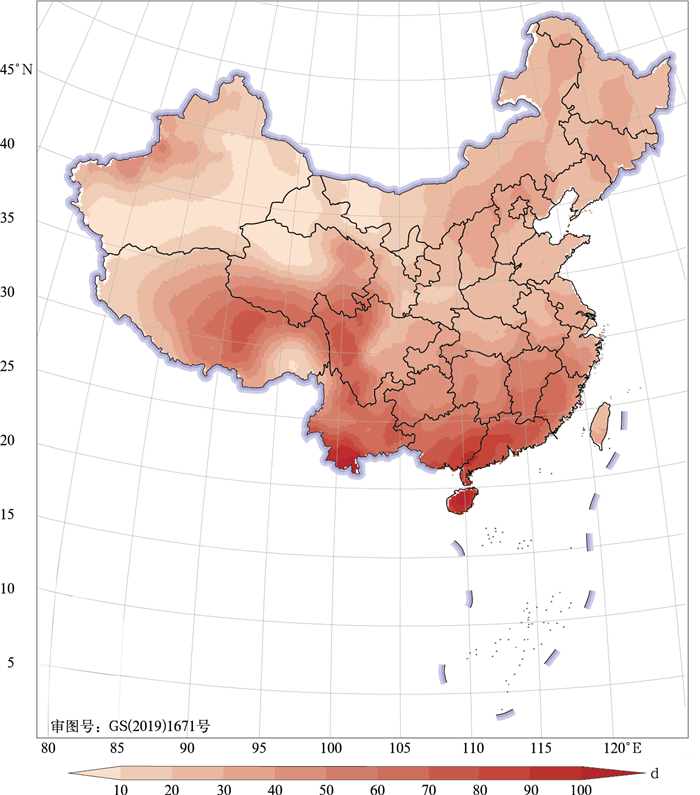
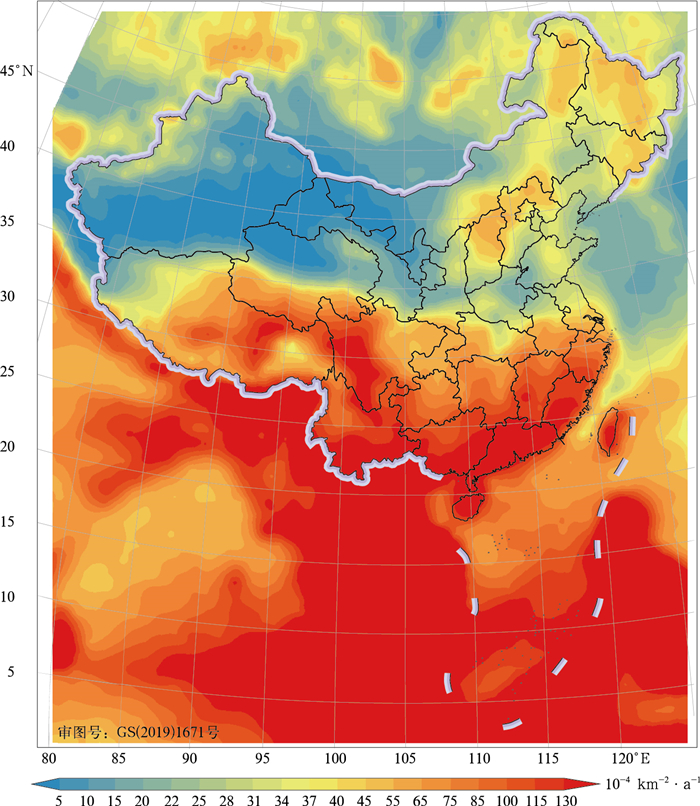
图 4 1961—2014年中国陆地年平均雷暴日数
Fig. 4 Annual thunderstorm days in land area of China during 1961-2014
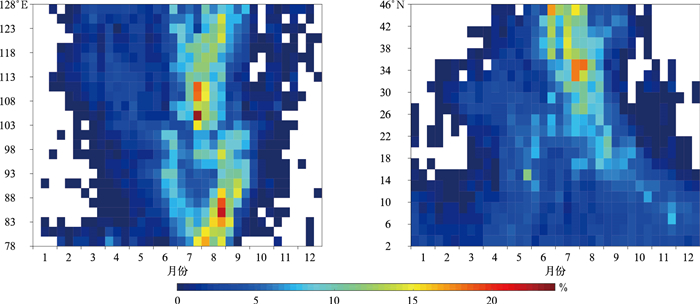
图 5 2010—2018年30°~32°N范围内和112°~114°E范围内雷暴小时数的逐旬占比
Fig. 5 Proportion of ten-day thunderstorm-hour along 30°-32°N and 112°-114°E during 2010-2018
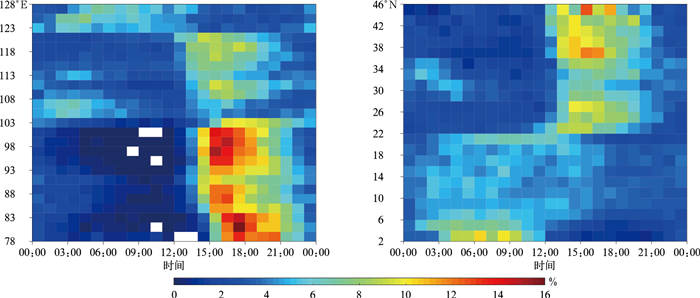
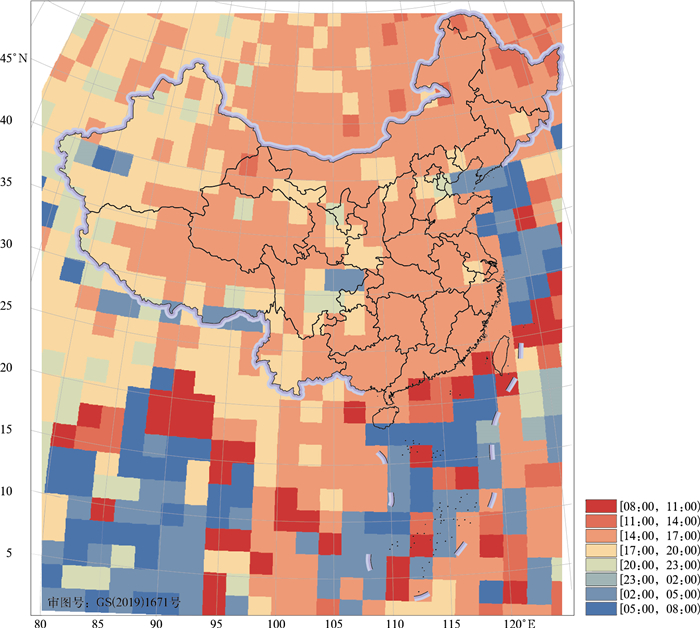
图 7 2010—2018年30°~32°N范围内和12°~114°E范围内雷暴小时数的逐时占比
Fig. 7 Proportion of thunderstorm-hour along 30°-32°N and 112°-114°E during 2010-2018
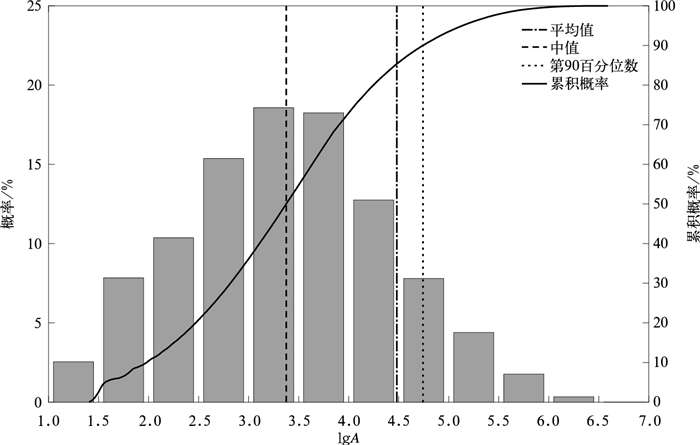
图 8 2010—2018年5—9月研究区域内雷暴云面积(A)的概率和累积概率分布
Fig. 8 Probability and cumulative probability distributions of thunderstorm cloud area(A) in the study area from May to Sep during 2010-2018
-
[1] Maddox R A.Mesoscale convective complexes.Bull Amer Meteor Soc,1980,61(11):1374-1400. doi: 10.1175/1520-0477(1980)061<1374:MCC>2.0.CO;2 [2] 马禹, 王旭, 陶祖钰. 中国及其邻近地区中尺度对流系统的普查和时空分布特征. 自然科学进展, 1997, 7(6): 701-706. doi: 10.3321/j.issn:1002-008X.1997.06.010Ma Y, Wang X, Tao Z Y. Census and spatio-temporal distribution characteristics of mesoscale convective systems in China and its adjacent areas. Progress in Natural Science, 1997, 7(6): 701-706. doi: 10.3321/j.issn:1002-008X.1997.06.010 [3] 郑永光, 陈炯, 朱佩君. 中国及周边地区夏季中尺度对流系统分布及其日变化特征. 科学通报, 2008, 53(4): 471-481. doi: 10.3321/j.issn:0023-074X.2008.04.015Zheng Y G, Chen J, Zhu P J. Distribution and diurnal variation of summer mesoscale convective system in China and its adjacent areas. Science Bulletin, 2008, 53(4): 471-481. doi: 10.3321/j.issn:0023-074X.2008.04.015 [4] 祁秀香, 郑永光. 2007年夏季我国深对流活动时空分布特征. 应用气象学报, 2009, 20(3): 286-294. doi: 10.3969/j.issn.1001-7313.2009.03.004Qi X X, Zheng Y G. Distribution and spatiotemporal variations of deep convection over China and its vicinity during the summer of 2007. J Appl Meteor Sci, 2009, 20(3): 286-294. doi: 10.3969/j.issn.1001-7313.2009.03.004 [5] 苏爱芳, 孙景兰, 谷秀杰, 等. 河南省对流性暴雨云系特征与概念模型. 应用气象学报, 2013, 24(2): 219-229. doi: 10.3969/j.issn.1001-7313.2013.02.010Su A F, Sun J L, Gu X J, et al. Characteristics and conceptual models of convective rainstorm clouds in Henan Province. J Appl Meteor Sci, 2013, 24(2): 219-229. doi: 10.3969/j.issn.1001-7313.2013.02.010 [6] Yang X, Fei J, Huang X, et al. Characteristics of mesoscale convective systems over China and its vicinity using geostationary satellite FY2. J Climate, 2015, 28(12): 4890-4907. doi: 10.1175/JCLI-D-14-00491.1 [7] Liu C, Zipser E J. Global distribution of convection penetrating the tropical tropopause. J Geophys Res, 2005, 110(23): 1-12. doi: 10.1029/2005JD006063/full [8] Houze R A, Wilton D C, Smull B F. Monsoon convection in the Himalayan region as seen by the TRMM Precipitation Radar. Quart J Roy Meteor Soc, 2007, 133: 1389-1411. http://ci.nii.ac.jp/naid/10025262410 [9] Romatschke U, Medina S, Houze R A. Regional, seasonal, and diurnal variations of extreme convection in the South Asian region. J Climate, 2010, 23(2): 419-439. doi: 10.1175/2009JCLI3140.1 [10] Wu X K, Qie X S, Yuan T. Regional distribution and diurnal variation of deep convective systems over the Asian monsoon region. Science China(Earth Sciences), 2013, 56(5): 843-854. doi: 10.1007/s11430-012-4551-8 [11] Qie X, Wu X, Yuan T, et al. Comprehensive pattern of deep convective systems over the Tibetan Plateau-South Asian monsoon region based on TRMM data. J Climate, 2014, 27(17): 6612-6626. doi: 10.1175/JCLI-D-14-00076.1 [12] 朱士超, 袁野, 吴月, 等. 江淮地区孤立对流云统计特征. 应用气象学报, 2019, 30(6): 690-699. doi: 10.11898/1001-7313.20190605Zhu S C, Yuan Y, Wu Y, et al. Statistical characteristics of isolated convection in the Jianghuai Region. J Appl Meteor Sci, 2019, 30(6): 690-699. doi: 10.11898/1001-7313.20190605 [13] Mezuman K, Price C, Galanti E. On the spatial and temporal distribution of global thunderstorm cells. Environ Res Lett, 2014, 9(12). DOI: 10.1088/1748-9326/9/12/124023. [14] Hutchins M L, Holzworth R H, Brundell J B. Diurnal variation of the global electric circuit from clustered thunderstorms. J Geophys Res(Space Physics), 2014, 119(1): 620-629. doi: 10.1002/2013JA019593/full [15] 周康辉, 郑永光, 蓝渝. 基于闪电数据的雷暴识别、追踪与外推方法. 应用气象学报, 2016, 27(2): 173-181. doi: 10.11898/1001-7313.20160205Zhou K H, Zheng Y G, Lan Y. Flash cell identification, tracking and nowcasting with lightning data. J Appl Meteor Sci, 2016, 27(2): 173-181. doi: 10.11898/1001-7313.20160205 [16] Liu C, Zipser E J, Cecil D J, et al. A cloud and precipitation feature database from nine years of TRMM observations. J Appl Meteor Climatol, 2008, 47(10): 2712-2728. doi: 10.1175/2008JAMC1890.1 [17] Zipser E J, Cecil D J, Liu C, et al. Where are the most: Intense thunderstorms on Earth?. Bull Amer Meteor Soc, 2006, 87(8): 1057-1071. doi: 10.1175/BAMS-87-8-1057 [18] Bang S D, Zipser E J. Differences in size spectra of electrified storms over land and ocean. Geophys Res Lett, 2015, 42: 6844-6851. doi: 10.1002/2015GL065264 [19] Bang S D, Zipser E J. Seeking reasons for the differences in size spectra of electrified storms over land and ocean. J Geophys Res, 2016, 121(15): 9048-9068. doi: 10.1002/2016JD025150 [20] 李进梁, 吴学珂, 袁铁, 等. 基于TRMM卫星多传感器资料揭示的亚洲季风区雷暴时空分布特征. 地球物理学报, 2019, 62(11): 4098-4109. doi: 10.6038/cjg2019M0687Li J L, Wu X K, Yuan T, et al. The temporal and spatial distribution of thunderstorms in Asia Monsoon region based on the TRMM multi-sensor database. Chinese J Geophys, 2019, 62(11): 4098-4109. doi: 10.6038/cjg2019M0687 [21] Dowden R L, Brunde J B, Rodger C J. VLF lightning location by time of group arrival (TOGA) at multiple sites. J Atmos Solar-Terr Phys, 2002, 64(7): 817-830. doi: 10.1016/S1364-6826(02)00085-8 [22] Dowden R L, Holzworth R H, Rodger C J, et al. World-wide lightning location using VLF propagation in the Earth-ionosphere waveguide. IEEE Antenn Propag M, 2008, 50(5): 40-60. doi: 10.1109/MAP.2008.4674710 [23] Hutchins M L, Holzworth R H, Brundell J B, et al. Relative detection efficiency of the World Wide Lightning Location Network. Radio Sci, 2012, 47(6): 1-9. http://ieeexplore.ieee.org/document/7776718 [24] Rudlosky S D, Shea D T. Evaluating WWLLN performance relative to TRMM/LIS. Geophys Res Lett, 2013, 40(10): 2344-2348. doi: 10.1002/grl.50428 [25] Bürgesser R E. Assessment of the World Wide Lightning Location Network (WWLLN) detection efficiency by comparison to the Lightning Imaging Sensor (LIS). Quarty J Roy Meteor Soc, 2017, 143(708): 2809-2817. doi: 10.1002/qj.3129 [26] Fan P, Zheng D, Zhang Y, et al. A Performance evaluation of the World Wide Lightning Location Network (WWLLN) over the Tibetan Plateau. J Atmos Ocean Technol, 2018, 35(4): 927-939. doi: 10.1175/JTECH-D-17-0144.1 [27] Boccippio D J, Koshak W J, Blakeslee R J. Performance assessment of the optical transient detector and lightning imaging sensor. Part Ⅰ: Predicted diurnal variability. J Atmos Ocean Technol, 2002, 19(9): 1318-1332. doi: 10.1175/1520-0426(2002)019<1318:PAOTOT>2.0.CO;2 [28] 费增坪, 王洪庆, 郑永光, 等. 基于静止卫星红外云图的MCS普查研究进展及标准修订. 应用气象学报, 2008, 19(1): 82-90. doi: 10.3969/j.issn.1001-7313.2008.01.011Fei Z P, Wang H Q, Zheng Y G, et al. MCS census and modification of MCS definition based on geostationary satellite infrared imagery. J Appl Meteor Sci, 2008, 19(1): 82-90. doi: 10.3969/j.issn.1001-7313.2008.01.011 [29] 曹治强, 王新. 与强对流相联系的云系特征和天气背景. 应用气象学报, 2013, 24(3): 365-372. doi: 10.3969/j.issn.1001-7313.2013.03.013Cao Z Q, Wang X. Cloud characteristics and synoptic background associated with severe convective storms. J Appl Meteor Sci, 2013, 24(3): 365-372. doi: 10.3969/j.issn.1001-7313.2013.03.013 [30] 王新, 郭强, 陈怡羽. FY-2E资料空间响应订正及对强对流监测改进. 应用气象学报, 2016, 27(1): 102-111. doi: 10.11898/1001-7313.20160111Wang X, Guo Q, Chen Y Y. Performance improvement for FY-2E convection monitoring using a spatial-response matched filter method. J Appl Meteor Sci, 201627(1): 102-111. doi: 10.11898/1001-7313.20160111 [31] 冯晋勤, 刘铭, 蔡菁. 闽西山区"7·22"极端降水过程中尺度对流特征. 应用气象学报, 2018, 29(6): 748-758. doi: 10.11898/1001-7313.20180610Feng J Q, Liu M, Cai J. Meso-scale convective characteristics of "7·22" extreme rain in the west mountainous area of Fujian. J Appl Meteor Sci, 2018, 29(6): 748-758. doi: 10.11898/1001-7313.20180610 [32] Thiel K C, Calhoun K M, Reinhart A E, et al. GLM and ABI characteristics of severe and convective storms. J Geophys Res Atmos, 2020, 125(17): 1-22. doi: 10.1029/2020JD032858 [33] 金霞. 四川盆地降水日变化特征分析及成因研究. 北京: 中国气象科学研究院, 2013.Jin X, Study of Diurnal Cycle of Precipitation over the Sichuan Basin: Characteristics and its Causes. Beijing: Chinese Academy of Meteorological Sciences, 2013. [34] 王黉, 李英, 宋丽莉, 等. 川藏地区雷暴大风活动特征和环境因子对比. 应用气象学报, 2020, 31(4): 435-446. doi: 10.11898/1001-7313.20200406Wang H, Li Y, Song L L, et al. Comparison of characteristics and environmental factors of thunderstorm gales over the Sichuan-Tibet Region. J Appl Meteor Sci, 2020, 31(4): 435-446. doi: 10.11898/1001-7313.20200406 -

 下载:
下载:
计量
- 摘要浏览量: 2626
- HTML全文浏览量: 335
- PDF下载量: 323
- 被引次数: 0
