
 设为首页
设为首页 加入收藏
加入收藏

Aircraft Measurements on Properties of Aerosols over the Central and Eastern Qinghai-Tibet Plateau
-
摘要: 利用2011年和2013年夏秋季在青藏高原中东部开展的11架次气溶胶特征飞机观测数据,分析气溶胶数浓度、数谱及核化相关特征。结果表明:受天气系统、地形和地表影响,观测区内气溶胶数浓度(Na)和体积直径(Dv)的垂直和水平分布差异较大,Na呈西北高、东南低,Dv低层大、高层小,局地中高层有沙尘。格尔木盛行东风时,云降水对低层气溶胶有清除作用,Na和Dv明显降低,6.2 km高度和7.2~7.4 km高度的中高空受高原大风或对流影响形成沙尘;盛行西风时,低层Dv以0.5~0.8 μm为主,随高度升高和风速增大Na升高,Dv变幅较小,6.2 km高度也有沙尘;不同天气系统影响下6.5 km高度以上均输入亚微米颗粒,Na达5×103 cm-3,8.0 km高度盛行东风时比西风时Na更高,Dv更小,谱垂直分布也有以上特征,整层输入以偏北或偏西路径为主。不同过饱和度测量云凝结核数浓度(Nccn)表明,除格尔木6.0 km高度以下核化率(Nccn/Na)在21%~47%外,其他观测区平均核化率介于1%~16%,6.0~8.5 km高度的核化率总体偏低;当Na增加时核化率明显下降,且过饱和度1%~2%,-15~-5℃层或粒径1~3 μm时的核化率相对偏高。Abstract: The central and eastern Qinghai-Tibet Plateau is the birthplace of the Yellow River, the Yangtze River and the Lancang River. It is also a climate change sensitive area and a key ecological protection area. Based on observations of 11 sorties conducted in summer and autumn of 2011 and 2013, the vertical distribution of aerosol number concentration and number spectrum at Golmud, and the transport characteristics as well as the horizontal distribution and nucleation characteristics of aerosol number concentration and cloud condensation nuclei (CCN) number concentration at mid-altitude of the central and eastern Plateau are analyzed. The results indicate that the vertical and horizontal distributions of aerosol number concentration (Na) and volume diameter (Dv) in the central and eastern Qinghai-Tibet Plateau are significantly different due to the influence of weather system, topography, and surface characteristics. The aerosol number concentration is high in the northwest and low in the southeast. The volume diameter is large in the lower layer, small in the upper layer, and there are dust layers in the middle and upper layers. Precipitation has clear effects on low-level aerosols when east wind prevails at Golmud, and the aerosol number concentration and volume diameter are significantly reduced. At the same time, due to plateau gale or convection, sand and dust layers also form at the middle and upper altitudes of 6.2 km and 7.2-7.4 km. The aerosol volume diameter of the lower layer is 1.8 μm mainly when westerly wind prevails, the number concentration increases with the increase of height and wind speed, the variation of aerosol volume diameter is small, and the sand and dust layer also appears at 6.2 km altitude. Under the influence of different weather systems over 6.5 km altitude, submicron particles are imported, and the number concentration even reaches 5×103 cm-3. Moreover, the aerosol number concentration and particle size imported at about 8.0 km altitude when east wind prevails are denser and smaller than those imported when west wind prevails, and the vertical distribution of spectrum also shows the same characteristics. The measurement of cloud condensation nuclei number concentration (Nccn) with different supersaturation shows that the mean nucleation rate is generally 1%-16%, except that the nucleation rate below 6 km altitude at Golmud is 21%-47%, and the nucleation rate at 6.0-8.5 km altitude is generally low. When the aerosol number concentration increases, the nucleation rate decreases significantly, and its value is relatively high with the supersaturation being 1%-2%, in the layer between -15 and -5℃ or the particle size of 1-3 μm.
-
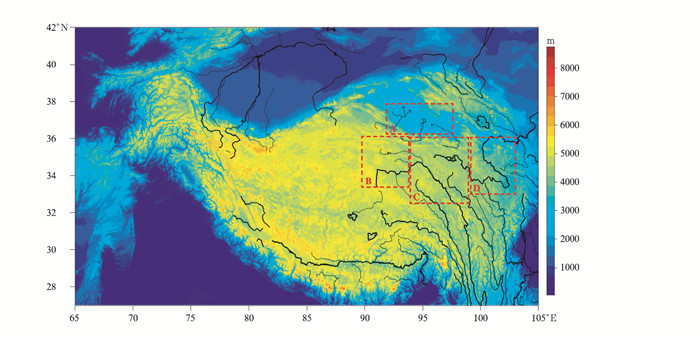
图 1 青藏高原中东部试验区及其飞行观测区
(黑实线为河流或湖泊,虚方框为试验区或飞行观测区,填色为地形高度)
Fig. 1 Test field and its flight measurement area in the central and eastern of Qinghai-Tibet Plateau
(black solid lines denote rivers or lakes, virtual boxs denote test fields or flight measurement areas, the shaded denotes the terrain elevation)
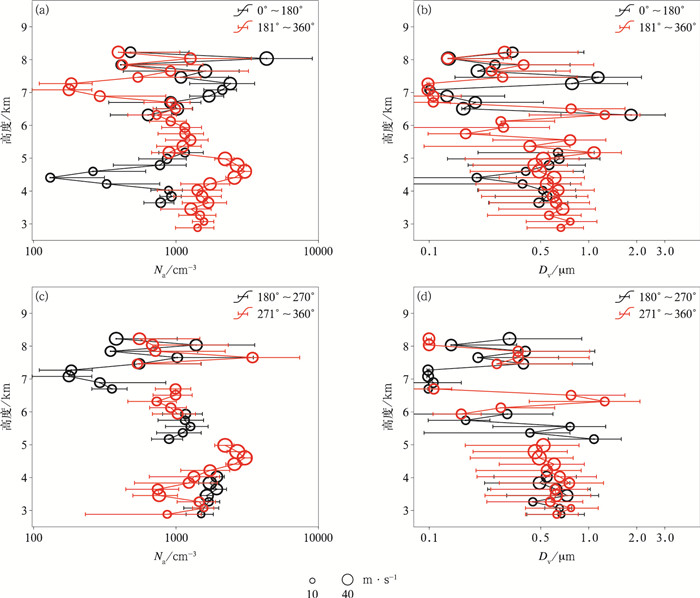
图 2 格尔木地区不同风向风速下气溶胶平均数浓度和体积直径随高度的垂直分布及偏差(圆圈大小表示风速大小,不同颜色的纵向线段表示风向范围内的平均数浓度或体积直径随高度变化,横向线段表示数浓度或体积直径的偏差)(a)盛行东风(0°~180°) 或西风(181°~360°) 时气溶胶平均数浓度垂直分布及偏差,(b)盛行东风(0°~180°) 或西风(181°~360°) 时气溶胶平均体积直径垂直分布及偏差,(c)盛行西南风(181°~270°) 或西北风(271°~360°) 时气溶胶平均数浓度垂直分布及偏差,(d)盛行西南风(181°~270°) 或西北风(271°~360°) 时气溶胶平均体积直径垂直分布及偏差
Fig. 2 Vertical distribution and deviation of aerosol mean concentration and volume diameter with height under different wind directions and speeds at Golmud(the circle size represents the wind speed, the longitudinal line segment with different colors represents the variation of average number concentration or volume diameter within the wind direction with height, the transverse line segment represents the deviation of number concentration or volume diameter)(a)vertical distribution and deviation of aerosol mean concentration in prevailing east wind (0°~180°) or west wind (181°~360°), (b)vertical distribution and deviation of aerosol mean volume diameter in prevailing east wind (0°~180°) or west wind (181°~360°), (c)vertical distribution and deviation of aerosol mean concentration in southwest wind (181°~270°) or northwest wind (271°~360°), (d)vertical distribution and deviation of aerosol mean volume diameter in southwest wind (181°~270°) or northwest wind (271°~360°)
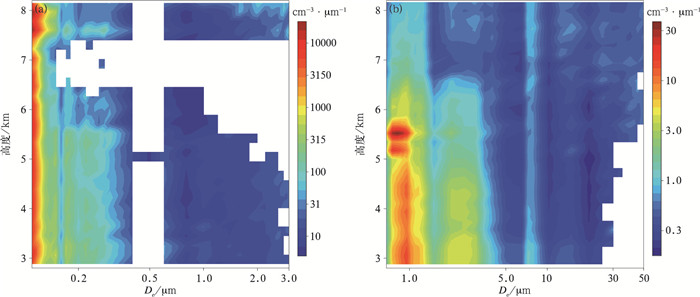
图 3 格尔木地区气溶胶平均谱垂直分布特征(a)PCASP-100X测量粒径为0.1~3.0 μm的气溶胶,(b)CAS前向散射测量粒径为0.6~50 μm的气溶胶
Fig. 3 Vertical distribution characteristics of aerosol mean spectrum at Golmud (a)0.1-3.0 μm measured by PCASP-100X, (b)0.6-50 μm measured by CAS forward scattering
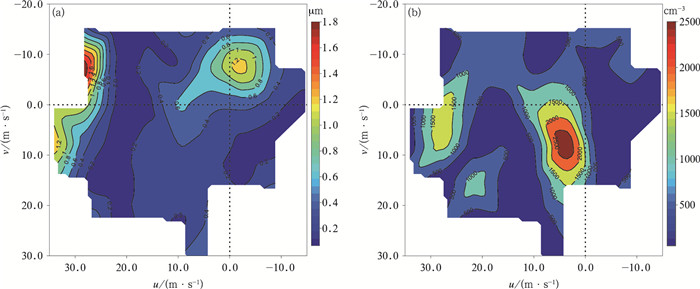
图 4 格尔木地区的气溶胶粒子平均有效直径(De)(a) 和平均数浓度(Na)(b)与风向风速的关系
Fig. 4 Distribution of aerosol mean effective diameter(De)(a) and mean number concentration(Na)(b) under different wind directions and speeds at Golmud
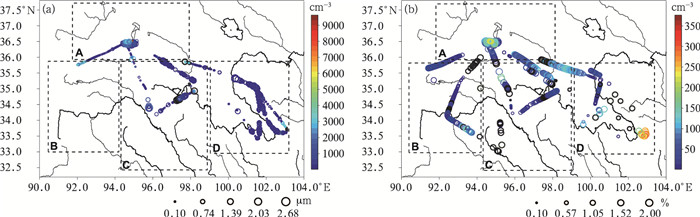
图 5 试验区航线上不同粒径的气溶胶数浓度(a)和不同过饱和度状态下观测的CCN数浓度(b)
(图 5a中圆圈为气溶胶有效直径,色标为气溶胶数浓度;图 5b中圆圈为过饱和度,色标为CCN数浓度)
Fig. 5 Aerosol number concentration distribution with different effective diameter(a) and CCN number concentration distribution measured under different supersaturation conditions(b) on the flight lines of the test field
(the circle size in Fig. 5a is the effective diameter of aerosol, the color code denotes aerosol number concentration;the circle size in Fig. 5b denotes supersaturation, the color code denotes CCN number concentration)
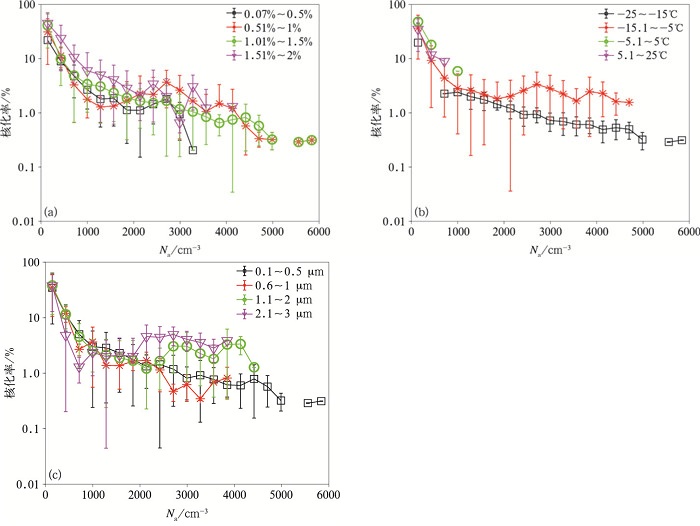
图 6 不同过饱和度状态(a)、不同温度层(b)以及不同粒径(c)条件下气溶胶数浓度与核化率关系
Fig. 6 Relationship between aerosol number concentration and nucleation rate under different supersaturation states(a), different temperature layer(b) and different effective diameter(c)
表 1 青藏高原中东部4个观测区特征
Table 1 Characteristics of four measurement areas in the central and eastern Qinghai-Tibet Plateau
观测区 地形平均高度/km 飞行观测垂直范围/km 人类活动特征 地表特征 夏秋季气流特征 格尔木地区(A区) 2.9 2.8~8.5 盐湖、城镇、交通 盐碱、沙漠等 西或西北干冷空气 长江源区(B区) 5.0 7.0~9.0 无人区、交通 草场、覆雪或岩石 西南或西风气流 三江共源区(C区) 4.7 7.0~9.0 城镇、放牧、交通 草场、湿地、湖泊 西南暖湿气流 黄河上游河曲地区(D区) 3.7 7.0~9.0 城镇、放牧、交通 草场、山脉、湿地 西南或偏南暖湿气流  下载: 导出CSV
表 2 飞行观测试验及天气系统气象要素观测概况
Table 2 Overview of aircraft measurement experiments and weather conditions
观测日期 观测时段 观测区 天气系统 Renold数 垂直观测范围/km 垂直观测温度范围/℃ 零度层位置/km 2011-07-27 11:50—16:52 A, C 高压 5180~7781 4.4~8.4 -16~2 4.8 2011-08-02 10:33—13:54 A, D 低涡 5179~5814 7.5~8.0 -18~-12 2011-08-15 11:34—17:17 A, B, C 槽底 5357~5940 2.8~8.5 -13~18 4.9 2011-08-20 12:29—19:22 A, B, C 西风 5097~5874 2.8~8.3 -16~23 5.1 2011-09-16 09:33—16:55 A, D 槽后 5180~7174 3.4~7.9 -20~9 4.7 2011-09-19 10:47—13:25 A, B 槽底 4707~8201 4.7~8.2 -18~1 4.8 2013-09-01 11:15—17:08 A, C 槽后 4556~5595 2.8~8.3 -18~22 4.9 2013-09-04 10:11—18:35 A, C, D 槽底 4558~5470 4.2~8.2 -21~1 4.4 2013-09-06 10:40—19:32 A, C, D 低涡 4640~5354 2.8~8.2 -23~14 4.6 2013-09-23 09:58—16:19 A, C, D 槽底 4582~5518 2.8~8.2 -28~12 4.2 2013-09-25 10:41—17:30 A, C, D 槽底 4950~5460 2.8~8.2 -24~16 4.6
下载: 导出CSV
表 3 青藏高原中东部各飞行观测区的气溶胶和CCN统计特征
Table 3 Statistical characteristics of aerosol and CCN in each flight measurement field over the central and eastern Qinghai-Tibet Plateau
观测区 Na/cm-3 De/μm Nccn/cm-3 核化率/% 0.07%~0.3% 0.3%~0.8% 0.8%~2.0% 格尔木地区 不高于6 km 634 0.37 138 146 304 21~47 高于6 km 2226 0.11 86 182 50 2~8 长江源区 1453 0.107 82 102 35 2~7 三江共源区 695 0.369 59 10 93 1~13 黄河上游河曲地区 467 0.237 20 48 79 4~16 青藏高原中东部 1488 0.232 47 128 147 3~10
下载: 导出CSV
-
[1] Haywood J, Boucher O.Estimates of the direct and indirect radiative forcing due to tropospheric aerosols:A review. Reviews of Geophysics, 2000, 38(4):513-543. doi: 10.1029/1999RG000078 [2] Hanna E. Radiative Forcing of Climate Change: Expanding the Concept and Addressing Uncertainties. Washington DC: National Academies Press, 2005. [3] 曲维政, 刘应辰, 黄菲, 等. 平流层火山气溶胶时空传播规律及其气候效应. 应用气象学报, 2010, 21(5): 627-631. http://qikan.camscma.cn/article/id/20100513Qu W Z, Liu Y C, Huang F, et al. The space-time propagation patterns of the stratospheric volcanic aerosols and the preliminary analysisi of their climate effect. J Appl Meteor Sci, 2010, 21(5): 627-631. http://qikan.camscma.cn/article/id/20100513 [4] 宋刘明, 刘煜, 朱彬, 等. 对流层气溶胶的直接气候效应对平流层的影响. 应用气象学报, 2014, 25(1): 83-94. http://qikan.camscma.cn/article/id/20140109Song L M, Liu Y, Zhu B, et al. Direct effects of tropospheric aerosols on stratospheric climate. J Appl Meteor Sci, 2014, 25(1): 83-94. http://qikan.camscma.cn/article/id/20140109 [5] Bates T S, Coffman D J, Covert D S, et al. Regional marine boundary layer aerosol size distributions in the Indian, Atlantic, and Pacific Oceans: A comparison of INDOEX measurements with ACE-1, ACE-2, and Aerosols99. J Geophys Res Atmos, 2002, 107(19): INX225-1-INX225-15. http://saga.pmel.noaa.gov/sites/default/files/atoms/files/bates_etal_2002.pdf [6] 卢广献, 郭学良. 环北京春季大气气溶胶分布、来源及其与CCN转化关系的飞机试验. 科学通报, 2012, 57(15): 1334-1344. https://www.cnki.com.cn/Article/CJFDTOTAL-KXTB201215008.htmLu G X, Guo X L. Distribution and origin of aerosol and its transform relationship with CCN derived from the spring multi-aircraft measurements of Beijing Cloud Experimenr(BCE). Chin Sci Bull, 2012, 57(15): 1334-1344. https://www.cnki.com.cn/Article/CJFDTOTAL-KXTB201215008.htm [7] 王维佳, 郭学良, 李宏宇, 等. 基于飞机观测的四川盆地初夏云下气溶胶特征. 干旱气象, 2018, 36(2): 167-175.Wang W J, Guo X L, Li H Y, et al. Aerosol characteristic beneath the clouds base on airborne observation in early summer over Sichuan Basin. Journal of Arid Meteorology, 2018, 36(2): 167-175. [8] 郭丽君, 郭学良, 方春刚, 等. 华北一次持续性重度雾霾天气的产生、演变与转化特征观测分析. 中国科学(地球科学), 2015, 45(4): 427-443. https://www.cnki.com.cn/Article/CJFDTOTAL-JDXK201504005.htmGuo L J, Guo X L, Fang C G, et al. Observation analysis on characteristics of formation, evolution and transition of a long-lasting severe fog and haze episode in North China. Science China(Earth Sciences), 2015, 45(4): 427-443. https://www.cnki.com.cn/Article/CJFDTOTAL-JDXK201504005.htm [9] 孙业乐. 城市边界层理化结构与大气污染形成机制研究进展. 科学通报, 2018, 63(14): 1374-1389.Sun Y L. Vertical structures of physical and chemical properties of urban boundary layer and formation mechanisms of atmospheric pollution. Chin Sci Bull, 2018, 63(14): 1374-1389. [10] 封秋娟, 牛生杰, 李培仁, 等. 山西夏季气溶胶散射特征的飞机观测研究. 气候与环境研究, 2019, 24(4): 482-492. https://www.cnki.com.cn/Article/CJFDTOTAL-QHYH201904007.htmFeng Q J, Niu S J, Li P R, et al. Aircraft measurement of the scattering Properties of aerosol in Shanxi Province in summer. Climatic and Environmental Research, 2019, 24(4): 482-492. https://www.cnki.com.cn/Article/CJFDTOTAL-QHYH201904007.htm [11] 黄嘉仪, 赵德龙, 陈宝君, 等. 基于飞机观测的北京地区气溶胶特征. 中国环境科学, 2021, 41(5): 2073-2080. doi: 10.3969/j.issn.1000-6923.2021.05.010Huang J Y, Zhao D L, Chen B J, et al. Aircraft observation of aerosol properties in Beijing. China Environmental Science, 2021, 41(5): 2073-2080. doi: 10.3969/j.issn.1000-6923.2021.05.010 [12] 马肖琳, 高西宁, 刘煜, 等. 气溶胶对东亚冬季风影响的数值模拟. 应用气象学报, 2018, 29(3): 333-343. doi: 10.11898/1001-7313.20180307Ma X L, Gao X N, Liu Y, et al. Simulations of aerosol influences on the East Asian winter monsoon. J Appl Meteor Sci, 2018, 29(3): 333-343. doi: 10.11898/1001-7313.20180307 [13] 李德平, 程兴宏, 孙治安, 等. 北京不同区域气溶胶辐射效应. 应用气象学报, 2018, 29(5): 609-618. doi: 10.11898/1001-7313.20180509Li D P, Cheng X H, Sun Z A, et al. Radiative effects of aerosols in different area of Beijing. J Appl Meteor Sci, 2018, 29(5): 609-618. doi: 10.11898/1001-7313.20180509 [14] 张霖逸, 颜鹏, 毛节泰, 等. 气溶胶散射相函数的单站观测研究. 应用气象学报, 2017, 28(4): 436-446. doi: 10.11898/1001-7313.20170405Zhang L Y, Yan P, Mao J T, et al. Observational study on aerosol scattering phase function at Raoyang of Hebei, China. J Appl Meteor Sci, 2017, 28(4): 436-446. doi: 10.11898/1001-7313.20170405 [15] 矫健, 贾小芳, 颜鹏, 等. 2016-2017年中国中东部本底地区PM10化学特性. 应用气象学报, 2021, 32(1): 65-77. doi: 10.11898/1001-7313.20210106Jiao J, Jia X F, Yan P, et al. Chemical characteristics of PM10 at background stations of central and eastern China in 2016-2017. J Appl Meteor Sci, 2021, 32(1): 65-77. doi: 10.11898/1001-7313.20210106 [16] 陆春松, 薛宇琦, 朱磊, 等. 基于层积云飞机观测资料评估气溶胶间接效应. 大气科学学报, 2021, 44(2): 279-289.Lu C S, Xue Y Q, Zhu L, et al. Evaluation of aerosol indirect effect based on aircraft observations of stratocumulus. Trans Atmos Sci, 2021, 44(2): 279-289. [17] 彭艳玉, 刘煜, 缪育聪. 温室气体对亚洲夏季风影响的数值研究. 应用气象学报, 2021, 32(2): 245-256. doi: 10.11898/1001-7313.20210209Peng Y Y, Liu Y, Miao Y C. A numerical study on impacts of greenhouse gases on Asian summer monsoon. J Appl Meteor Sci, 2021, 32(2): 245-256. doi: 10.11898/1001-7313.20210209 [18] 杨怡曼, 周毓荃, 蔡兆鑫. 气溶胶垂直分布及活化特性的飞机观测个例研究. 气象, 2020, 46(9): 1199-1209. https://www.cnki.com.cn/Article/CJFDTOTAL-QXXX202009007.htmYang Y M, Zhou Y Q, Cai Z X. A case study of aircraft observation of aerosol vertical distribution and activation characteristics. Meteor Mon, 2020, 46(9): 1199-1209. https://www.cnki.com.cn/Article/CJFDTOTAL-QXXX202009007.htm [19] Yao T, Thompson L G, Mosbrugger V, et al. Third pole environment(TPE). Environ Dev, 2012, 3: 52-64. doi: 10.1016/j.envdev.2012.04.002 [20] 陈德亮, 徐柏青, 姚檀栋, 等. 青藏高原环境变化科学评估: 过去、现在与未来. 科学通报, 2015, 60(32): 3025-3035.Chen D L, Xu B Q, Yao T D, et al. Assessment of past, present and future environmental changes on the Tibetan Plateau. Chin Sci Bull, 2015, 60(32): 3025-3035. [21] 孙鸿烈, 郑度, 姚檀栋, 等. 青藏高原国家生态安全屏障保护与建设. 地理学报, 2012, 67(1): 3-12. https://www.cnki.com.cn/Article/CJFDTOTAL-DLXB201201003.htmSun H L, Zheng D, Yao T D, et al. Protection and construction of the national ecological security shelter zone on Tibetan Plateau. Acta Geogr Sinica, 2012, 67(1): 3-12. https://www.cnki.com.cn/Article/CJFDTOTAL-DLXB201201003.htm [22] 陈馨, 匡文慧. 1990~2015年青藏高原生态系统变化特征分析. 西南民族大学学报(自然科学版), 2019, 45(3): 233-242. https://www.cnki.com.cn/Article/CJFDTOTAL-XNMZ201903003.htmChen X, Kuang W H. Analysis of the characteristics of ecosystem changes on the Qinghai-Tibet plateau from 1990 to 2015. Journal of Southwest Minzu University(Nat Sci Ed), 2019, 45(3): 233-242. https://www.cnki.com.cn/Article/CJFDTOTAL-XNMZ201903003.htm [23] 李娴茹. 全球变暖背景下青藏高原气温和降水的气候变化特征. 地球科学前沿, 2019, 9(11): 1042-1049.Li X R. Characteristics of temperature and precipitation change on the Tibet Plateau under the background of global warming. Advances in Geosciences, 2019, 9(11): 1042-1049. [24] 李岩, 干珠扎布, 胡国铮, 等. 增温对青藏高原高寒草原生态系统碳交换的影响. 生态学报, 2019, 39(6): 2004-2012.Li Y, Hasbagan Ganjurjav, Hu G Z, et al. Effects of warming on carbon exchange in an alpine steppe in the Tibetan Plateau. Acta Ecologica Sinica, 2019, 39(6): 2004-2012. [25] 李韧, 季国良. 藏北高原五道梁地区的气溶胶特征. 高原气象, 2004, 23(4): 501-505. doi: 10.3321/j.issn:1000-0534.2004.04.013Li R, Ji G L. Aerosol Features over northern Tibetan Plateau. Plateau Meteorology, 2004, 23(4): 501-505. doi: 10.3321/j.issn:1000-0534.2004.04.013 [26] 殷秀峰, 康世昌, 张强弓, 等. 青藏高原内陆大气污染物科学研究——以纳木错站为例. 自然杂志, 2020, 42(5): 373-378. doi: 10.3969/j.issn.0253-9608.2020.05.003Yin X F, Kang S C, Zhang Q G, et al. Study of air pollutants in the inland Tibetan Plateau(Nam Co Station). Chinese Journal of Nature, 2020, 42(5): 373-378. doi: 10.3969/j.issn.0253-9608.2020.05.003 [27] 吴浩, 许潇锋, 杨晓玥, 等. 青藏高原及周边区域沙尘气溶胶三维分布和传输特征. 环境科学学报, 2020, 40(11): 273-283.Wu H, Xu X F, Yang X Y, et al. Three-dimensional distribution and transport characteristics of dust over Tibetan Plateau and surrounding areas. Acta Scientiae Circumstantiae, 2020, 40(11): 273-283. [28] 余光明, 徐建中, 任贾文. 青藏高原大气气溶胶研究进展. 冰川冻土, 2012, 34(3): 609-617.Yu G M, Xu J Z, Ren J W. The progress of aerosol research in the Tibetan Plateau. Journal of Glaciology and Geocryology, 2012, 34(3): 609-617. [29] 唐信英, 罗磊, 金之川. 青藏高原大气气溶胶研究进展. 高原山地气象研究, 2012, 32(2): 95-99. doi: 10.3969/j.issn.1674-2184.2012.02.019Tang X Y, Luo L, Jin Z C. Development of study on atmospheric aerosol in Tibetan Plateau. Plateau and Mountain Meteorology Research, 2012, 32(2): 95-99. doi: 10.3969/j.issn.1674-2184.2012.02.019 [30] 康世昌, 丛志远, 王小萍, 等. 大气污染物跨境传输及其对青藏高原环境影响. 科学通报, 2019, 64(27): 2876-2884. https://www.cnki.com.cn/Article/CJFDTOTAL-KXTB201927013.htmKang S C, Cong Z Y, Wang X P, et al. The transboundary transport of air pollutants and their environmental impacts on Tibetan Plateau. Chin Sci Bull, 2019, 64(27): 2876-2884. https://www.cnki.com.cn/Article/CJFDTOTAL-KXTB201927013.htm [31] Xu B Q, Cao J J, James H S, et al. Black soot and the survival of Tibetan glaciers. Proceedings of the National Academy of Sciences, 2009, 106(52): 22114-22118. doi: 10.1073/pnas.0910444106 [32] Liu J, Song X, Fu G, et al. Precipitation isotope characteristics and climatic controls at a continental and an island site in Northeast Asia. Climate Research, 2011, 49(1): 29-44. doi: 10.3354/cr01013 [33] 高玲, 张里阳, 李俊, 等. 利用AVHRR数据反演陆地气溶胶光学厚度. 应用气象学报, 2014, 25(1): 42-51. http://qikan.camscma.cn/article/id/20140105Gao L, Zhang L Y, Li J, et al. Retrieval of atmospheric aerosol optical depth over land from AVHRR. J Appl Meteor Sci, 2014, 25(1): 42-51. http://qikan.camscma.cn/article/id/20140105 [34] 段婧, 楼小凤, 陈勇, 等. 基于航测的珠三角气溶胶垂直分布及活化特性. 应用气象学报, 2019, 30(6): 677-689. doi: 10.11898/1001-7313.20190604Duan J, Lou X F, Chen Y, et al. Aircraft measurement of aerosol vertical distributions and its activation efficiency over the Pearl River Delta. J Appl Meteor Sci, 2019, 30(6): 677-689. doi: 10.11898/1001-7313.20190604 [35] 靳军莉, 颜鹏, 马志强, 等. 北京及周边地区2013年1-3月PM2.5变化特征. 应用气象学报, 2014, 25(6): 690-700. http://qikan.camscma.cn/article/id/20140605Jin J L, Yan P, Ma Z Q, et al. Characteristics of PM2.5 in Beijing and surrounding areas from January to March in 2013. J Appl Meteor Sci, 2014, 25(6): 690-700. http://qikan.camscma.cn/article/id/20140605 [36] 徐晓斌. 我国霾和光化学污染观测研究进展. 应用气象学报, 2016, 27(5): 604-619. doi: 10.11898/1001-7313.20160509Xu X B. Observational study advances of haze and photochemical pollution in China. J Appl Meteor Sci, 2016, 27(5): 604-619. doi: 10.11898/1001-7313.20160509 [37] 周任君, 陈月娟, 毕云, 等. 青藏高原上空气溶胶含量的分布特征及其与臭氧的关系. 高原气象, 2008, 27(3): 500-508. https://www.cnki.com.cn/Article/CJFDTOTAL-GYQX200803004.htmZhou R J, Chen Y J, Bi Y, et al. Aerosol distribution over the Qinghai-Tibetan Plateau and its relationship with ozone. Plateau Meteorology, 2008, 27(3): 500-508. https://www.cnki.com.cn/Article/CJFDTOTAL-GYQX200803004.htm [38] 李维亮, 于胜民. 青藏高原地区气溶胶的时空分布特征及其辐射强迫和气候效应的数值模拟. 中国科学(地球科学), 2001, 31(增刊Ⅰ): 300-307. https://www.cnki.com.cn/Article/CJFDTOTAL-JDXK2001S1045.htmLi W L, Yu S M. The spatial and temporal distribution of aerosols over the Tibetan Plateau and the numerical simulation of their radiative forcing and climatic effects. Chinese Science(Geosciences), 2001, 31(Suppl Ⅰ): 300-307. https://www.cnki.com.cn/Article/CJFDTOTAL-JDXK2001S1045.htm [39] 陈舒慧, 傅帅, 庄犁. 青藏高原气溶胶时空分布特征. 环保科技, 2016, 22(5): 26-29. doi: 10.3969/j.issn.1674-0254.2016.05.007Chen S H, Fu S, Zhuang L. Temporal and spatial distribution characteristics of atmospheric aerosols in the Tibetan Plateau. Environmental Protection and Technology, 2016, 22(5): 26-29. doi: 10.3969/j.issn.1674-0254.2016.05.007 [40] Lüthi Z, Škerlak B, Kim S, et al. Atmospheric brown clouds reach the Tibetan Plateau by crossing the Himalayas. Atmos Chem Phys, 2015(15): 1-15. http://publications.iass-potsdam.de/pubman/item/escidoc:948894:11/component/escidoc:1174888/948894_supplement.pdf [41] 杨东贞, 于晓岚, 房秀梅, 等. 区域站和基准站气溶胶的分析. 应用气象学报, 1996, 7(4): 396-405. http://qikan.camscma.cn/article/id/19960462Yang D Z, Yu X L, Fang X M, et al. A study of aerosol at regional backgroud station and baseline station. J Appl Meteor Sci, 1996, 7(4): 396-405. http://qikan.camscma.cn/article/id/19960462 [42] 柳海燕, 张小曳, 沈志宝. 五道梁大气气溶胶的化学组成和浓度及其季节变化. 高原气象, 1997, 16(2): 11-18. https://www.cnki.com.cn/Article/CJFDTOTAL-GYQX702.001.htmLiu H Y, Zhang X Y, Shen Z B. The chemical composition and concentration of atomspheric aerosol at Wudaoliang and its seasonal variation. Plateau Meteorology, 1997, 16(2): 11-18. https://www.cnki.com.cn/Article/CJFDTOTAL-GYQX702.001.htm [43] Lee H N, Tositti L, Zheng X, et al. Analyses and comparisons of variations of 7Be, 210Pb, and 7Be/210Pb with ozone observations at two Global Atmosphere Watch stations from high mountains. John Wiley & Sons, Ltd, 2007, 112(D5): D05303. doi: 10.1029/2006JD007421/full [44] 杨龙元, 王明星, 吕国涛, 等. 青藏高原北部大陆气溶胶本底值特征的初步观测研究. 高原气象, 1994, 13(2): 135-143. https://www.cnki.com.cn/Article/CJFDTOTAL-GYQX402.003.htmYang L Y, Wang M X, Lu G T, et al. The observation and research for the continental aerosol background characteristic in the northern part of the Qinghai-Tibetan Plateau. Plateau Meteorology, 1994, 13(2): 135-143. https://www.cnki.com.cn/Article/CJFDTOTAL-GYQX402.003.htm [45] 马学谦, 贺敬安. 螺旋桨飞机安装云降水物理观测设备位置分析. 青海气象, 2011, 1(3): 80-85.Ma X Q, He J A. Location analysis of cloud and precipitation physical observation equipment installed on propeller aircraft. Qinghai Meteorology, 2011, 1(3): 80-85. [46] Baumgardner D. An Analysis and comparison of five water droplet measuring instruments. Journal of Applied Meteorology, 2010, 22(5): 891-910. [47] Rangno A L, Hobbs P V. Microstructures and precipitation development in cumulus and small cumulonimbus clouds over the warm pool of the tropical Pacifific Ocean. Q J R Meteorol Soc, 2010, 131(606): 639-673. http://www.onacademic.com/detail/journal_1000034849616510_8817.html [48] Zhang Q, Quan J, Tie X, et al. Impact of aerosol particles on cloud formation: Aircraft measurements in China. Atmospheric Environment, 2011, 45(3): 665-672. doi: 10.1016/j.atmosenv.2010.10.025 -

计量
- 摘要浏览量: 1200
- HTML全文浏览量: 305
- PDF下载量: 112
- 被引次数: 0
