
 设为首页
设为首页 加入收藏
加入收藏

Fitting of Wind Shear Index in the Boundary Layer of Landfalling Typhoons Based on High Tower Observation
-
摘要: 利用深圳气象梯度观测塔观测数据, 以2017年以来进入深圳150 km范围的7个台风个例为研究对象, 基于幂指数律拟合讨论台风边界层风切变指数的变化规律。结果表明:幂指数能较好地拟合台风影响下350 m高度以下风廓线, 随着拟合高度范围增加, 风切变指数增大, 拟合精度基本维持;用深圳气象梯度观测塔等差层数据拟合台风风速效果好于全层次数据和等比层数据拟合;7个台风影响期间拟合风切变指数平均值为0.268, 明显高于以往研究(0.1~0.177), 主要原因是拟合的高度范围较以往研究明显增大, 此外还与强风样本较少以及下垫面更粗糙有关。利用幂函数拟合台风不同风速段最大风切变指数, 可在台风过程中预估不同高度极端大风风险。研究还表明:台风眼经过铁塔前后风切变指数明显升高, 在抗风设计以及台风防御过程中应充分考虑这一变化。Abstract: The characteristics of wind speed variations with height in the boundary layer (especially in the near-ground layer) are crucial for the design of wind resistance coefficients of high buildings. The coast of South China is frequently impacted by typhoons, but the study of wind variation characteristics above 100 m within the typhoon boundary layer is insufficient due to the lack of direct observations. The 356 m Meteorological Gradient Observation Tower of Shenzhen can make up for data shortage, and 7 typhoons that affected Shenzhen since 2017(Typhoons Merbok, Roke, Hato, Pakhar, Mangkhut, Higos, and Lupit) are analyzed to study the variation of wind shear index based on the power exponential law. It shows the power index can well fit the wind profile below 350 m under the influence of typhoons, the wind shear index α increases with height, and the fitting accuracy is basically stable. The wind profile of the typhoon boundary layer is fitted with the wind speed data from the tower, the fitting accuracy differs for different combinations of levels, and the equal difference scheme leads to the best fitting results. For 7 typhoon cases, the mean value of 350 m wind shear index α during the impact period is 0.268, which is significantly higher than that of 0.1-0.177. The main cause is that the fitted height range is significantly larger than that of previous studies, and it is also related to the smaller sample of strong winds and rougher underlying surface. The maximum wind shear indices of different wind speed sections of the typhoons can be well fitted with power functions, which can predict the risk of extreme winds at different heights.The wind shear index before and after landing of Typhoon Roke is also analyzed. It shows that after the typhoon eye passes, α increases sharply, because the wind speed above 100 m may have increased significantly before the surface wind re-increase. Therefore, this result should be specially considered in the design of engineering wind resistance and typhoon prevention.
-
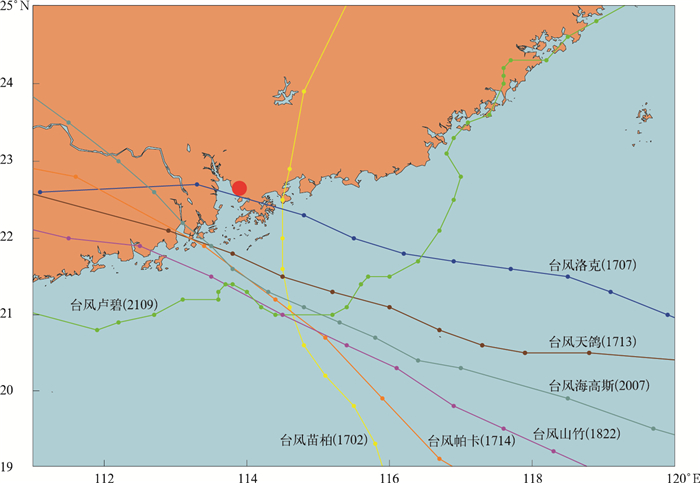
图 1 台风个例路径示意图
(红色圆点为深圳梯度观测塔位置)
Fig. 1 Tracks of typhoons
(the red dot denotes the location of Shenzhen Meteorological Gradient Observation Tower)

图 2 风速拟合决定系数(R2)平均值随拟合高度范围变化
(a)台风影响前,(b)台风影响期间,(c)台风影响后
Fig. 2 Variations of average determination coefficient(R2) in the wind speed fitting with different height ranges
(a)before typhoons,(b)during typhoons, (c)after typhoons
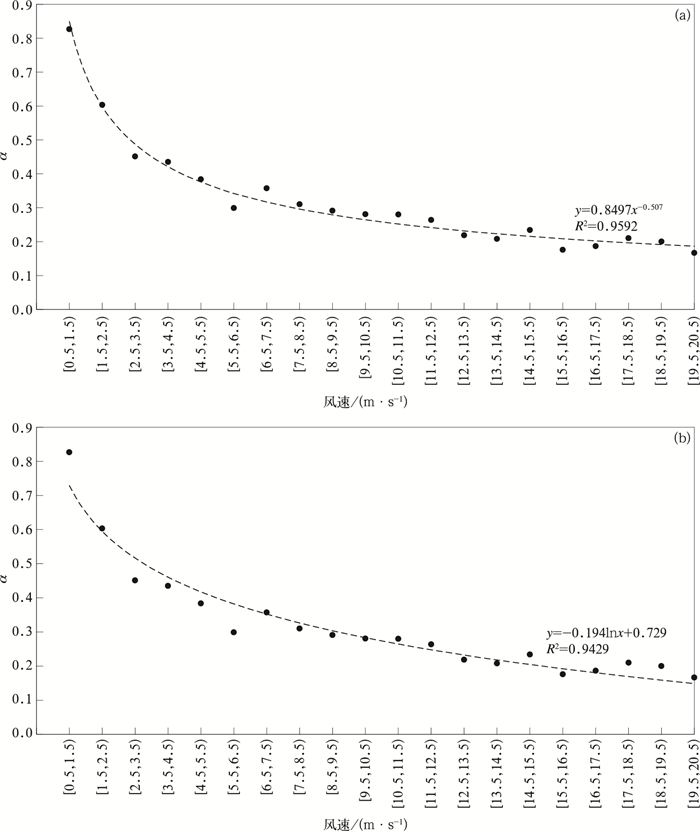
图 4 各风速段最大风切变指数α随风速变化拟合
(a)幂函数拟合,(b)对数函数拟合
Fig. 4 Fitting of the maximum wind shear index and the wind speed
(a)power function fitting,(b)logarithmic function fitting
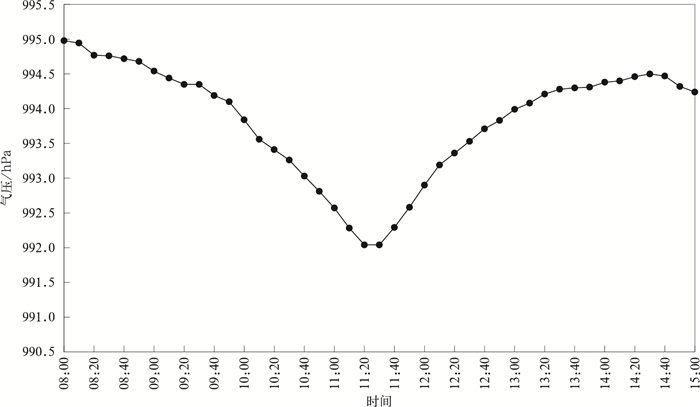
图 5 2017年7月23日台风洛克(1707)经过深圳气象梯度观测塔的50 m高度10 min平均气压变化
Fig. 5 Time series of 10 min average pressure at 50 m height of Shenzhen Gradient Observation Tower during the passing of Typhoon Roke(1707) on 23 Jul 2017
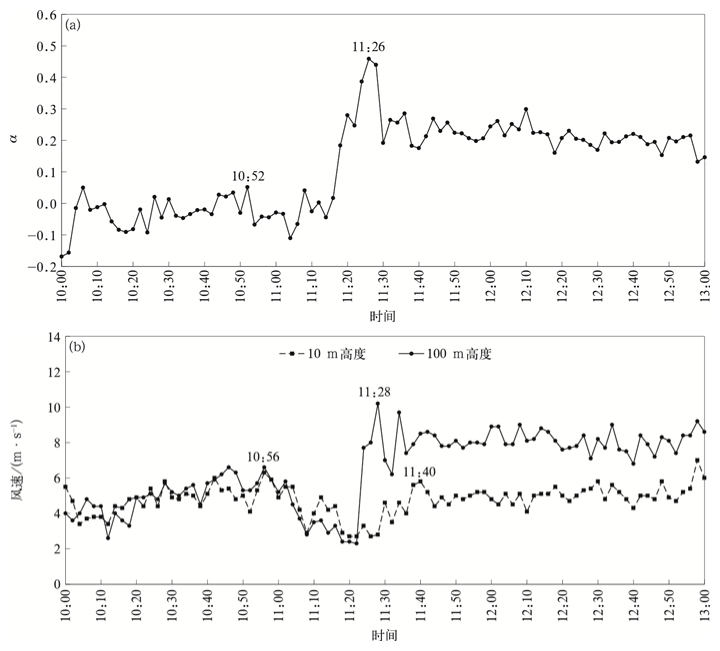
图 6 2017年7月23日台风洛克(1707)经过深圳气象梯度观测塔的风切变指数时间序列(a)和10 m,100 m高度2 min平均风速时间序列(b)
Fig. 6 The wind shear index(a) and 2 min average wind speed at 10 m and 100 m height(b) of Shenzhen Gradient Observation Tower during the passing of Typhoon Roke(1707) on 23 Jul 2017
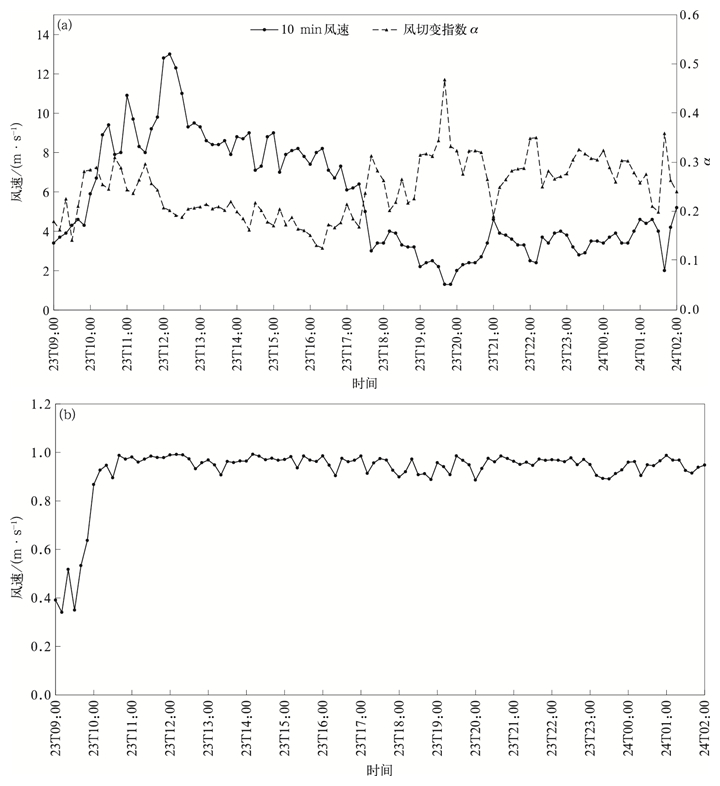
图 7 2017年8月23日09:00—24日02:00台风天鸽(1713)影响期间深圳气象梯度观测塔10 m高度10 min平均风速及风切变指数α(a)和拟合决定系数R2(b)随时间变化
Fig. 7 Time series of 10 min average wind speed at 10 m with the wind shear index α(a) and fitting determination coefficient(R2)(b) of Shenzhen Gradient Observation Tower during Typhoon Hato(1713) from 0900 BT 23 Aug to 0200 BT 24 Aug in 2017
表 1 台风影响前、影响期间和影响后不同高度范围风速拟合风切变指数对比
Table 1 Comparison of wind shear indices based on the observed wind with different height ranges before,during and after impacts of typhoons
拟合高度
(10 m参考层)影响前 影响期间 影响后 α平均值 α变异系数 α平均值 α变异系数 α平均值 α变异系数 40 m以下(3层) 0.083 4.427 0.197 1.053 0.276 1.209 50 m以下(4层) 0.112 2.846 0.204 0.907 0.279 1.153 80 m以下(5层) 0.132 2.222 0.212 0.841 0.278 1.104 100 m以下(6层) 0.148 1.876 0.216 0.828 0.281 1.032 150 m以下(7层) 0.168 1.557 0.228 0.750 0.285 0.947 160 m以下(8层) 0.177 1.460 0.234 0.721 0.287 0.904 200 m以下(9层) 0.183 1.387 0.240 0.692 0.290 0.856 250 m以下(10层) 0.189 1.304 0.247 0.661 0.293 0.816 300 m以下(11层) 0.196 1.228 0.253 0.637 0.297 0.782 320 m以下(12层) 0.199 1.200 0.257 0.625 0.301 0.760 350 m以下(13层) 0.206 1.135 0.264 0.598 0.306 0.733  下载: 导出CSV
表 2 不同高度层选取方案拟合风切变指数对比
Table 2 Comparison of wind shear indices from different layer-combinations
数据层选取 α平均值 α变异系数 R2平均值 R2变异系数 全层次 0.264 0.600 0.813 0.353 等差层 0.268 0.594 0.823 0.336 等比层 0.254 0.623 0.764 0.480
下载: 导出CSV
表 4 幂指数律拟合台风边界层风速拟合决定系数R2跃升情况
Table 4 Sudden rise of the fitting determination coefficient(R2) of wind speed in the typhoon boundary layer based on the power exponential law
统计项目 台风苗柏 台风洛克 台风天鸽 台风帕卡 台风山竹 台风海高斯 R2跃升前值 0.660 0.225 0.637 0.582 0.833 0.679 R2跃升后值 0.919 0.973 0.867 0.976 0.964 0.911 R2跃升时平均风速/(m·s-1) 7.0 3.2 5.9 1.2 10.5 1.6 R2跃升时间点 00:20 11:30 10:00 01:50 12:00 01:50 平均风速峰值时间 00:00 13:00 12:10 08:10 15:00 05:40 R2跃升前观测塔所处台风象限 第二 第二 第二 第二 第二 第二 R2跃升后观测塔所处台风象限 第三 第四 第一 第二 第一 第一
下载: 导出CSV
-
[1] 何立富,陈双,郭云谦.台风利奇马(1909)极端强降雨观测特征及成因.应用气象学报,2020,31(5):513-526. doi: 10.11898/1001-7313.20200501He L F, Chen S, Guo Y Q. Observation characteristics and synoptic mechanisms of Typhoon Lekima extreme rainfall in 2019. J Appl Meteor Sci, 2020, 31(5): 513-526. doi: 10.11898/1001-7313.20200501 [2] 程正泉, 林良勋, 杨国杰, 等. 超强台风威马逊快速增强及大尺度环流特征. 应用气象学报, 2017, 28(3): 318-326. doi: 10.11898/1001-7313.20170306Cheng Z Q, Lin L X, Yang G J, et al. Rapid intensification and associated large-scale circulation of super Typhoon Rammasun in 2014. J Appl Meteor Sci, 2017, 28(3): 318-326. doi: 10.11898/1001-7313.20170306 [3] Okorie M E, Inambao F, Chiguvare Z. Evaluation of wind shear coefficients, surface roughness and energy yields over inland locations in Namibia. Procedia Manufacturing, 2017, 7: 630-638. doi: 10.1016/j.promfg.2016.12.094 [4] 龚玺, 朱蓉, 李泽椿. 我国不同下垫面的近地层风切变指数研究. 气象, 2018, 44(9): 1160-1168. https://www.cnki.com.cn/Article/CJFDTOTAL-QXXX201809004.htmGong X, Zhu R, Li Z C. Study of near-surface wind shear exponents of different regions in China. Meteor Mon, 2018, 44(9): 1160-1168. https://www.cnki.com.cn/Article/CJFDTOTAL-QXXX201809004.htm [5] 靳双龙, 刘晓琳, 李鸿秀, 等. 不同下垫面垂直风切变特征对比. 兰州大学学报(自然科学版), 2019, 55(3): 340-346. https://www.cnki.com.cn/Article/CJFDTOTAL-LDZK201903010.htmJin S L, Liu X L, Li H X, et al. A contrast study on vertical wind shear characteristics of different underlying surfaces. Journal of Lanzhou University(Nat Sci), 2019, 55(3): 340-346. https://www.cnki.com.cn/Article/CJFDTOTAL-LDZK201903010.htm [6] 刘敏, 孙杰, 杨宏青, 等. 湖北省不同地形条件下风随高度变化研究. 气象, 2010, 36(4): 63-67. doi: 10.3969/j.issn.1006-009X.2010.04.015Liu M, Sun J, Yang H Q, et al. The study on wind speed change with height under different terrain conditions in Hubei Province. Meteor Mon, 2010, 36(4): 63-67. doi: 10.3969/j.issn.1006-009X.2010.04.015 [7] 金莉莉, 李振杰, 缪启龙, 等. 乌鲁木齐市近地层风切变指数特征. 沙漠与绿洲气象, 2016, 10(4): 81-86. https://www.cnki.com.cn/Article/CJFDTOTAL-XJQX201604013.htmJin L L, Li Z J, Miao Q L, et al. Characteristics of the wind shear exponent of the near-surface layer in Urumqi City. Desert Oasis Meteor, 2016, 10(4): 81-86. https://www.cnki.com.cn/Article/CJFDTOTAL-XJQX201604013.htm [8] 陈燕, 张宁. 江苏沿海近地层风阵性及台风对其影响. 应用气象学报, 2019, 30(2): 177-190. doi: 10.11898/1001-7313.20190205Chen Y, Zhang N. The wind turbulence of the near-surface layer of Jiangsu coastal area and its response to typhoon. J Appl Meteor Sci, 2019, 30(2): 177-190. doi: 10.11898/1001-7313.20190205 [9] 傅佩玲, 胡东明, 黄浩, 等. 台风山竹(1822)龙卷的双极化相控阵雷达特征. 应用气象学报, 2020, 31(6): 706-718. doi: 10.11898/1001-7313.20200606Fu P L, Hu D M, Huang H, et al. Observation of a tornado event in outside-region of Typhoon Mangkhut by X-band polarimetric phased array radar in 2018. J Appl Meteor Sci, 2020, 31(6): 706-718. doi: 10.11898/1001-7313.20200606 [10] 刘涛, 端义宏, 冯佳宁, 等. 台风利奇马(1909)双眼墙特征及长时间维持机制. 应用气象学报, 2021, 32(3): 289-301. doi: 10.11898/1001-7313.20210303Liu T, Duan Y H, Feng J N, et al. Characteristics and mechanisms of long-lived concentric eyewalls in Typhoon Lekima in 2019. J Appl Meteor Sci, 2021, 32(3): 289-301. doi: 10.11898/1001-7313.20210303 [11] 宋丽莉, 毛慧琴, 汤海燕, 等. 广东沿海近地层大风特性的观测分析. 热带气象学报, 2004, 20(6): 731-736. doi: 10.3969/j.issn.1004-4965.2004.06.014Song L L, Mao H Q, Tang H Y, et al. Observation and analysis of Guangdong coastal gales in the near-surface layer. J Trop Meteor, 2004, 20(6): 731-736. doi: 10.3969/j.issn.1004-4965.2004.06.014 [12] 陈雯超, 刘爱君, 宋丽莉, 等. 不同强风天气系统风特性的个例分析. 气象, 2019, 45(2): 251-262. https://www.cnki.com.cn/Article/CJFDTOTAL-QXXX201902010.htmChen W C, Liu A J, Song L L, et al. Case study of wind characteristics of different strong wind systems. Meteor Mon, 2019, 45(2): 251-262. https://www.cnki.com.cn/Article/CJFDTOTAL-QXXX201902010.htm [13] 王旭, 黄鹏, 顾明. 台风"梅花"近地风剖面变化. 同济大学学报(自然科学版), 2013, 41(8): 1165-1171. doi: 10.3969/j.issn.0253-374x.2013.08.008Wang X, Huang P, Gu M. Variation of wind profiles near ground during Typhoon Muifa. Journal of Tongji University(Nat Sci), 2013, 41(8): 1165-1171. doi: 10.3969/j.issn.0253-374x.2013.08.008 [14] 张容焱, 张秀芝, 杨校生, 等. 台风莫拉克(0908)影响期间近地层风特性. 应用气象学报, 2012, 23(2): 184-194. doi: 10.3969/j.issn.1001-7313.2012.02.007Zhang R Y, Zhang X Z, Yang X S, et al. Wind characteristics study in surface layer of Typhoon Morakot(0908). J Appl Meteor Sci, 2012, 23(2): 184-194. doi: 10.3969/j.issn.1001-7313.2012.02.007 [15] 方平治, 赵兵科, 鲁小琴, 等. 台风影响下福州地区的风廓线特征. 自然灾害学报, 2013, 22(2): 91-98. https://www.cnki.com.cn/Article/CJFDTOTAL-ZRZH201302012.htmFang P Z, Zhao B K, Lu X Q, et al. Study on characteristics of wind profiles affected by landed typhoons in Fuzhou area. J Nat Disaster, 2013, 22(2): 91-98. https://www.cnki.com.cn/Article/CJFDTOTAL-ZRZH201302012.htm [16] 王志春, 植石群. 登陆台风启德近地层强风特性观测研究. 气象科技, 2014, 42(4): 678-681. https://www.cnki.com.cn/Article/CJFDTOTAL-QXKJ201404027.htmWang Z C, Zhi S Q. Observational study of strong wind characteristics of Typhoon Kaitak with automotive wind profiler radar. Meteor Sci Technol, 2014, 42(4): 678-681. https://www.cnki.com.cn/Article/CJFDTOTAL-QXKJ201404027.htm [17] 徐大海. 大气边界层内风的若干特性及其应用. 空气动力学学报, 1984, 2(3): 75-87. https://www.cnki.com.cn/Article/CJFDTOTAL-KQDX198403010.htmXu D H. Wind characteristics in the planetary boundary layer and applications. Acta Aerodyn Sin, 1984, 2(3): 75-87. https://www.cnki.com.cn/Article/CJFDTOTAL-KQDX198403010.htm [18] 申华羽, 吴息, 谢今范, 等. 近地层风能参数随高度分布的推算方法研究. 气象, 2009, 35(7): 54-60. https://www.cnki.com.cn/Article/CJFDTOTAL-QXXX200907009.htmShen H Y, Wu X, Xie J F, et al. Research on algorithm of wind energy parameters in surface layer with height. Meteor Mon, 2009, 35(7): 54-60. https://www.cnki.com.cn/Article/CJFDTOTAL-QXXX200907009.htm [19] 王志春, 宋丽莉, 何秋生, 等. 风速随高度变化的曲线模型分析. 热带气象学报, 2007, 23(6): 690-692. https://www.cnki.com.cn/Article/CJFDTOTAL-RDQX200706025.htmWang Z C, Song L L, He Q S, et al. Model analysis of curve fitting of wind speed and its height. J Trop Meteor, 2007, 23(6): 690-692. https://www.cnki.com.cn/Article/CJFDTOTAL-RDQX200706025.htm [20] 徐宝清, 吴婷婷, 李文慧. 风能风切变指数计算方法的比选研究. 农业工程学报, 2014, 30(16): 188-194. https://www.cnki.com.cn/Article/CJFDTOTAL-NYGU201416025.htmXu B Q, Wu T T, Li W H, et al. Screening of calculation methods for wind shear exponent. Trans Chin Soc Agric Eng, 2014, 30(16): 188-194. https://www.cnki.com.cn/Article/CJFDTOTAL-NYGU201416025.htm [21] 谷新波, 吴焕波, 徐丽娜, 等. 基于不同风切变指数算法的风场风速推算精度分析. 可再生能源, 2019, 37(9): 1362-1367. https://www.cnki.com.cn/Article/CJFDTOTAL-NCNY201909014.htmGu X B, Wu H B, Xu L N, et al. Precision analysis of wind speed prediction based on different calculation methods of wind shear exponent. Renew Energ Resour, 2019, 37(9): 1362-1367. https://www.cnki.com.cn/Article/CJFDTOTAL-NCNY201909014.htm [22] 植石群, 钱光明, 罗金铃. 广东省沿海风随高度变化研究. 热带地理, 2001, 21(2): 131-134. https://www.cnki.com.cn/Article/CJFDTOTAL-RDDD200102007.htmZhi S Q, Qian G M, Luo J L. A study of wind velocity varying with altitude on the coastal areas of Guangdong Province. Trop Geogr, 2001, 21(2): 131-134. https://www.cnki.com.cn/Article/CJFDTOTAL-RDDD200102007.htm [23] 建筑结构荷载规范. 中华人民共和国国家标准GB 50009—2012.2012.Load Code for the Design of Building Structures. National Standard of the People's Republic of China, GB 50009-2012.2012. [24] Hong Kong Building Department. Code of Practice on Wind Effects in Hong Kong. Hong Kong: Building Department, 2004. [25] Architectural Institute of Japan. Recommendations for Loads on Buildings: A1J-RLB-2004. Tokyo: Architectural Institute of Japan, 2004. [26] American Society of Civil Engineers. Minimum Design Loads for Buildings and Other Structures: ASCE/SEI 7-05. Reston, VA: ASCE, 2006. [27] 风电场风能资源评估方法. 中华人民共和国国家标准GB/T 18710—2002.2002.Evaluation Method of Wind Energy Resources in Wind Farm. National Standard of the People's Republic of China, GB/T 18710-2002.2002. [28] 风力发电机组设计要求. 中华人民共和国国家标准GB/T 18451.1—2012.2012.Wind Turbine Generator Systems-design Requirement. National Standard of the People's Republic of China, GB/T 18451.1-2012.2012. [29] Farrugia R N. The wind shear exponent in a Mediterranean island climate. Renewable Energy, 2003, 28: 647-653. [30] Bailey B H. Predicting Vertical Wind Profiles as a Function of Time of the Day and Surface Wind Speed. International Colloquium on Wind Energy, 1981. [31] 严嘉明, 赵兵科, 张帅, 等. 边界层风廓线雷达对登陆台风观测适用性评估. 应用气象学报, 2021, 32(3): 332-346. doi: 10.11898/1001-7313.20210306Yan J M, Zhao B K, Zhang S, et al. Observation analysis and application evaluation of wind profile radar to diagnosing the boundary layer of landing typhoon. J Appl Meteor Sci, 2021, 32(3): 332-346. doi: 10.11898/1001-7313.20210306 [32] 梁智豪, 王东海, 梁钊明. 探空观测的边界层高度时空变化特征. 应用气象学报, 2020, 31(4): 447-459. doi: 10.11898/1001-7313.20200407Liang Z H, Wang D H, Liang Z M. Spatio-temporal characteristics of boundary layer height derived from soundings. J Appl Meteor Sci, 2020, 31(4): 447-459. doi: 10.11898/1001-7313.20200407 [33] 王志春, 植石群, 丁凌云. 强台风纳沙(1117)近地层风特性观测分析. 应用气象学报, 2013, 24(5): 595-605. http://qikan.camscma.cn/article/id/20130509Wang Z C, Zhi S Q, Ding L Y. Observation and analysis on Qiongzhou Strait gales of severe Typhoon Neasat(2011). J Appl Meteor Sci, 2013, 24(5): 595-605. http://qikan.camscma.cn/article/id/20130509 -

 点击查看大图
计量
- 摘要浏览量: 1029
- HTML全文浏览量: 171
- PDF下载量: 82
- 被引次数: 0
