
 设为首页
设为首页 加入收藏
加入收藏

Extreme Cold and Snowstorm Event in North America in February 2021 Based on Satellite Data
-
摘要: 利用气象卫星数据和欧洲中期天气预报中心ERA5再分析数据,在开展卫星数据误差分析的基础上,研究2021年2月北美冬季风暴乌里发生的气候背景、发展演变、极涡活动对乌里的触发作用及造成极端低温和降雪的大气影响因子等。结果表明:与ERA5温度相比,FY-3D/VASS温度在北美地区100,400 hPa和850 hPa的平均绝对偏差分别为1.14℃,1.44℃和2.63℃,可满足冬季极端冷事件监测服务需求;2021年2月北美大陆冷空气活动关键区(50°~80°N,50°~150°W)西部温度较历史同期偏低4~8℃,2月上旬冷空气强度最强,温度距平百分比达70%;在东北太平洋暖高压脊引导下,极涡加强南下,极涡中心西侧横槽转竖过程中冷空气向南爆发,对流层中高层高位涡异常南伸为乌里的生成提供了高层动力强迫,低层冷空气南下和墨西哥湾沿副热带高压西侧向北输送的暖湿气流在美国南部交汇,触发了乌里低层低涡及云系的快速发展;造成强降雪的风暴乌里云系具有对流特征,冷锋云带和头部云顶亮温大部分低于-40℃,部分低于-52℃,闪电活跃。
-
关键词:
- 风云气象卫星;
- FY-3D/VASS温度和湿度;
- 北美冬季风暴乌里;
- 极涡;
- 位涡
Abstract: Using meteorological satellite data and the reanalysis dataset from European Centre for Medium Range Weather Forecasts(ERA5) and others, based on the accuracy evaluation of FY-3D/VASS temperature in North America, the climatic background, development and evolution of North America winter storm Uri in 2021, the triggering effects of polar vortex activities on Uri and the characteristics of atmospheric environment causing extreme low temperature and snowfall are studied. The results show that the average absolute error of FY-3D/VASS temperature at 100, 400 hPa and 850 hPa are 1.14℃, 1.44℃ and 2.63℃ respectively. It shows that FY-3D/VASS temperature can meet the demand of global extreme cold event monitoring, and it is an important data source in regions where conventional meteorological observation is insufficient. FY-3D/VASS temperature analysis shows that in February 2021, when winter storm Uri is active, the temperature in the western part of the key area of polar cold air activity in North America (50°-150°W, 50°-80°N) is 4-8℃ lower than climate mean. The cold air intensity is the strongest in the first ten days of February, and the maximum percentage of temperature anomaly is about 70%. Under the guidance of the warm high ridge in the northeast Pacific, the polar vortex intensifies and extends southward, and the cold air breaks out southward during the vertical rotation of the horizontal trough on the west side of the polar vortex center. The abnormal southward extension of the upper troposphere potential vorticity in high latitude provides upper-level dynamic forcing for the formation of Uri. The cold air in the low layer extends southward and intersects with the warm and humid airflow transported northward over the Gulf of Mexico along the west side of the subtropical high in southern United States. They trigger the low-level vortex of storm Uri and the rapid development of cloud system. The cloud causing strong snowfall of storm Uri shows convective characteristics, with the cloud top brightness temperature reaching lower than -40℃ and even lower than -52℃ in some areas. Lightning is also active in the storm cloud system which causes heavy snow. -
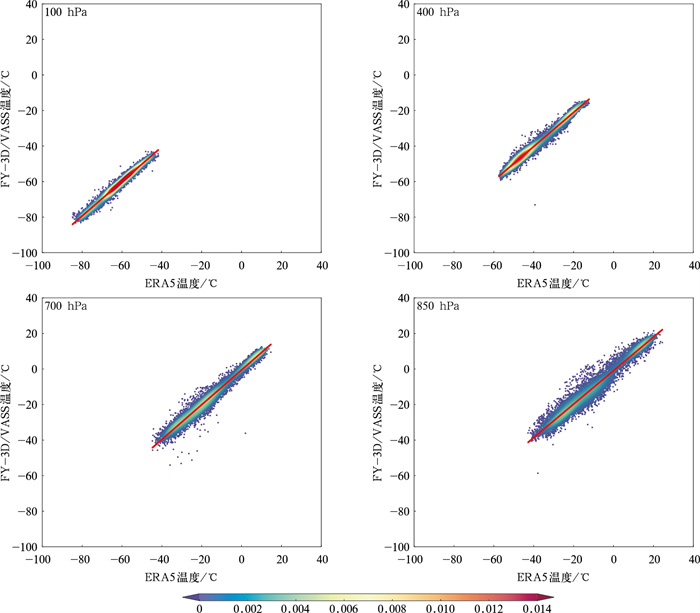
图 1 2021年2月北美区域(10°~85°N,50°~150°W)FY-3D/VASS温度和ERA5温度散点密度
Fig. 1 Scatterplot density of FY-3D/VASS temperature against that of ERA5 temperature in North America(10°-85°N,50°-150°W) in Feb 2021
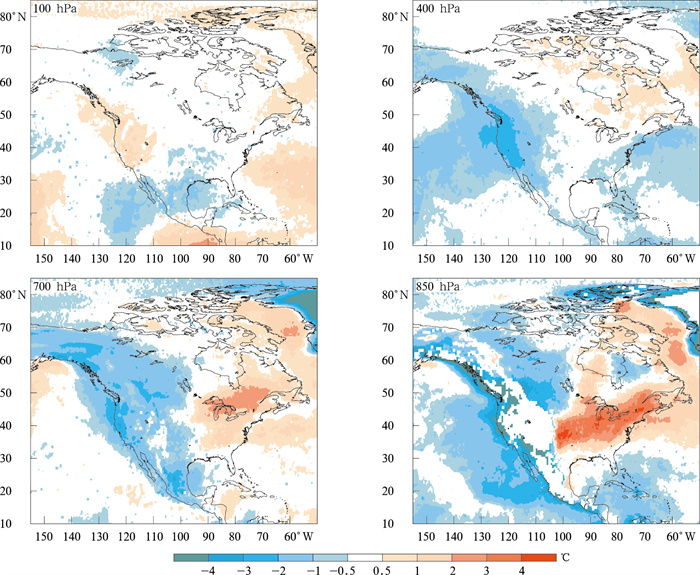
图 2 2021年2月FY-3D/VASS相对于EAR5的温度平均偏差
Fig. 2 Mean bias of FY-3D/VASS temperature against ERA5 temperature in Feb 2021
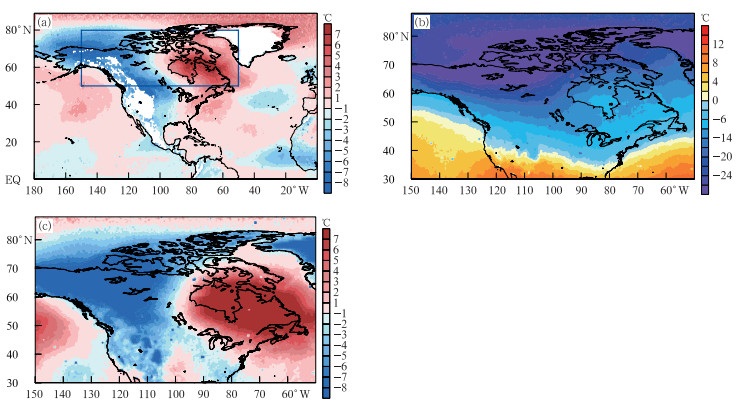
图 3 2021年FY-3D/VASS 850 hPa平均温度和温度距平
(a)2月平均温度距平, (b)2月1—7日平均温度,(c)2月1—7日平均温度距平
Fig. 3 FY-3D/VASS average temperature and its anomaly at 850 hPa in 2021
(a)average temperature anomaly in Feb, (b)average temperature from 1 Feb to 7 Feb, (c)average temperature anomaly from 1 Feb to 7 Feb
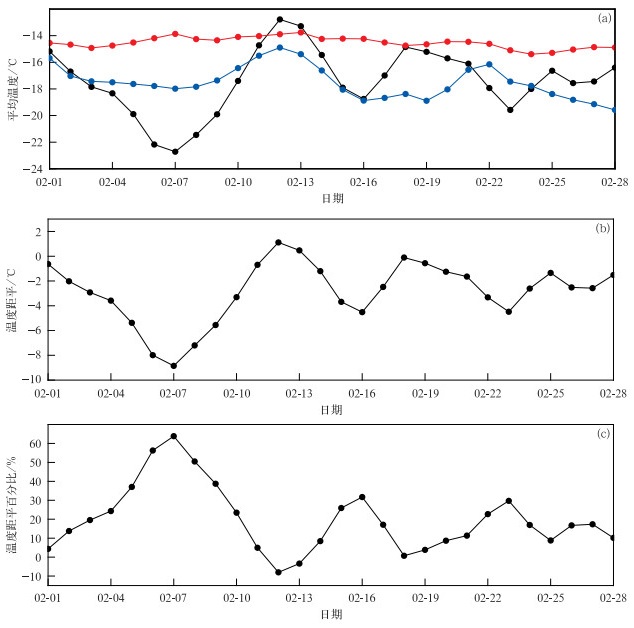
图 4 2021年2月1—28日850 hPa区域平均温度时间序列
(a)FY-3D/VASS区域平均温度(蓝线:50°~80°N, 50°~150°W;黑线:50°~80°N, 100°~150°W)和ERA5气候态区域平均温度(红线:50°~80°N,100°~150°W), (b)FY-3D/VASS区域平均(50°~80°N,100°~150°W)温度距平, (c)FY-3D/VASS区域平均(50°~80°N, 100°~150°W)温度距平百分比
Fig. 4 Time series of regional average temperature at 850 hPa from 1 Feb to 28 Feb in 2021 )
(a)regional average FY-3D/VASS temperature(blue line denotes region of 50°-80°N, 50°-150°W, black line denotes region of 50°-80°N, 100°-150°W) and climate regional ERA5 temperature(red line denotes region of 50°-80°N,100°-150°W), (b)regional average FY-3D/VASS temperature anomaly(50°-80°N,100°-150°W), (c)percentage of regional average FY-3D/VASS temperature anomaly(50°-80°N, 100°-150°W
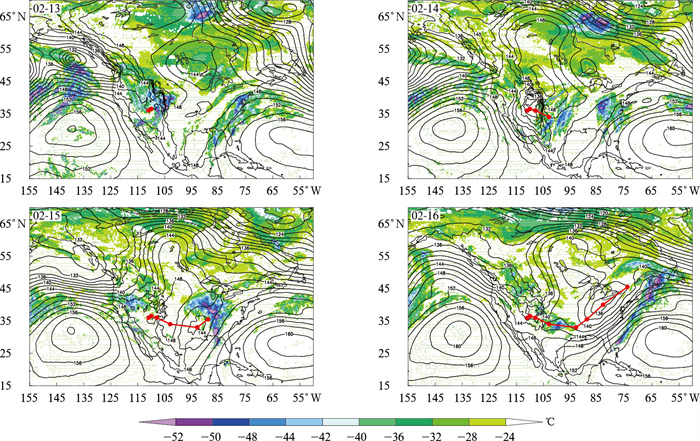
图 5 2021年2月13—16日FY-3D日平均云顶温度(填色)和ERA5 850 hPa高度场(等值线,单位:dagpm)
(红点和红线分别表示风暴中心和移动路径)
Fig. 5 Daily mean FY-3D cloud top temperature(the shaded) and ERA5 geopotential height(the contour, unit:dagpm) at 850 hPa from 13 Feb to 16 Feb in 2021
(the red dot and line denote the storm center and moving path, respectively)
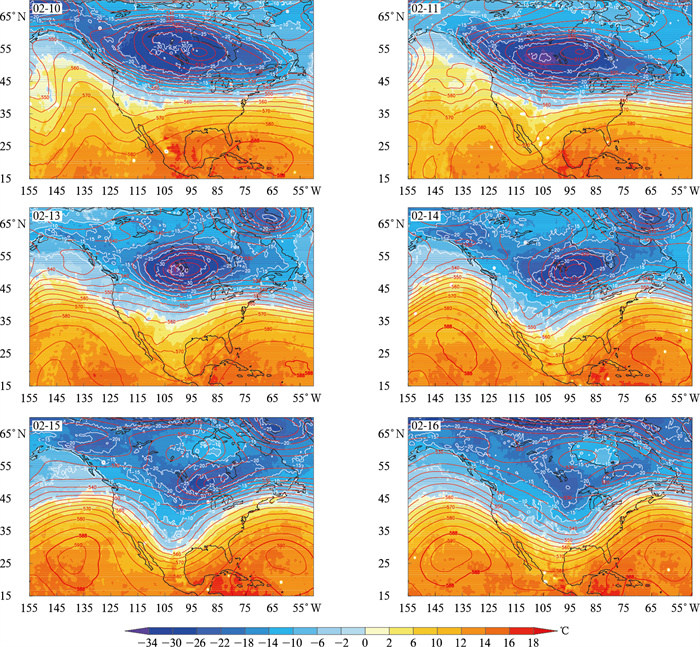
图 6 2021年2月10,11,13—16日FY-3D/VASS 850 hPa日平均温度(填色) 和ERA5 500 hPa位势高度(等值线,单位:dagpm)
Fig. 6 Daily mean FY-3D/VASS temperature(the shaded) at 850 hPa and ERA5 geopotential height (the contour, unit:dagpm) at 500 hPa on 10 Feb, 11 Feb, 13-16 Feb in 2021
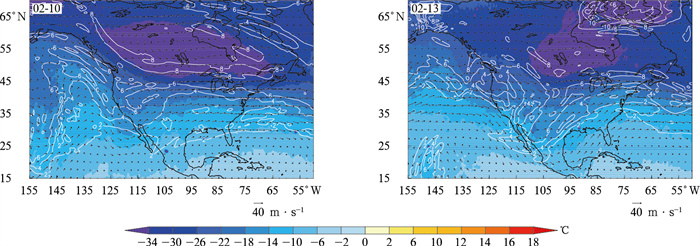
图 7 2021年2月10日和13日FY-3D/VASS 500 hPa温度(填色)、ERA5 500 hPa风场(矢量)和200 hPa位涡(等值线,单位:PVU)
Fig. 7 FY-3D/VASS temperature(the shaded) at 500 hPa, ERA5 wind(the vector) at 500 hPa and potential vorticity(the isoline, unit:PVU) at 200 hPa on 10 Feb and 13 Feb in 2021
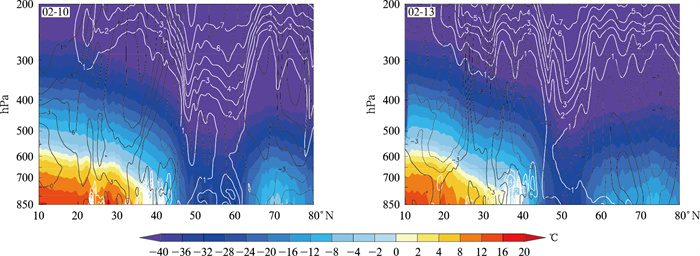
图 8 2021年2月10日和13日FY-3D/VASS温度(填色)、ERA5纬向风(黑色等值线,单位:m·s-1) 和位涡(白色等值线,单位:PVU)沿105°W的垂直剖面
Fig. 8 Vertical distribution of FY-3D/VASS temperature(the shaded), ERA5 zonal wind(the black isoline, unit:m·s-1) and potential vorticity(the white isoline, unit:PVU) along 105°W on 10 Feb and 13 Feb in 2021
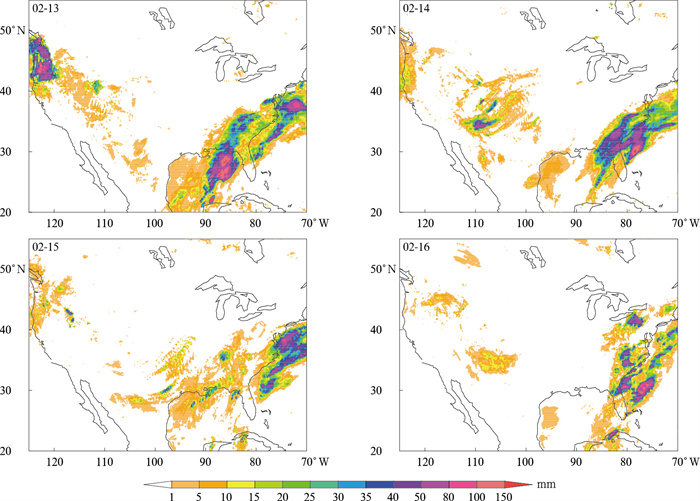
图 9 2021年2月13—16日GSMaP_Gauge 24 h降水量
Fig. 9 GSMaP_Gauge precipitation in 24 h from 13 Feb to 16 Feb in 2021
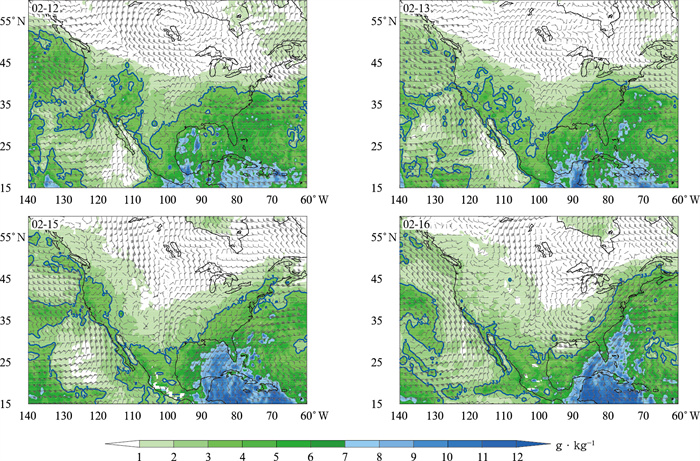
图 10 2021年2月850 hPa FY-3D/VASS比湿(填色,蓝色等值线为3 g·kg-1)和ERA5风场(矢量)
Fig. 10 FY-3D/VASS specific humidity(the shaded, the blue isoline denotes 3 g·kg-1) and ERA5 wind(the vector) at 850 hPa in Feb 2021
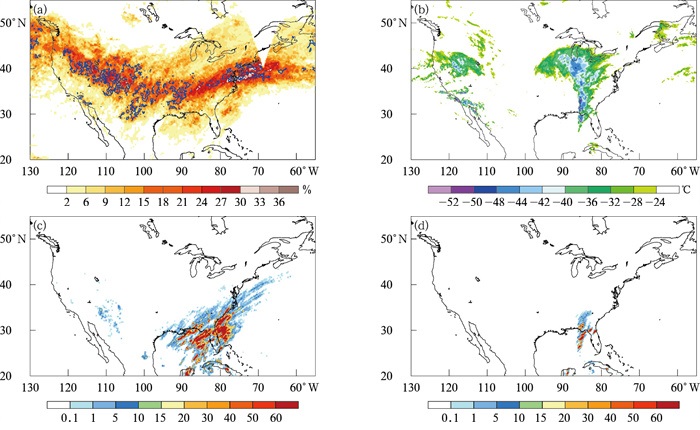
图 11 2021年2月静止气象卫星观测的对流和闪电
(a)12—17日GridSat对流活动频率(填色为云顶亮温低于-32℃出现频率,蓝色等值线为云顶亮温低于-42℃出现频率(大于6%),单位:%), (b)15日21:00 GridSat云顶亮温, (c)14日00:00—17日00:00 GOES-R GLM闪电总次数, (d)15日20:00—22:00 GOES-R GLM闪电总次数
Fig. 11 Convection and flash from geostationary meteorological satellites in 2021
(a)convection frequency from GridSat from 12 Feb to 17 Feb(the shaded denotes frequency of cloud top brightness temperature lower than -32℃, the blue isoline denotes frequency of cloud top brightness temperature lower than -42℃(greater than 6%), unit:%), (b)the cloud top brightness temperature from GridSat at 2100 UTC 15 Feb, (c)total number of flash from GOES-R GLM from 14 Feb to 17 Feb, (d)total number of flash from GOES-R GLM from 2000 UTC to 2200 UTC on 15 Feb
表 1 2021年2月北美区域(10°~85°N,50°~150°W)FY-3D/VASS温度精度
Table 1 Accuracy of FY-3D/VASS temperature in North America(10°-85°N,50°-150°W) in Feb 2021
气压层/hPa 样本量 相关系数 平均偏差/℃ 绝对偏差/℃ 均方根误差/℃ 100 7736865 0.98 0.17 1.14 1.71 400 8863018 0.99 -0.22 1.44 1.94 700 8858121 0.98 -0.21 1.92 2.66 850 8475087 0.97 -0.48 2.63 3.56  下载: 导出CSV
-
[1] Valipour M, Bateni S M, Jun C.Global surface temperature:A new insight.Climate, 2021, 9(5):81. doi: 10.3390/cli9050081 [2] Wu B Y, Li Z K, Francis J A, et al. A recent weakening of winter temperature association between Arctic and Asia. Environ Res Lett, 2022, 17(3): 034030. doi: 10.1088/1748-9326/ac4b51 [3] 张恒德, 高守亭, 刘毅. 极涡研究进展. 高原气象, 2008, 27(2): 452-461.Zhang H D, Gao S T, Liu Y. Advances of research on polar vortex. Plateau Meteor, 2008, 27(2): 452-461. [4] 董晓峣, 武炳义. 江淮地区夏季高温事件与北极冷异常的动力联系. 应用气象学报, 2019, 30(4): 431-442. doi: 10.11898/1001-7313.20190404Dong X Y, Wu B Y. Dynamic linkages between heat wave events in Jianghuai Region and Arctic summer cold anomaly. J Appl Meteor Sci, 2019, 30(4): 431-442. doi: 10.11898/1001-7313.20190404 [5] Willett H C. Long-period fluctuations of general circulation of the atmosphere. J Atmos Sci, 1949, 6: 34-50. [6] 刘传风, 高波. 我国南方春季低温冷害气候及其大气环流特征. 热带气象学报, 2001, 17(2): 179-187. doi: 10.3969/j.issn.1004-4965.2001.02.010Liu C F, Gao B. Climate of chilling damage in spring in Southern China and its atmospheric circulation features. J Trop Meteor, 2001, 17(2): 179-187. doi: 10.3969/j.issn.1004-4965.2001.02.010 [7] 姜忠宝, 王盘兴, 吴息, 等. 北半球冬季极涡异常变化的时空特征. 大气科学学报, 2013, 36(2): 202-216. doi: 10.3969/j.issn.1674-7097.2013.02.009Jiang Z B, Wang P X, Wu X, et al. Spatial-temporal variations of polar vortex anomaly over Northern Hemisphere in winter. Trans Atmos Sci, 2013, 36(2): 202-216. doi: 10.3969/j.issn.1674-7097.2013.02.009 [8] 杨静, 钱永甫. 平流层30 hPa月平均高度场的气候特征. 高原气象, 2005, 24(2): 152-159. doi: 10.3321/j.issn:1000-0534.2005.02.004Yang J, Qian Y F. Climate characteristics of monthly mean height field on 30 hPa in stratosphere. Plateau Meteor, 2005, 24(2): 152-159. doi: 10.3321/j.issn:1000-0534.2005.02.004 [9] 张琳, 吕俊梅, 丁明虎. 2015年初北极极端气旋对中国寒潮的影响. 应用气象学报, 2020, 31(3): 315-327. doi: 10.11898/1001-7313.20200306Zhang L, Lü J M, Ding M H. Impact of Arctic extreme cyclones on cold spells in China during early 2015. J Appl Meteor Sci, 2020, 31(3): 315-327. doi: 10.11898/1001-7313.20200306 [10] 张婧雯, 李栋梁, 柳艳菊. 北半球极涡新特征及其对中国冬季气温的影响. 高原气象, 2014, 33(3): 721-732. https://www.cnki.com.cn/Article/CJFDTOTAL-GYQX201403014.htmZhang J W, Li D L, Liu Y J. New features of polar vortex and its impact on winter temperature of China. Plateau Meteor, 2014, 33(3): 721-732. https://www.cnki.com.cn/Article/CJFDTOTAL-GYQX201403014.htm [11] Laseur N E. On asymmetry of the middle latitude circumpolar current. J Atmos Sci, 1954, 11(1): 43-57. [12] Angell J K. Contraction of the 300 mb north circumpolar vortex during 1963-1997 and its movement into the eastern hemisphere. J Geophys Res, 1998, 103(D20): 25887-25893. doi: 10.1029/98JD02451 [13] Lukens K E, Berbery E H, Hodges K I. The imprint of strong-storm tracks on winter weather in North America. J Climate, 2018, 31(5): 2057-2074. doi: 10.1175/JCLI-D-17-0420.1 [14] Stephen J C. Winter cyclone frequencies over the eastern United States and adjacent western Atlantic 1964-1973. Bull Amer Meteor Soc, 1976, 57(5): 548-553. [15] Hoskins B J, Hodges K I. New perspectives on the Northern Hemisphere winter storm tracks. J Atmos Sci, 2002, 59(6): 1041-1061. [16] Eichler T P, Gaggini N, Pan Z. Impacts of global warming on Northern Hemisphere winter storm tracks in the CMIP5 model suite. J Geophys Res Atmos, 2013, 118(10): 3919-3932. [17] Zheng C, Chang E K, Kim H M, et al. Impacts of the Madden-Julian oscillation on storm track activity, surface air temperature, and precipitation over North America. J Climate, 2018, 31(15): 6113-6134. [18] Rasmijn L M, Schrier G, Barkmeijer J, et al. Simulating the extreme 2013/2014 winter in a future climate. J Geophys Res Atmos, 2016, 121(10): 5680-5698. [19] James D G, David J F, Upmanu L, et al. How unprecedented was the February 2021 Texas cold snap. Environ Res Lett, 2021, 16(6): 064056. [20] 张鹏, 郭强, 陈博洋, 等. 我国风云四号气象卫星与日本Himawari-8/9卫星比较分析. 气象科技进展, 2016, 6(1): 72-75. https://www.cnki.com.cn/Article/CJFDTOTAL-QXKZ201601026.htmZhang P, Guo Q, Chen B Y, et al. The Chinese next-generation geostationary meteorological satellite FY-4 compared with the Japanese Himawari-8/9 satellites. Adv Meteor Sci Tech, 2016, 6(1): 72-75. https://www.cnki.com.cn/Article/CJFDTOTAL-QXKZ201601026.htm [21] Yang J, Zhang Z Q, Wei C Y, et al. Introducing the new generation of Chinese geostationary weather satellite Fengyun-4. Bull Amer Meteor Soc, 2017, 98(8): 1637-1658. [22] 张志清, 陆风, 方翔, 等. FY-4卫星应用和发展. 上海航天, 2017, 34(4): 8-19. https://www.cnki.com.cn/Article/CJFDTOTAL-SHHT201704002.htmZhang Z Q, Lu F, Fang X, et al. Application and development of FY-4 meteorological satellite. Aerospace Shanghai, 2017, 34(4): 8-19. https://www.cnki.com.cn/Article/CJFDTOTAL-SHHT201704002.htm [23] Zhang P, Hu X Q, Lu Q F, et al. FY-3E: the first operational meteorological satellite mission in an early morning orbit. Adv Atmos Sci, 2022, 39(1): 1-8. [24] Hersbach H, Bell B, Berrisford P, et al. The ERA5 global reanalysis. Quart J Roy Meteor Soc, 2020, 146(730): 1999-2049. [25] Xian D, Zhang P, Gao L, et al. Fengyun meteorological satellite products for earth system science applications. Adv Atmos Sci, 2021, 38(8): 1267-1284. [26] 谷松岩, 王振占, 李靖, 等. 风云三号A星微波湿度计主探测通道辐射特性. 应用气象学报, 2010, 21(3): 335-341. http://qikan.camscma.cn/article/id/20100309Gu S Y, Wang Z Z, Li J, et al. The radiometric characteristics of sounding channels for FY-3A/MWHS. J Appl Meteor Sci, 2010, 21(3): 335-341. http://qikan.camscma.cn/article/id/20100309 [27] 郭杨, 卢乃锰, 谷松岩, 等. FY-3C微波湿温探测仪辐射测量特征. 应用气象学报, 2014, 25(4): 436-444. http://qikan.camscma.cn/article/id/20140406Guo Y, Lu N M, Gu S Y, et al. Radiometric characteristics of FY-3C microwave humidity and temperature sounder. J Appl Meteor Sci, 2014, 25(4): 436-444. http://qikan.camscma.cn/article/id/20140406 [28] 张鹏, 杨虎, 邱红, 等. 风云三号卫星的定量遥感能力应用. 气象科技进展, 2021, 2(4): 6-11. https://www.cnki.com.cn/Article/CJFDTOTAL-QXKZ201204005.htmZhang P, Yang H, Qiu H, et al. Quantitative remote sensing from the current Fengyun 3 satellites. Adv Meteor Sci Tech, 2012, 2(4): 6-11. https://www.cnki.com.cn/Article/CJFDTOTAL-QXKZ201204005.htm [29] 庄国泰. 全国高影响天气监测预报服务技术复盘(2021年). 北京: 气象出版社, 2022.Zhuang G T. Technical Review of National High Impact Weather Monitoring and Forecasting Service(2021). Beijing: China Meteorological Press, 2022. [30] 曾昭美, 严中伟. 本世纪全球增暖的显著性分析. 应用气象学报, 1998, 10(增刊Ⅰ): 23-33. https://www.cnki.com.cn/Article/CJFDTOTAL-YYQX9S1.003.htmZeng Z M, Yan Z W. Analysis on the significant of global warming trends during the last 100 years. J Appl Meteor Sci, 1998, 10(SupplⅠ): 23-33. https://www.cnki.com.cn/Article/CJFDTOTAL-YYQX9S1.003.htm [31] 杨忠东, 张鹏, 谷松岩, 等. FY-3卫星应用和发展. 上海航天, 2017, 34(4): 1-7. https://www.cnki.com.cn/Article/CJFDTOTAL-SHHT201704001.htmYang Z D, Zhang P, Gu S Y, et al. Application and development of FY-3 meteorological satellite. Aerospace Shanghai, 2017, 34(4): 1-7. https://www.cnki.com.cn/Article/CJFDTOTAL-SHHT201704001.htm [32] Knapp K R, Ansari S, Bain C L, et al. Globally gridded satellite(GridSat) observations for climate studies. Bull Amer Meteor Soc, 2011, 92: 893-907. [33] Hou A Y, Kakar R K, Neek S, et al. The global precipitation measurement mission. Bull Amer Meteor Soc, 2014, 95: 701-722. [34] Rutledge S A, Hilburn K A, Clayton A, et al. Evaluating geostationary lightning mapper flash rates within intense convective storms. J Geophys Res Atmos, 2020, 125, e2020JD032827. [35] Hoskins B J, Mclntyre M E, Robertson A W. On the use and significance of isentropic potential vorticity maps. Quart J Roy Meteor Soc, 1985, 111(470): 877-946. [36] 方翔, 任素玲, 李云, 等. 卫星水汽图像和位势涡度场在天气分析和预报中的应用. 北京: 科学出版社, 2008.Fang X, Ren S L, Li Y, et al. Weather Analysis and Forecasting Applying Satellite Water Vapor Imagery and Potential Vorticity Analysis. Beijing: Science Press, 2008. [37] 何立富, 齐道日娜, 余文. 引发东北极端暴雪的黄渤海气旋爆发性发展机制. 应用气象学报, 2022, 33(4): 385-399. doi: 10.11898/1001-7313.20220401He L F, Chyi D, Yu W. Development mechanisms of the Yellow Sea and Bohai Sea cyclone causing extreme snowstorm in Northeast China. J Appl Meteor Sci, 2022, 33(4): 385-399. doi: 10.11898/1001-7313.20220401 [38] 何立富, 陈双, 郭云谦. 台风利奇马(1919)极端强降雨观测特征及成因. 应用气象学报, 2020, 31(5): 513-526. doi: 10.11898/1001-7313.20200501He L F, Chen S, Guo Y Q. Observation characteristics and synoptic mechanisms of Typhoon Lekima extreme rainfall in 2019. J Appl Meteor Sci, 2020, 31(5): 513-526. doi: 10.11898/1001-7313.20200501 [39] 陈虹杏, 谌芸, 陆尔, 等. 2008年初南方雨雪冰冻期间降水过程的温湿异常. 应用气象学报, 2015, 26(5): 525-535. doi: 10.11898/1001-7313.20150502Chen H X, Chen Y, Lu E, et al. Anomalous moisture and temperature characteristics in precipitation process during January 2008 heavy snowstorm in China. J Appl Meteor Sci, 2015, 26(5): 525-535. doi: 10.11898/1001-7313.20150502 [40] 刘泽, 郭凤霞, 郑栋, 等. 一次暖云强降水主导的对流单体闪电活动特征. 应用气象学报, 2020, 31(2): 185-196. doi: 10.11898/1001-7313.20200206Liu Z, Guo F X, Zheng D, et al. Lightning activities in a convection cell dominated by heavy warm cloud precipitation. J Appl Meteor Sci, 2020, 31(2): 185-196. doi: 10.11898/1001-7313.20200206 -

计量
- 摘要浏览量: 799
- HTML全文浏览量: 119
- PDF下载量: 88
- 被引次数: 0
