
 设为首页
设为首页 加入收藏
加入收藏

Impacts of Urbanization on Extreme Climate Events in Sichuan-Chongqing Region
-
摘要: 为探讨城市化对川渝地区极端气候事件的影响,利用1971—2020年川渝地区46个气象站的逐日气温和降水数据,以及社会经济、人口、土地利用、夜间灯光遥感数据,将气象站划分为城市站、城乡站和乡村站3类,得到近50年21个极端气候指数的时间序列,分析城市化对极端气候事件的影响和贡献率。结果表明:近50年川渝地区3类气象站极值指数和暖指数均呈上升趋势,而冷指数均呈下降趋势,极端降水量和极端降水强度均呈增加趋势。城市化影响对城乡站和城市站的最高和最低气温最小值、霜冻、热夜日数和日较差,以及城市站的冷夜和暖夜日数均影响较大,对其余指数的影响较小。城市化影响对城乡站和城市站的中雨日数、1 d和5 d最大降水量、强降水量和年降水量的贡献率均为100.00%,对城乡站大雨日数、城乡站和城市站特强降水量的贡献率较大,而对其余指数的影响相对较小。Abstract: Based on daily precipitation and temperature data as well as population, gross domestic product (GDP), land use and land cover change (LUCC), night lighting remote sensing data of 46 meteorological stations in Sichuan and Chongqing Region from 1971 to 2020, 21 extreme climate indices are calculated using RClimDex software, and the interannual variation trends of these indices are analyzed using linear trend method. The Mann-Kendall nonparametric method is used to test the significance levels of all indices. These meteorological stations are categorified to further investigate the impact of urbanization on extreme climate indices, especially the impact of urbanization on extreme climate events in Sichuan and Chongqing. It's found that the monthly maximum value of daily maximum temperature (TXx), maximum value of daily minimum temperature (TNx), minimum value of daily maximum temperature (TXn), minimum value of daily minimum temperature (TNn), summer days (SU25), occurrence of hot nights(TR20), warm nights (TN90P) and warm days (TX90P) all show an increasing trend in the last 50 years, while the frost days (FD0), cold nights (TN10P) and cold days (TX10P) show a decreasing trend, and the changes are all significant. The annual total precipitation in wet days (PRCPTOT), very heavy precipitation days (R25mm), very wet days (R95P), extremely wet days (R99P) and simple precipitation intensity index (SDII), which represent the extreme precipitation and the intensity of extreme precipitation, all show an increasing trend, indicating that the extreme high temperature and extreme precipitation in Sichuan and Chongqing Region have been increasing. The extreme indices show an increasing trend in all three types of meteorological sites. The increasing trend of TXx, TNx, TR20, TX90P and daily temperature range (DTR) are most obvious in urban stations, and FD0, TN10P, TX10P and DTR are most obvious in rural stations. Urbanization has basically no effects on TXx and TN90P at rural-urban sites, but has a greater effect on the monthly TXn, TNn, FD0, TR20 and DTR at rural and urban sites, as well as the number of TN10P and TN90P at urban sites. In Sichuan and Chongqing Region, among the rural sites, all indices show a significant increasing trend except for the monthly maximum 1-day precipitation (RX1DAY), monthly maximum 5-day precipitation (RX5DAY) and consecutive wet days (CWD), which show a non-significant decreasing trend. The influence of urbanization causes a decreasing trend in the number of heavy precipitation days (R10mm), R25mm, RX1DAY, RX5DAY, R95P and PRCPTOT in urban-rural and urban sites, and causes an increasing trend in SDII and CWD. The urbanization effects contribute 100.00% to R10mm, RX1DAY, RX5DAY, R95P and PRCPTOT for both urban-rural and urban sites.
-

图 1 研究区地理位置和高程(填色)分布
Fig. 1 Geographical location and elevation(the shaded) of the target area
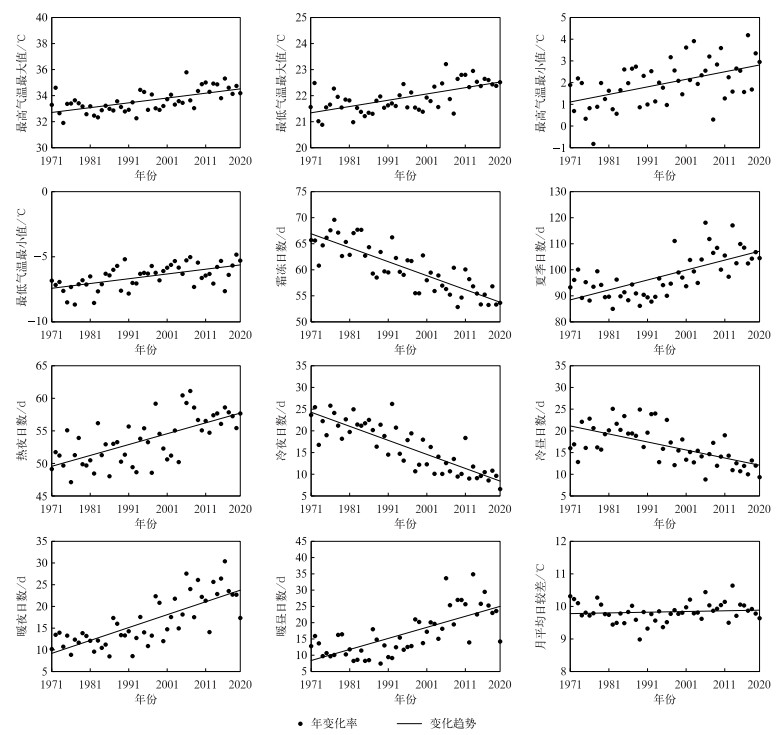
图 2 1971—2020年川渝地区极端温度指数时间序列
Fig. 2 Time series of extreme temperature indices in Sichuan-Chongqing Region in 1971-2020
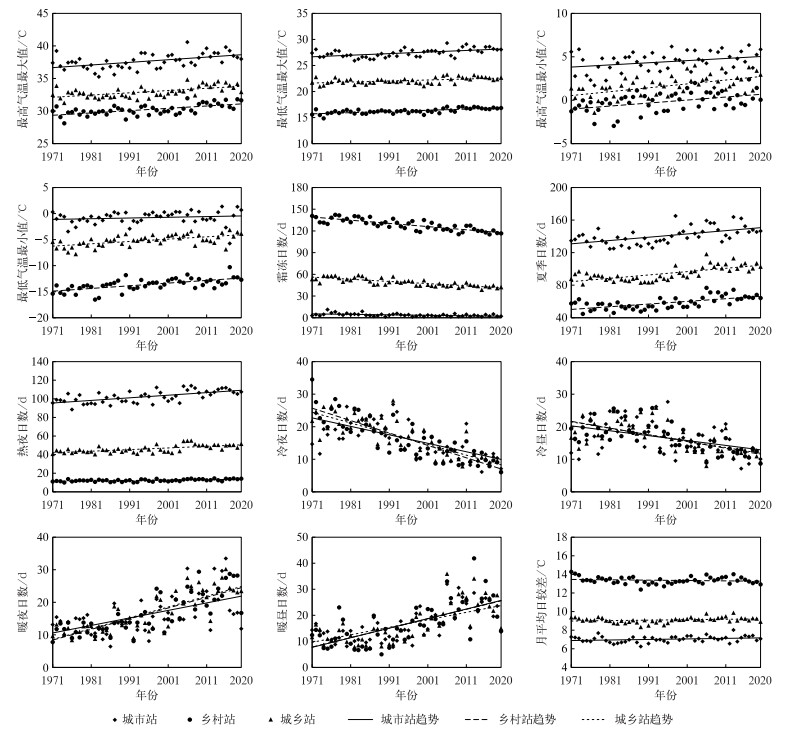
图 3 1971—2020年川渝地区不同类型气象站极端温度指数时间序列
Fig. 3 Time series of extreme temperature indices at different types of meteorological stations in Sichuan-Chongqing Region in 1971-2020
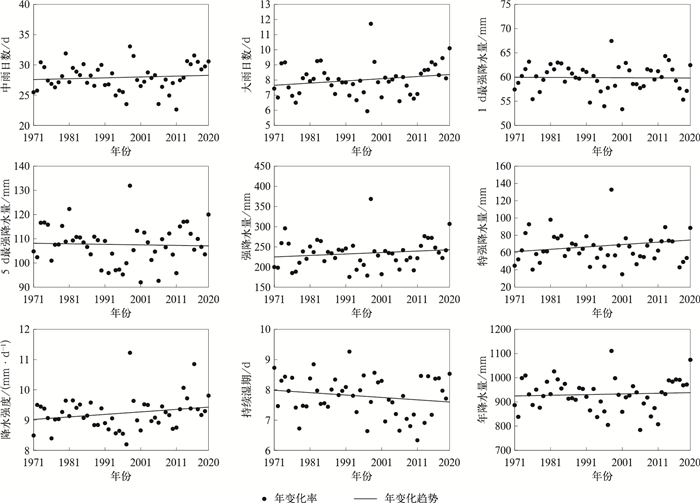
图 4 1971—2020年川渝地区极端降水指数时间序列
Fig. 4 Time series of extreme precipitation indices in Sichuan-Chongqing Region in 1971-2020
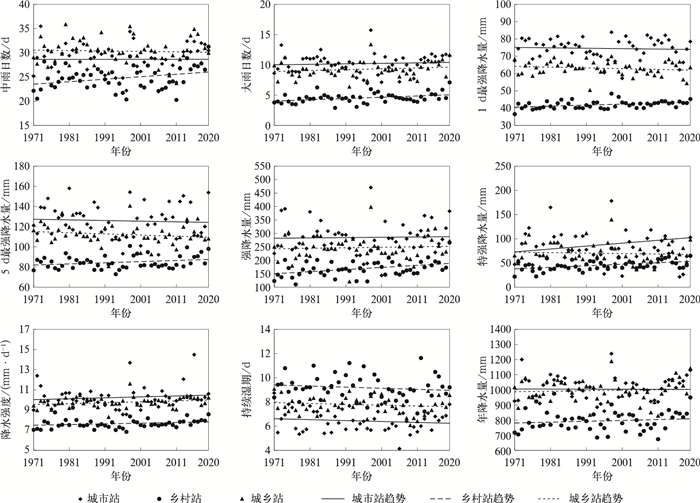
图 5 1971—2020年川渝地区不同类型气象站极端降水指数时间序列
Fig. 5 Time series of extreme precipitation indices at different types of meteorological stations in Sichuan-Chongqing Region in 1971-2020
表 1 极端气候指数定义
Table 1 Definitions of extreme climate indices
指数类型 分类 名称 指数缩写 定义 单位 极端温度指数 极值指数 最高气温最大值 TXx 每月平均日最高气温最大值 ℃ 最低气温最大值 TNx 每月平均日最低气温最大值 ℃ 最高气温最小值 TXn 每月平均日最高气温最小值 ℃ 最低气温最小值 TNn 每月平均日最低气温最小值 ℃ 绝对指数 霜冻日数 FD0 一年中日最低气温小于0℃的日数 d 夏季日数 SU25 一年中日最高气温大于25℃的日数 d 热夜日数 TR20 一年中日最低气温大于20℃的日数 d 相对指数 冷夜日数 TN10P 日最低气温小于10%分位值的日数 d 冷昼日数 TX10P 日最高气温小于10%分位值的日数 d 暖夜日数 TN90P 日最低气温大于90%分位值的日数 d 暖昼日数 TX90P 日最高气温大于90%分位值的日数 d 其他指数 月平均日较差 DTR 日最高气温和日最低气温之差的月平均值 ℃ 极端降水指数 绝对指数 中雨日数 R10mm 日降水量大于10 mm的日数 d 大雨日数 R25mm 日降水量大于25 mm的日数 d 1 d最大降水量 RX1DAY 一年中最大日降水量 mm 5 d最大降水量 RX5DAY 一年中连续5 d最大日降水量 mm 相对指数 强降水量 R95P 日降水量大于95%分位值的年累积降水量 mm 特强降水量 R99P 日降水量大于99%分位值的年累积降水量 mm 降水强度 SDII 年降水量与湿日日数(日降水量大于1 mm)的比值 mm·d-1 持续指数 持续湿期 CWD 日降水量大于1 mm的最大持续降水日数 d 其他指数 年降水量 PRCPTOT 日降水量大于1 mm的日累积量值 mm  下载: 导出CSV
表 2 川渝地区极端温度指数年代际变化率
Table 2 Interdecadal change rates of extreme temperature indices in Sichuan-Chongqing Region
分类 指数 变化率 极值指数 最高气温最大值 0.37℃·(10 a)-1 最低气温最大值 0.24℃·(10 a)-1 最高气温最小值 0.35℃·(10 a)-1 最低气温最小值 0.37℃·(10 a)-1 绝对指数 霜冻日数 -2.68 d·(10 a)-1 夏季日数 3.82 d·(10 a)-1 热夜日数 1.67 d·(10 a)-1 相对指数 冷夜日数 -3.24 d·(10 a)-1 冷昼日数 -1.85 d·(10 a)-1 暖夜日数 2.97 d·(10 a)-1 暖昼日数 3.39 d·(10 a)-1 其他指数 月平均日较差 0.02℃·(10 a)-1* 注:*表示达到0.1显著性水平,未标注表示达到0.01显著性水平。
下载: 导出CSV
表 3 极端温度指数的城市化影响
Table 3 Urbanization effects of extreme temperature indices
分类 指数 A1 A2 A3 ΔA21 ΔA31 E21/% E31/% 极值指数 最高气温最大值 0.36 0.35 0.41 0.01 0.05 2.44 12.20 最低气温最大值 0.23 0.19 0.30 -0.05 0.06 13.33 23.33 最高气温最小值 0.35 0.45 0.25** 0.10 -0.10 40.00 40.00 最低气温最小值 0.51 0.45 0.14** -0.06 -0.37 42.86 100.00 绝对指数 霜冻日数 -4.41 -2.99 -0.65 1.42 3.76 100.00 100.00 夏季日数 3.29 4.11 4.05 0.82 0.76 20.25 18.77 热夜日数 0.45 1.76 2.80 1.31 2.35 46.79 83.93 相对指数 冷夜日数 -3.81 -3.30 -2.60 0.51 1.21 19.62 46.54 冷昼日数 -2.07 -1.97 -1.50 0.10 0.57 6.67 38.00 暖夜日数 3.28 3.31 2.31 -0.03 -0.97 1.30 41.99 暖昼日数 2.88 3.63 3.67 0.75 0.79 20.44 21.53 其他指数 月平均日较差 -0.04*** 0.05** 0.06** 0.09 0.01 100.00 100.00 注:**表示达到0.05显著性水平,***表示未达到0.05显著性水平,未标注表示达到0.01显著性水平。
下载: 导出CSV
表 4 川渝地区极端降水指数年代际变化率
Table 4 Interdecadal change rates of extreme precipitation indices in Sichuan-Chongqing Region
分类 指数 变化率 绝对指数 中雨日数 0.14 d·(10 a)-1 大雨日数 0.15 d·(10 a)-1 ** 1 d最大降水量 -0.03 mm·(10 a)-1 5 d最大降水量 -0.22 mm·(10 a)-1 相对指数 强降水量 3.63 mm·(10 a)-1* 特强降水量 2.75 mm·(10 a)-1* 降水强度 0.08(mm ·d)-1·(10 a)-1* 持续指数 持续湿期 -0.08 d·(10 a)-1 其他指数 年降水量 2.77 mm·(10 a)-1* 注:*和**分别表示达到0.1,0.05显著性水平。
下载: 导出CSV
表 5 极端降水指数的城市化影响
Table 5 Urbanization effects of extreme precipitation indices
分类 指数 A1 A2 A3 ΔA21 ΔA31 E21/% E31/% 绝对指数 中雨日数 0.51** -0.09 0.01 -0.60 -0.50 100.00 100.00 大雨日数 0.21*** 0.15* 0.08 -0.06 -0.13 75.00 100.00 1 d最大降水量 0.57*** -0.43 -0.24 -1.00 -0.81 100.00 100.00 5 d最大降水量 1.13* -1.14 -0.64 -2.27 -1.77 100.00 100.00 相对指数 强降水量 7.85*** 1.84 11 -6.01 -6.65 100.00 100.00 特强降水量 3.15*** -0.94 6.04 -4.09 2.89 67.72 47.85 降水强度 0.07*** 0.09** 0.09 0.02 0.02 22.22 22.22 持续指数 持续湿期 -0.09 -0.07 -0.08 0.02 0.01 25.00 12.50 其他指数 年降水量 5.62** 3.17 -0.47 -2.45 -6.09 100.00 100.00 注:*,**和***分别表示达到0.1,0.05和0.01显著性水平。
下载: 导出CSV
-
[1] 姜彤, 翟建青, 罗勇, 等.气候变化影响适应和脆弱性评估报告进展:IPCC AR5到AR6的新认知.大气科学学报, 2022, 45(4):502-511. https://www.cnki.com.cn/Article/CJFDTOTAL-NJQX202204003.htmJiang T, Zhai J Q, Luo Y, et al. Advances in climate change impact adaptation and vulnerability assessment reporting: New perceptions from IPCC AR5 to AR6. Trans Atmos Sci, 2022, 45(4): 502-511. https://www.cnki.com.cn/Article/CJFDTOTAL-NJQX202204003.htm [2] 林爱兰, 谷德军, 彭冬冬, 等. 近60年我国东部区域性持续高温过程变化特征. 应用气象学报, 2021, 32(3): 302-314. doi: 10.11898/1001-7313.20210304Lin A L, Gu D J, Peng D D, et al. Climatic characteristics of regional persistent heat event in in the eastern China during recent 60 years. J Appl Meteor Sci, 2021, 32(3): 302-314. doi: 10.11898/1001-7313.20210304 [3] 宝兴华, 夏茹娣, 罗亚丽, 等. "21·7"河南特大暴雨气象和水文雨量观测对比. 应用气象学报, 2022, 33(6): 668-681. doi: 10.11898/1001-7313.20220603Bao X H, Xia R D, Luo Y L, et al. Comparative analysis on meteorological and hydrological rain gauge observations of the extreme heavy rainfall event in Henan Province during July 2021. J Appl Meteor Sci, 2022, 33(6): 668-681. doi: 10.11898/1001-7313.20220603 [4] United Nations, Department of Economic and Social Affairs, Population Ddivision. World Urbanization Prospects: The 2018 Revision. New York: United Nations, 2018. [5] 彭艳玉, 刘煜, 缪育聪. 温室气体对亚洲夏季风影响的数值研究. 应用气象学报, 2021, 32(2): 245-256. doi: 10.11898/1001-7313.20210209Peng Y Y, Liu Y, Miao Y C. A numerical study on impacts of greenhouse gases on Asian summer monsoon. J Appl Meteor Sci, 2021, 32(2): 245-256. doi: 10.11898/1001-7313.20210209 [6] 罗鑫玥, 陈明星. 城镇化对气候变化影响的研究进展. 地球科学进展, 2019, 34(9): 984-997. https://www.cnki.com.cn/Article/CJFDTOTAL-DXJZ201909012.htmLuo X Y, Chen M X. Research progress on the impact of urbanization on climate change. Adv Earth Sci, 2019, 34(9): 984-997. https://www.cnki.com.cn/Article/CJFDTOTAL-DXJZ201909012.htm [7] 王钊, 罗慧, 李亚丽, 等. 近50年秦岭南北不均匀增温及对城市化响应. 应用气象学报, 2016, 27(1): 85-94. doi: 10.11898/1001-7313.20160109Wang Z, Luo H, Li Y L, et al. Effects of urbanization on temperatures over the Qinling Mountains in the past 50 years. J Appl Meteor Sci, 2016, 27(1): 85-94. doi: 10.11898/1001-7313.20160109 [8] Karl T, Diaz H, Kukla G. Urbanization: Its detection and effect in the United States climate record. J Climate, 1988, 1: 1099-1123. doi: 10.1175/1520-0442(1988)001<1099:UIDAEI>2.0.CO;2 [9] Sun Y, Hu T, Zhang X, et al. Contribution of global warming and urbanization to changes in temperature extremes in Eastern China. Geophys Res Lett, 2019, 46: 11426-11434. doi: 10.1029/2019GL084281 [10] 唐国利, 任国玉, 周江兴. 西南地区城市热岛强度变化对地面气温序列影响. 应用气象学报, 2008, 19(6): 722-730. doi: 10.3969/j.issn.1001-7313.2008.06.012Tang G L, Ren G Y, Zhou J X. Change of urban heat island intensity and its effect on surface mean air temperature records in Southwest China. J Appl Meteor Sci, 2008, 19(6): 722-730. doi: 10.3969/j.issn.1001-7313.2008.06.012 [11] 任国玉, 张雷, 卞韬, 等. 城市化对石家庄站日气温变化的影响. 地球物理学报, 2015, 58(2): 398-410. https://www.cnki.com.cn/Article/CJFDTOTAL-DQWX201502005.htmRen G Y, Zhang L, Bian T, et al. Urbanization effect on change of daily temperature at Shijiazhuang Weather Station. Chinese J Geophys, 2015, 58(2): 398-410. https://www.cnki.com.cn/Article/CJFDTOTAL-DQWX201502005.htm [12] Shepherd J, Pierce H, Negri A. Rainfall modification by major urban areas: Observations from spaceborne rain radar on the TRMM satellite. J Appl Meteor Climatol, 2002, 41(7): 689-701. doi: 10.1175/1520-0450(2002)041<0689:RMBMUA>2.0.CO;2 [13] Wu M W, Luo Y L, Chen F, et al. Observed link of extreme hourly precipitation changes to urbanization over coastal South China. J Appl Meteor Climatol, 2019, 58: 1799-1819. doi: 10.1175/JAMC-D-18-0284.1 [14] 何玉秀, 许有鹏, 李子贻, 等. 城镇化对极端降水的影响及其贡献率研究——以太湖平原地区为例. 湖泊科学, 2022, 34(1): 262-271. https://www.cnki.com.cn/Article/CJFDTOTAL-FLKX202201021.htmHe Y X, Xu Y P, Li Z Y, et al. The impacts and its contribution rate of urbanization on extreme precipitation, 1976-2015: A case study in the Lake Taihu Plain Region. Lake Sci, 2022, 34(1): 262-271. https://www.cnki.com.cn/Article/CJFDTOTAL-FLKX202201021.htm [15] 张小玲, 刘梦娜, 青泉, 等. 1960—2018年成都地区极端气温变化及城市化贡献分析. 高原山地气象研究, 2022, 42(1): 10-17. https://www.cnki.com.cn/Article/CJFDTOTAL-SCCX202201002.htmZhang X L, Liu M N, Qing Q, et al. Extreme temperature change and urbanization contribution in Chengdu from 1960 to 2018. Plateau Mountain Meteor Res, 2022, 42(1): 10-17. https://www.cnki.com.cn/Article/CJFDTOTAL-SCCX202201002.htm [16] 黄晓远, 李谢辉. 基于CMIP6的西南暴雨洪涝灾害风险未来预估. 应用气象学报, 2022, 33(2): 231-243. doi: 10.11898/1001-7313.20220209Huang X Y, Li X H. Future projection of rainstorm and flood disaster risk in Southwest China based on CMIP6 models. J Appl Meteor Sci, 2022, 33(2): 231-243. doi: 10.11898/1001-7313.20220209 [17] Wang H, Yan Y, Long K, et al. Relationships between rapid urbanization and extreme summer precipitation over the Sichuan-Chongqing Area of China. Earth Sci, 2022, 10. DOI: 10.3389/feart.2022.909547. [18] 罗辉, 肖递祥, 匡秋明, 等. 四川盆地暖区暴雨的雷达回波特征及分类识别. 应用气象学报, 2020, 31(4): 460-470. doi: 10.11898/1001-7313.20200408Luo H, Xiao D X, Kuang Q M, et al. Radar echo characteristics and recognition of warm-sector torrential rain in Sichuan Basin. J Appl Meteor Sci, 2020, 31(4): 460-470. doi: 10.11898/1001-7313.20200408 [19] 中华人民共和国国家统计局. 中国统计年鉴2021. 北京: 中国统计出版, 2021.National Bureau of Statistics of the People's Republic of China. China Statistical Yearbook 2021. Beijing: China Statistics Press, 2021. [20] 付晶莹, 江东, 黄耀欢. 中国公里网格人口分布数据集. 全球变化科学数据出版系统, 2014.Fu J Y, Jiang D, Huang Y H. China Km-grid Population Distribution Dataset. Global Change Scientific Data Publishing System, 2014. [21] 黄耀欢, 江东, 付晶莹. 中国公里网格GDP分布数据集. 全球变化科学研究数据出版系统, 2014.Huang Y H, Jiang D, Fu J Y. China Km-grid GDP Distribution Dataset. Global Change Scientific Data Publishing System, 2014. [22] Alexander L, Zhang X, Peterson T, et al. Global observed changes in daily climate extremes of temperature and precipitation. J Geophys Res Atmos, 2006, 111. DOI: 10.1029/2005JD006290. [23] WMO. 2010: Report of the Meeting of the Management Group of the Commission for Climatology. Geneva, 2010. [24] 周雅清, 任国玉. 城市化对华北地区极端气温事件频率的影响. 高原气象, 2014, 33(6): 1589-1598. https://www.cnki.com.cn/Article/CJFDTOTAL-GYQX201406014.htmZhou Y Q, Ren G Y. Urbanization effect on long-term trends of extreme temperature events in North China. Plateau Meteor, 2014, 33(6): 1589-1598. https://www.cnki.com.cn/Article/CJFDTOTAL-GYQX201406014.htm [25] 杨永安, 许肖云, 胡艳丽, 等. 成渝地区典型中小城市VOCs污染特征、臭氧生成潜势及来源分析. 中国环境监测, 2023, 39(2): 125-138. https://www.cnki.com.cn/Article/CJFDTOTAL-IAOB202302013.htmYang Y A, Xu X Y, Hu Y L, et al. Analysis of pollution characteristics, Ozone formation potential and sources of ambient VOCs on typical small and medium-sized cities in Chengdu-Chongqing Region. Environ Monit China, 2023, 39(2): 125-138. https://www.cnki.com.cn/Article/CJFDTOTAL-IAOB202302013.htm [26] Cao C, Lee X H, Liu S D, et al. Urban heat islands in China enhanced by haze pollution. Nat Commun, 2016, 7. DOI: 10.1038/ncomms12509. [27] 肖丹, 陈静, 陈章, et al. 成都精细下垫面信息对城市气象影响的模拟试验. 气象, 2011, 37(3): 298-308. https://www.cnki.com.cn/Article/CJFDTOTAL-QXXX201103008.htmXiao D, Chen J, Chen Z, et al. Effect simulation of Chengdu underlying surface information on urban meteorology. Meteor Mon, 2011, 37(3): 298-308. https://www.cnki.com.cn/Article/CJFDTOTAL-QXXX201103008.htm [28] Zhao L, Li X H, Smith R B, et al. Strong contributions of local background climate to urban heat islands. Nature, 2014, 511: 216-219. [29] 赵旋, 吴遥, 冯勇, 等. 成都城市化发展对局地气候的影响. 高原山地气象研究, 2021, 41(4): 100-107. https://www.cnki.com.cn/Article/CJFDTOTAL-SCCX202104014.htmZhao X, Wu Y, Feng Y, et al. Influence of Chengdu urban development on local climate. Plateau Mountain Meteor Res, 2021, 41(4): 100-107. https://www.cnki.com.cn/Article/CJFDTOTAL-SCCX202104014.htm [30] Han W C, Li Z Q, Wu F, et al. The mechanisms and seasonal differences of the impact of aerosols on daytime surface urban heat island effect. Atmos Chem Phys, 2020, 20(11): 6479-6493. [31] 王成鑫, 高守亭, 冉令坤, 等. 四川地形扰动对降水分布影响. 应用气象学报, 2019, 30(5): 586-597. doi: 10.11898/1001-7313.20190507Wang C X, Gao S T, Ran L K, et al. Effects of topographic perturbation on the precipitation distribution in Sichuan. J Appl Meteor Sci, 2019, 30(5): 586-597. doi: 10.11898/1001-7313.20190507 [32] 袁宇锋, 翟盘茂. 全球变暖与城市效应共同作用下的极端天气气候事件变化的最新认知. 大气科学学报, 2022, 45(2): 161-166. https://www.cnki.com.cn/Article/CJFDTOTAL-NJQX202202001.htmYuan Y F, Zhai P M. Latest understanding of extreme weather and climate events under global warming and urbanization influences. Trans Atmos Sci, 2022, 45(2): 161-166. https://www.cnki.com.cn/Article/CJFDTOTAL-NJQX202202001.htm [33] 刘海知, 徐辉, 包红军, 等. 机器学习分类算法在降雨型滑坡预报中的应用. 应用气象学报, 2022, 33(3): 282-292. doi: 10.11898/1001-7313.20220303Liu H Z, Xu H, Bao H J, et al. Application of machine learning classification of algorithm to precipitation-induced landslides forecasting. J Appl Meteor Sci, 2022, 33(3): 282-292. doi: 10.11898/1001-7313.20220303 -

计量
- 摘要浏览量: 504
- HTML全文浏览量: 65
- PDF下载量: 106
- 被引次数: 0
