Vol.14, NO.6, 2003

Display Method:
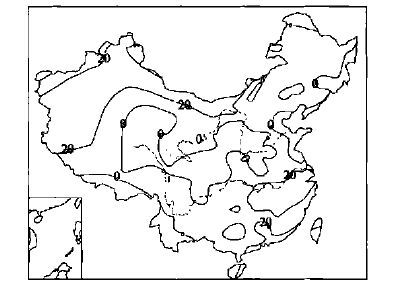
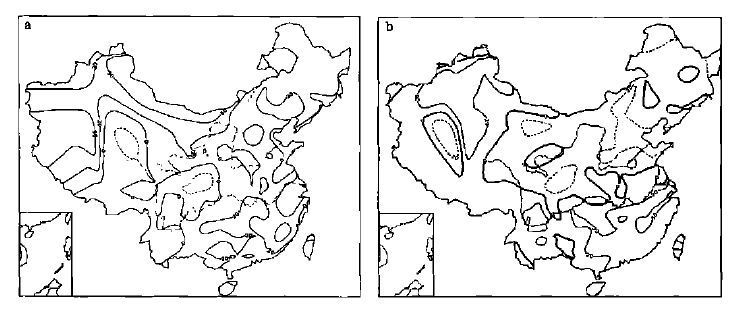
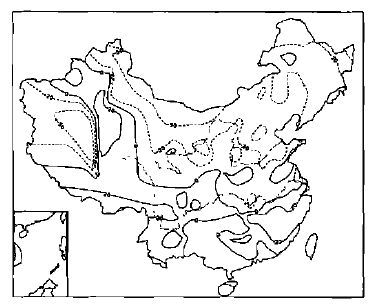
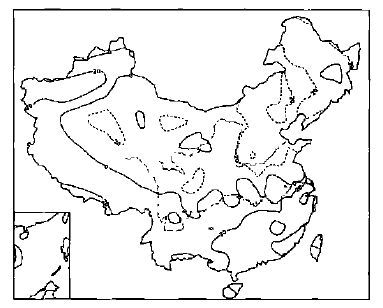
DECADE CLIMATE CHARACTERS AND FORMATION CONDITION OF FLOODING IN SOUTH AND DROUGHT IN NORTH IN CHINA
Sun Linhai, Chen Xingfang
2003, 14(6): 641-647.
Abstract:
According to the analysis of the decade and interannual climate character variation of summer precipitation in recent fifty years and decade climate variation of continental high over Asia and ENSO event, the distribution of summer precipitation in recent years is contrasted. The result indicates that the distribution of summer precipitation had great change from the latter of the 1990s. The changeable distribution trends of flooding and drought in summer in the 1990s and the beginning of this century are analyzed. It is found that the decade climate character of summer precipitation had obvious change in recent years in our country. The main rain belt of the 1990s was in the Yangtze River to the north of Jiangnan areas. The decade climate character was that the precipitation was more than normal in the north and the south of China and less than normal in the middle areas. From the beginning of the end of last century, the main rain belt was located the south of the Yangtze River to South China, and the North probably entered into dry spell. It may come into the decade climate period of flooding in the south and drought in the north in summer. According the analysis, the climate character of precipitation change in recent summers related to the main rain belt moving trend from north to south, and it also related to the influence of the climate change of atmospheric circulation, especially East Asia continental high. The warm water of the equator Pacific also took the corresponding effect to decade climate change of summer precipitation. It is concluded that the summer precipitation will still has the climate character that the precipitation is more than normal in south and less in north, therefore the drought climate trend of the north will be more rigorous. It is highly important to predict the decade climate variation and short-term climate variation of summer precipitation.
APPLICATION OF A NEW DOWNSCALING MODEL TO MONTHLY PRECIPITATION FORECAST
Chen Lijuan, Li Weijing, Zhang Peiqun, Wang Jingui
2003, 14(6): 648-655.
Abstract:
A relationship between monthly mean precipitation and monthly mean circulation represented by 500 hPa geo-potential height was given to combine dynamical and statistical approaches. The physical explanations of monthly mean circulation and precipitation were also presented. Statistical weights of each item of the relationship (the downscaling model) were derived from the monthly NCEP/NCAR reanalysis data (500 hPa) and China's observed precipitation data during the control period from January of 1951 to December of 1991. The hindcast test was conducted using those data from January of 1992 to December of 2001. The test indicates that the method (new model) has a high score skill for monthly mean precipitation forecast. Comparison of monthly forecast of precipitation amounts between the issued operational forecast and the new model using the 500 hPa height forecast obtained from T63/NCC GCM from January to June 2002 shows that the new model forecast has a higher score than the issued operational forecast result.
CASE STUDY OF A SERIES OF SEVERE CONVECTIVE STORMS BASED ON CHINA NEW GENERATION (DOPPLER) WEATHER RADAR DATA
Liao Yufang, Yu Xiaoding, Guo Qing
2003, 14(6): 656-662.
Abstract:
Three severe convective storms occurring between 19:00 and 21:00 on 14 May 2002 in Changde area, Hunan Province are analyzed based on the new generation (Doppler) weather radar data. These severe storms led to heavy damage, producing wind gust as high as 26 m/s, 30 mm diameter large hails and tornado, in consistency with the radar observations. Among the three convective storms, two are supercell storms and one is squall line. The mesocyclones associated with the two supercells are identified. Both supercell storms produce the Three-Body Scatter Spike (TBSS), with the value of the reflectivity core over 70 dBz. A TWS (Tornadic Vortex Signature) associated with the second supercell storm is identified. Both the Three-Body Scatter Spike (TBSS) and Tornadic Vortex Signature (TVS), associated with large hails and tornado, respectively, have been observed for the first time in China, and large hails and tornado have been confirmed by the surface reports. Research results indicate that the TBSS can be used as a nowcasting index of large hails and high wind.
THE INFLUENCE OF INITIAL CONDITION ADJUSTMENT USING SATELLITE-DERIVED HUMIDITY ON PRECIPITATION FORECASTING
Qi Yanjun, Wang Hanjie, Cheng Ming hu
2003, 14(6): 663-673.
Abstract:
To improve the accuracy of model initial field, a preliminary analysis of the impact of initial condition adjustment using satellite-derived humidity on the precipitation forecasting is carried out. Taking the wet-adiabatic equation as integral equation, the humidity field on each standard isobaric surface derived from satellite TBB-data is used to improve the model initial conditions. An inter-comparison study is carried on between the satellite-derived humidity and T106 objective analyzed humidity. It is found that there is a big difference between the model-outputs driven by two different humidity fields. The simulation results driven by satellite-derived humidity depict the upper air humidity distribution above the precipitation region very well. Thus, a data assimilation technique based on the meso-scale model MM5 is performed to assimilate the conventional observation data and the high-resolution satellite-derived data. A rainstorm case is simulated in order to compare the precipitation forecast capability with different initial fields. The experiments show that when the satellite-derived humidity is assimilated into the initial condition, both the intensity and the area of simulated precipitation are more close to the measured precipitation as compared with those only using the conventional observations.
CHARACTERISTICS OF SURFACE WIND SPEED FIELD AT WENTOUZI REGION IN EAST LIAONING PROVINCE
Ma Yanjun, Liu Wanjun, Yang Hongbin, Zhang Yunhai
2003, 14(6): 674-681.
Abstract:
Based on wind field diagnostic model and atmospheric diffusion experimental data in winter and summer seasons of 1993 at Wentouzi region in the east of Liaoning Province, the horizontal wind field pattern at nuclear-power station is analyzed. The results indicate that there are three kinds of the horizontal wind fields in winter season: 1) southerly wind fields; 2) northerly wind fields; and 3) the nuclear-powered site is located between high pressure and low pressure, or the whole region is located in an averaged pressure field, while system wind flows weakly, mountain-valley wind flows obviously, and the surface wind field in this area is not obvious. There are four kinds of the horzontal wind fields in summer season: 1) southerly wind field; 2) land-sea wind field; 3) shear of wind field; 4) northerly wind field. This study provides the basic parameters and theoretical guidance for evaluating air-pollution in this region.
SHORT-TERM SAND-DUST STORM FORECASTING METHOD RESEARCH IN GANSU PROVINCE
Wang Xiwen, Niu Ruoy un, Ji Lanzhi, Sun Landong, Zhang Tiejun, Lu Dengrong
2003, 14(6): 682-690.
Abstract:
According to the observational data from 1955 to 2002 at 80 stations in Gansu Province, 64 examples of stronger sand-dust storm occurring in the province are analyzed. Their climate, weather circumstances, influential system, influential range, the cold air source, cloudy features, and conception diagnosis are studied. The climate characteristics, the weather patterns and the moving tracks of sandstorm in Gansu Province are summarized. The short-term forecasting methods of sand-dust storm are built, and the short-term forecasting conception model is given. Applying the computer language and model design method, the sand-dust storm monitoring and forecasting platform is successfully built to achieve the practical need of sand-dust storm monitoring and forecasting.
APPLICATION OF PRACTICAL BLACKBODY TECHNIQUE TO DIGITAL PHOTOGRAPHY VISIOMETER SYSTEM
Lu Weitao, Tao Shanchang, Tan Yongbo, Liu Yifeng
2003, 14(6): 691-699.
Abstract:
In Digital Photography Visiometer System (DPVS), the uncertainty, caused by the difficulty in real time measurement of the inherent brightness of targets, can be reduced even eliminated by using practical blackbody technique.The visibility measurement error caused by non-blackbody target is analyzed.It is shown that the relative measurement error increases along with the increase of the visibility and the target's reflectivity.To ensure the measurement precision, the target with reflectivity low enough is required.The relations between the near-axis hemispherical-directional reflectivity and the feature parameters of practical blackbody with cuboid st ructure are calculated using multi-reflect method.Without observing the inner side of the practical blackbody, the axial reflectivity is maximum, and the reflectivity decreases as the angle that departs from axis increases.The axial reflectivity sharply deceases as the ratio of body length to aperture side length increases, while the change caused by increase of body width is not obvious.Additionally, in consideration of dispersion imaging, the equation used to compute the blackbody's minimum aperture size required is presented.These results provide the criteria for selecting parameters of practical blackbody in DPVS.Finally, the comparison results of visibilities calculated from observing a blackbody and from a non-blackbody target are show n, and they sufficiently indicate that it is necessary and feasible to adopt the practical blackbody technique in DPVS.
STUDY OF CHANGES OF VEGETATION AND SNOW AREA IN QILIAN MOUNTAINS USING METEOROLOGY SATELLITE DATA
Guo Ni, Yang Lanfang, Li Minxuan
2003, 14(6): 700-707.
Abstract:
The characters of vegetation spatial distribution and changes in Qilian Mountains are analyzed using NOAA meteorology satellite data in 1989 and 1998. The changing features of snow area in Qilian Mountains are studied using the same data. The results show that the vegetation of the main body of the mountain is degenerating and the major degenerating vegetation are shrubbery and grass. The basic annual changing characteristic for the snow area is double peak style, but there are differences in the changes of the snow area among each river valley. The ten-day averaged snow area in 1998 is lesser than that in 1989. The decrease extent of the snow area is gradually increased from west to east. The snow area decreased 2.17% in Danghe valley (in the west of the mountains) and 10.05% in Xiyinghe valley (in the east of the mountains). The changing features of snow area in 1998 was similar to in 1989 in spring and the snow area in 1998 was obvious lesser than in 1989 in winter. Because the temperature in 1998 is much higher in 1989, the velocity of snow melting in 1998 is faster than in 1989.
AUTO-IDENTIFYING FOREST FIRE-POINTS IN METEOROLOGICAL SATELLITE IMAGES BASED ON NEURAL NETWORK
Liang Yitong, Hu Jianglin, Xie Ping, Liu Liangming
2003, 14(6): 708-714.
Abstract:
Identification of forest fire-points in meteorological satellite images is the basis of monitoring forest fire using meteorological satellite data. The traditional approach of identification is visual interpretation. In the visual interpretation, better precision is obtained in practice, but experienced interpreter is needed and it is difficult to settle for auto-identification with computer, so that there is always unfavorable in the description of information distribution and the improvement of efficiency. In order to find out the forest fire in time and eradicate it quickly, it is very significant to make the fire-points auto-identified without reducing the precision. The artificial neural network theory (short for NN) developing rapidly in recent years provides a new means for solving this problem. NN has the basal characters of human brains, such as learning, recollecting and generalizing. The peculiarity of NN is massive parallel computing, distributive memory of information, nonlinear dynamics of consecutive time, global behaviour, great fault-tolerance and robust, self-organization, self-learning and real time processing. BP (Back Propagation Learning Algorithm) model is a NN used widely. The method using BP model to automatically identify fire-points in meteorological satellite images are discussed and the test in the range of Hubei Province is presented. Besides the NOAA/AVHRR data from 1994 to 1999, the earth's surface distribution is used. 43 meteorological satellite images with fire-points are selected, and 31 of them are regarded as trained collection, the others as tested collection. The result of the test shows that a fire-point is correlative with 7 character factors, which are the radiation-values of the 5 channels of NOAA/AVHRR, the earth's surface distribution and the difference of the contiguous temperature. The disciplined NN has recollected the characters of fire-points and non-points and has ability to identify points in images. Comparing NN with visual interpretation, the conclusion is drawn that NN can auto-identify fire-points in meteorological satellite images with the almost same precision.
REMOTE SENSING INVESTIGATION OF ENVIRONMENTAL RESOURCES AND COMPREHENSIVE CLIMATE DIVISION
Wei Li, Yin Jianmin, Huang Shue, Li Yingchun
2003, 14(6): 715-721.
Abstract:
Based on the CBERS1/CCD data, GIS and GPS techniques, and combined with conventional data and field investigation, digital image processing and classifying methods are applied to interpret resources of landuse, water and forest in Guixi city, Jiangxi Province. Some GPS locating data are chosen to interpret image, others remaining to check up image-classified results, which improved the objectivity and efficiency of interpreting image. By use of section observational data in subtropical mountainous regions and locating data for seventeen years in Guixi mountain region, twelve models are built to describe changes of climate factors with heights. On the basis of interpolating digital counter onto each 20-meter grid, the climate resources in the grid are calculated. Consequently, seven kinds of crop's comprehensive climate division are given by means of logical arithmetic of GIS space analysis models. Also the results of divisions are analyzed.
ESTIMATION OF ACTUAL EVAPOTRANSPIRATION FOR MAIZE FIELD IN NORTH CHINA
Lu Houquan, Qian Shuan, Yang Feiyun, Bai Yueming
2003, 14(6): 722-728.
Abstract:
For simplifying the calculation of actual evapotranspiration in cropped field, the soil moisture of the depth from 0 to 300 cm in the maize field and the meteorological observational data in 1999 at Dingxin county in Hebei Province, where is an agrometeorological experiment base of Chinese Academy of Meteorological Sciences, and the soil moisture of the depth from 0 to 50 cm and the meteorological observational data at 5 stations in North China from 1991 to 1995 are used. The possibility that actual evapotranspiration in the maize field is calculated by using a simple reference evapotranspiration model is examined. Prisetley-Taylor modeland FAO Penman-Mentaith (1998) model are compared and the factors impacting on evapotranspiration are discussed. Based on the experimental data and using leaf area coefficient and mean soil relative moisture as the model factors. A formula calculating actual evapotranspiration is made. Evapotranspiration is calculated by this formula, and the soil moisture of the depth from 0 to 50 cm and the meteorological observational data at 8 stations from 1999 to 2000 are applied to validate. The average errors are in the range from 10% to 15% generally.
A COMPARING ANALYSIS ON SUBJECTIVE AND OBJECTIVE WEATHER FORECAST
Deng Xuejiao, Hu Sheng, Yan Jinghua
2003, 14(6): 729-738.
Abstract:
The qualities of weather forecast in Guangzhou city of five information from April to December in 2001 are tested, the time span of forecast is 24, 38, 72 hours ahead, and the tested elements are precipitation and temperature. For precipitation, the common weather of line or rain, and weather of heavy rain have been tested respectively by using the methods of operational appraisal and Ts valuation. As for temperature forecast, the variance and graded statistics have been computed. The analyses show that for the common weather forecast of fine or rain, the forecast qualities of HRMM are generally better than others, and having good stability. For 24 hours ahead, the forecast qualities of forecasters are equal to the model, but for 24~28 hours ahead, generally the model prediction is superior to other methods. All methods have poor abilities to predict the heavy rain. The Ts valuation reveals that the model has better ability to predict rain or not. For temperature forecast, generally the forecast qualities of forecaster are the best, but the HRMM has systematical error, the model forecasts are commonly lower than those of realities. For the forecasts of precipitation and temperature, the qualities of all methods are tending down with the growth of prediction time, and the errors of forecast quality of maximum temperature are always larger than that of minimum temperature.
ANALYSIS OF VARIANCE AND SPECTRUM FOR WIND IN SURFACE LAYER ON SUMMIT OF TAI MOUNTAIN
Wang Xiumei, Wang Haiying, Feng Lei, Ding Shanw en, Zhao Yong
2003, 14(6): 739-744.
Abstract:
The instability of wind in speed and direction can lead to vibration in the structure and can cause their damage. Wind over the summit of mountain affects less by locate landfrom and its flow pattern is the stability. As wind models, there is an important meaning for research the vibration by wind load on the building construction to the observation and analyses for wind turbulence over the summit of mountain. The changes of wind speed and direction under the various winds flowing through the Tai-mountain Weather Station are observed simultaneously per second. The observed samples are tested and of the normal distribution. A statistical analysis shows that the sample variance of wind direction is obviously more than the sample variance of wind speed. The curve diagrams of own and mutual spectral density of each sample of wind speed and direction are given. The spectrum diagrams show that the samples have the characteristic of red noise sequence, the curves of own and mutual spectral density of different sample have a similar shape, but the own spectral curve of wind speed fits best. There are two peak values in the spectral density curve at the period of 4 and 2 second.
THE ADVANCES AND DEVELOPMENTOF REMOTE SENSING APPLICATIONS TO LAND SURFACE PROCESS PARAMETERIZATION
Zhang Jiahua, Xu Xiangde, Yan Xiaodong, Mao Fei
2003, 14(6): 745-755.
Abstract:
Recent years, many meteorologists and climatologists pay more attention to land surface condition, which effects on the changes of heat, water and matter between land surface vegetation and climate in the condition of global climate change. On the one hand, it is widely recognized that there is a close relationship between and terrestrial ecosystem in global scale; the climate variations have significant impact on the vegetation distributional pattern and its growing rate and development. On the other hand, the global vegetation has a prominent feedback on climate through surface roughness length, albedo and evapotranspiration. The development of AGCM and Regional Climate Model (RCM) plays an important role for us to understand the relationship between climate change and terrestrial ecosystems change. In these models, many key biophysical parameters are required to act as input variables for each model runs. However, over past few years' studies suggest that the spatial distribution patterns for some input biophysical parameters (e. g. LAI, canopy conductance of water vapor and CO2 etc.) and relationship with bio-climate are obscure. These conditions affect the simulating precision to a great extent. Hence, it is essential to carry out the studies of parameters derived from spatial satellite data. At present, the development of remote sensing technology has provided a useful tool to study the land surface eco-process. In the current research, the important remote sensing information data used to study land surface process are analyzed. Then, the main applications of remote sensing information to land surface process parameterization are reviewed. Finally, the main problem and development of remote sensing information used in land surface process parameterization are discussed.
THE SATELLITE DATA ARCHIVE SYSTEMOF NATIONAL SATELLITE METEOROLOGICAL CENTER
Qian Jianmei, Zheng Xudong
2003, 14(6): 756-762.
Abstract:
Data is one of the most important resources in the information times. Because of the immensity capacity of meteorological satellite data, it is significant that how to save it permanent, access it automatically and process it standardization, and it is also one of the important tasks in the meteorological satellite data application field in the 21st century. More than 10TB data has been stored since the system running including raw data and various products of FY-1 series, FY-2 series, NOAA series, GMS series, EOS/MODIS series. The structure of satellite data archive system, the catalogue of storage data, the logical relationship of the hierarchical structure and the organizing of application software are discussed. The primary function and the flow chart of application software are also introduced.
RESEARCH ON PROCESSING TECHNOLOGY OF DIGITIZING GRAPH OF COLOR SCANNING———THE TESTING OF RESCUING TECHNOLOGY OF HISTORIC METEOROLOGICAL ARCHIVES
Wang Bomin
2003, 14(6): 763-768.
Abstract:
The digitizing processing of precipitation recording graph using the technology of color scanning graph is an effective test for rescuing historic meteorological archives. According to the precision analysis of digitizing precipitation recording graph and the features of color scanning, the research of processing technology of data access mode, distinguishing precipitation curve color and data processing are stressed to explore. The processing method of precipitation recording graph may furnish a thinking way and reference to other digitizing graph processing.