Vol.25, NO.2, 2014

Display Method:
ARTICLES
Experimental Research on Visibility Reference Standard for Blackbody Targets
Ma Shuqing, Xu Zhenfei, Mao Jietai, Liu Daxin, Zhang Chunbo, Yang Ling, Zhen Xiaoqiong
2014, 25(2): 129-134.
Abstract:
The reference standard system of blackbody visibility is composed of industrial camera, blackbody and industrial personal computer. With the industrial camera lens facing south, shooting blackbody and sky background, the chosen house is 680 meters away from the camera and the window of the house faces north. A series of extinction processing are finished to ensure the house as a blackbody. The camera takes pictures of the blackbody every 6 seconds. The mathematical model of the reference standard system of blackbody is established according to the definition of meteorological visibility and the Cosimi De's law, which shows the relationship between the meteorological visibility and sky/blackbody luminosity, and the relationship between the meteorological visibility and the blackbody blackness or the industrial camera image uniformity at the same time. Using the mathematical model, the error caused by the blackbody blackness and image uniformity of the camera is analyzed. When visibility is less than 30 km, the error caused by blackbody blackness and CCD industrial camera's uniformity of the measured system is about 3.7%. Blackbody blackness is measured by photographic method, putting a standard white card under the blackbody window, and the camera lens is 600 mm away from the window, shooting the white card and window at the same time. The brightness of the window is taken as the light-emission luminance, and the brightness white card divided by 0.7332 is taken as the incident light intensity. The ratio between them is the brightness, and the blackness of measurements for the house is 0.0018. Integrating sphere is used for uniformity and linear calibration of the camera. Compared with the forward scattering visibility instrument measurement and the reference standard system of blackbody visibility, the value of the visibility is consistent, but is greater under high visibility condition, and the value of the blackbody visibility measurement is lower under low visibility condition. Perhaps the cause is that the principle of the forward scattering visibility instrument cannot measure atmospheric aerosol absorption. Under low visibility condition, the aerosol optical absorption effect is larger, and the forward scattering visibility instrument cannot measure the absorption attenuation and measurements may be higher. To confirm this conclusion, further solubility and synchronous observation of aerosol optical properties are needed.
Impact Evaluation for Replacement of Temperature-humidity Sensor of Automatic Weather Station
Yang Zhibiao, Li Zhonghua, He Ju
2014, 25(2): 135-142.
Abstract:
To discuss the differences between automatic and manual observations for relative humidity and water vapor pressure, some comparative researches are implemented, analyzing the correlation coefficient, mean and variance between 38 long-time automatic observation meteorological stations and their adjacent stations in Hubei Province. Furthermore, based on the automatic and manual observations of four national reference climatological stations where the temperature-humidity sensors have been replaced 28 times from 2003 to 2011, impacts on relative humidity and water vapor pressure measurements are studied.The correlation coefficients for relative humidity, water vapor pressure between the checked station and its adjacent stations show a decreasing trend when mannual observation is replaced by automatic observation, the mean and variance for relative humidity and water vapour pressure are also obviously different, and these differences may be caused by the change of observation method.The relative humidity and water vapour pressure records jump caused by replacement of the temperature-humidity sensor appears in the ratio of 64%. The average relative humidity record jump is 3.4%, and the maximum reaches 8.5%, while the average for water vapor pressure is 0.74 hPa, and the maximum is up to 1.93 hPa.The main cause for such difference appearing at the same station as described above is that calibration error of indication, for old temperature-humidity sensor is much different from the new one when replacing. So improving the method of observation and perfecting the verification procedure of automatic weather station are vary important to ensure the homogeneity of data.Therefore, it suggests choosing the temperature-humidity sensor whose calibration error is smaller, and an error calibration module should be added to the data processing software or operational software of automatic weather stations.
Channel Selection for Hyper Spectral CO2 Measurement at the Near-infrared Band
Bi Yanmeng, Yang Zhongdong, Lu Naimeng, Zhang Peng, Wang Qian
2014, 25(2): 143-149.
Abstract:
The remote sensing of CO2 with the near-infrared sunlight can detect the source and sink information of atmospheric CO2 on the earth surface, which can be used in the research of global carbon cycle. The designing hyper spectral CO2 instrument, which will be carried by TanSat to be launched in 2015, measures CO2 column concentration using the near-infrared band. The instrument incorporates three bands with center wavelength of 0.76 μm, 1.6 μm and 2.06 μm. The spatial observing resolution is 1 km and the highest spectral resolution is 0.03 nm with the window width of 40 nm. Broad band and high resolution are a challenge for instrument manufacturing, as well as for observation processing including radiative transfer forward calculating and retrievals. The methods of degree of freedom (DOF) and information content are introduced. The CO2 information content of channels at the near-infrared band is analyzed based on the above methods. The top 20 to 100 high information content channels are selected, which are then used in a retrieval experiment based on full physical retrieval algorithm. Results show that the selected 20 channels provide as much as 74.6% of the total channel information content. There are exactly 10 channels located at P-branch and R-branch of 1.6 micron band respectively, which indicates that two absorption branches are both equally important. The CO2 retrieval error using the selected 20 channels only is 0.3×10⁻⁶ larger than retrievals using all the channels at 1.6 μm band. After the convergence of retrieval is achieved, the spectrum residual distribution shows relatively smaller residuals in high information content absorption channels and larger residuals in low information content channels. Therefore, the high information content channels control the retrieval progress.The relationship between information content and channel number is also investigated. First, information content increases with increasing channels amount to 60, but the trend becomes slow after that. The relationship between CO2 retrieval errors and high information channels amount is similar. The weak and strong CO2 absorption bands near 1.6 μm and 2.06 μm have different high information content channel distribution calculated using CO2 DOF and information content method. The high information content channels within 2.06 μm band are located at lines of moderate absorption radiance, and the distribution at two branches of 2.06 micron is asymmetry.It should be noted that the optical depth of aerosol is lower in the retrieval experiment, and cloud (thin cirrus) is also not included. Due to the disturbance of the backscatters of atmospheric aerosol and cirrus to radiation observed by satellite at near-infrared bands, the impact of cloud and aerosol to channel selection needs further investigations.
Effects of Meteorological Elements on Solar Cell Temperature
Pan Jinjun, Shen Yanbo, Bian Zeqiang, Wang Xiangyun
2014, 25(2): 150-157.
Abstract:
Rising temperature causes the degradation of photovoltaic cell power efficiency, and the solar cell temperature is an essential factor to determine temperature reduction coefficients. At present, there are still no sufficient field-recorded data of solar cell temperature in China, and in the design of photovoltaic power plants in different areas, climate background isn't considered enough when the temperature reduction coefficients is determined. Based on observational solar cell temperature, air temperature, ground temperature, inclined and horizontal solar radiation data observed in southern suburb of Beijing, changes of solar cell temperature with time and other meteorological elements are analyzed, and an empirical equation is established for calculating the solar cell temperature. From the point of temporal variation, the solar cell temperature and air temperature or ground temperature are related to a level of consistency, but there are some seasonal differences. For spring and summer (March to August), solar cell temperature and ground temperature are close, which are significantly higher (above 6℃) than air temperature. For autumn and winter (September to December, and January to February) solar cell temperature is significantly higher than that of ground temperature and air temperature. From the point of correlation, comprehensive correlation of solar cell temperature with air temperature and inclined irradiance, and the linear correlation of solar cell temperature with ground temperature are the best, with correlation coefficients exceeding 0.90, and the physical connection are accord with the temperature changes, which are the best choices to calculate solar cell temperature and the temperature reduction coefficient. However, the disadvantages of these equations are that the inclined irradiance or ground temperature data are not easily accessed. The linear correlation of solar cell temperature with air temperature is better, with the correlation coefficient of 0.88, and air temperature is easy to get and the quality is good, which is considered the most practical equation. However, the disadvantage of this equation is that two factors are not the same and the stability of the equation is poor. Comprehensive correlation of solar cell temperature with air temperature and horizontal irradiance is good, with the correlation coefficient being 0.75, which can be used as empirical equation to calculate solar cell temperature at high air temperature conditions. Based on the recorded cell temperature of one year and the weighted calculation, the conclusion is that the annual temperature reduction coefficient of photovoltaic power generation is around 2% in Beijing, and the maximum can reach 13.3%.
Identification of Ground Clutter with C-band Doppler Weather Radar
Li Feng, Liu Liping, Wang Hongyan, Yang Chuan
2014, 25(2): 158-167.
Abstract:
The application of radar data is negatively affected by echoes caused by ground clutter, meanwhile these echoes from ground clutter have significant effect on rainfall estimation and radar data assimilation. As a result, it is important to identify and discriminate these echoes, which is an absolutely necessary part of radar data quality control. The ground clutter identifying algorithms in operation are mostly based on S-band Doppler weather radar, the resolution and velocity scanning mode of which are different from those of C-band radar. Few researches are carried out to discuss whether the method based on S-band is applicable to the C-band radar or not. Based on the current algorithm used for the SA radar, one method is developed for the CC radar using the data observed by radars of Changzhi and Harbin. The statistical characteristics of clutter are analyzed using data collected during 2011, and the membership functions are improved for C-band Doppler weather radar.Results show that, for S-band and C-band Doppler weather radar, parameters about reflectivity of ground clutter are similar, and there are notable differences between ground clutter and precipitation echoes. For C-band ground clutter echoes, the parameter TDBZ is greater than S-band. GDBZ value of both kinds of radar is alike, mostly below 0. SPIN value of ground clutter echoes is remarkably greater than that of precipitation echoes for both C-band and S-band radar. It shows that three parameters about reflectivity including TDBZ, GDBZ and SPIN, can be used to identify and discriminate C-band radar ground clutter echoes.For C-band radar ground clutter and precipitation echoes, only MDVE, associated with velocity, could be used to distinguish these two kinds of echoes. For MDSW and SDVE, there is no notable difference between ground clutter and precipitation. In contrast, two parameters of ground clutter are different from that of precipitation echoes for S-band radar. For S-band radar, MDSW and SDVE are both very small, mostly below 1. There are considerable numbers of values above 1 for two parameters of C-band radar. The spatial resolutions of two kinds of radars are different, which may result in the fact that MDSW and SDVE could not be used to distinguish ground clutter echoes from precipitation echoes. Besides, the velocity scan mode, the dual pulse repetition frequency may cause the phenomenon to some extent. It can also be caused by the different precisions of two kinds of radars. The velocity precision of S-band radar is 0.5 m·s-1, while the velocity of C-band radar is 0.1 m·s-1. For S-band radar, the velocity changes more smoothly than that of C-band radar. Compared with the method based on S-band radar, the identification accuracy of ground clutter is improved notably and the false detection of stratiform cloud echoes is also reduced obviously.
Hail Forecast Based on Factor Combination Analysis Method and Sounding Data
Liu Xiaolu, Liu Jianxi, Zhang Shilin, Liu Ping
2014, 25(2): 168-175.
Abstract:
The emergence of the small probability of severe weather events is attributed to specific factor combinations of some early meteorological elements. The nonlinear and complicated characteristics of factor combinations can be used to find the relationship between forecast object and forecast factors. Based on this method, the relationship between hail events in the south of Sichuan Basin and some meteorological elements calculated by the sounding data is investigated, and a hail forecast index discriminant is established. The discriminant is physically significant and applied in daily operation.Hailstorm is a meso-scale weather system with the temporal scale of several to dozens of hours, and the horizontal scale of several hundred kilometers. In real business, the T-lnp sounding data are observed at 0800 BT and 2000 BT every day, and the hail forecasting is carried out every 12 hours. A sample sets of 7 hail events and 38 non-hail events near Yibin Station is established. Using the T-lnp sounding data, 3422 meteorological elements are calculated as forecast factors, including temperature, height, moisture, saturation vapor pressure, potential pseudo-equivalent temperature, K index and so on. Based on factors combination analysis method, 2 main factors and 2 conditional factors are selected from 3422 meteorological elements and their critical values are calculated. The main factors are Tσ400*-Tσ850 and Gz400-Gzsurface, and the conditional factors are e700-es700 and Td700-Tσ700*, Tσ400* stands for saturated wet static temperature at 400 hPa, and Tσ850 stands for wet static temperature at 850 hPa; Gz400 and Gzsurface stand for vertical pressure gradient at 400 hPa and the surface level; e700 and es700 stand for vapour pressure and saturated vapour pressure at 700 hPa; Td700 and Tσ700* stand for dew point temperature and saturated wet static temperature at 700 hPa. The hail forecast indexes discriminant nearby Yibin Station is established using these data.The environmental state of hailstorm generation and the unstable mechanism of severe convective weather can be explained by the hail forecast indexes discriminant, which is evaluated using historical records of the year of 2008. Among 65 warnings, the real hail events never miss but the false alarm ratio reaches 67.7%, which should be further distinguished using radar observations. The overall probability of detection is 84%, and the critical success index is 30.4%. The result shows that factor combination analysis method is feasible to some extent.
Comparative Analysis on the Applicability of Drought Indexes in the Huaihe River Basin
Xie Wusan, Wang Sheng, Tang Weian, Wu Rong, Dai Juan
2014, 25(2): 176-184.
Abstract:
Based on daily temperature and precipitation data of 170 meteorological stations from 1961 to 2010, as well as the soil moisture data and historical drought disaster information in the Huaihe River Basin, the applicability of drought indexes is analyzed. The indexes include the precipitation anomaly percentage (Pa), the Z index (Z), the standardized precipitation index (SPI), the relative moisture index (MI), the compound drought index (CI), the improved CI (CINew) and so on. They are examined from the aspects of inter-annual variation, seasonal evolution, spatial distribution, diagnostic analysis of typical drought processes, unreasonable jumps, the relativity analysis of the soil moisture and drought disaster information. The following results can be reached: All of these drought indexes can be used to diagnose the typical drought years in the Huaihe River Basin effectively, including the year of 1966, 1968, 1976, 1978, 1986, 1988, 1997, 1999, 2001 and so on. When analyzing the seasonal evolution and spatial distribution, both Z index and SPI are not effective, while the diagnosis results of indexes such as Pa, MI, CI and CINew are relatively in consistency and accordant with the fact. As to the diagnoses of typical drought processes and unreasonable jumps, CI and CINew are more effective in describing the mechanism. Analysis on drought relevance to soil moisture and historical drought disaster information shows that CI and CINew have more stable relativity and higher correlation coefficients than Pa, Z index, SPI and MI.In conclusion, as to the monitoring and diagnosis of the drought in the Huaihe River Basin, the applicability of CI and CINew indexes are superior to indexes of Pa, Z index, SPI and MI. The drought is a very complex scientific problem, which is related with many factors such as underlying surface, crop, soil type, rainfall, evaporation and so on. The drought index can have better applicability only when it is built based on reasonable consideration of the occurrence and development mechanism of drought and various influencing factors.
Comparative Analysis of Maximum and Minimum Temperatures of LTS and ASPTS
Yan Jiade, Jin Lianji, Wang Weiwei, Wang Jing
2014, 25(2): 185-192.
Abstract:
In order to meet demands of comprehensive weather observation in modern meteorological service, a development and assessment program of new automatic weather station (NAWS) is sponsored and launched by Meteorological Observation Center of China Meteorological Administration. Besides the traditional louver temperature observation system (LTS), NAWS can also be equipped with aspirated radiation shield temperature observation system (ASPTS), which borrows the design experience of US Climate Reference Network, for the purpose of achieving future long term homogeneous temperature observations. NAWS has been employed in the surface meteorological station in some provinces of China. Differences between LTS and ASPTS results, influencing factors and the correction method all need investigation, therefore, a parallel experimental measurements consists of LTS and ASPTS is conducted. The experiment is carried out in Nanjing University of Information Science & Technology (32°12′N, 118°42′E, elevation is 32 m) from August 2009 to July 2010. Maximum and minimum temperature measurements derived from LTS and ASPTS are compared, and biases of extreme values and difference of the occurrence times are examined under different regimes of ambience wind speeds. A correction model based on ambient wind speed is developed and checked. Results indicate that differences of daily extreme temperature between LTS and ASPTS are not subject to the normal distributions, while they demonstrate a right skewed state and a great degree of deflection. The concordance rate of maximum temperature between LTS and ASPTS is 90.0%, while that of minimum temperature is 81.5%. The gross error rate of maximum temperatures between LTS and ASPTS is almost the same as that of minimum temperature, both of which are about 3.0%. Compared with ASPTS measurements, the extreme values derived from LTS have a positive deviation of 0.2℃ and a lag of 2.5 minutes and 3.2 minutes for maximum temperature and minimum temperature, respectively. Differences of extreme values would be reduced with the enhancement of ambience wind speeds, even reduced to 0.1℃ when the speed is stronger than 4.5 m·s-1. The deviation correction, which is developed mainly based on wind speed, reduces the difference to 0.03℃ and 0.01℃, and increases the consistent rate to 95.2% and 94.1% for the maximum temperature and minimum temperature, respectively.
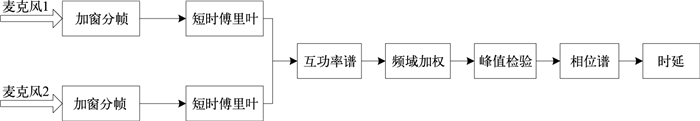
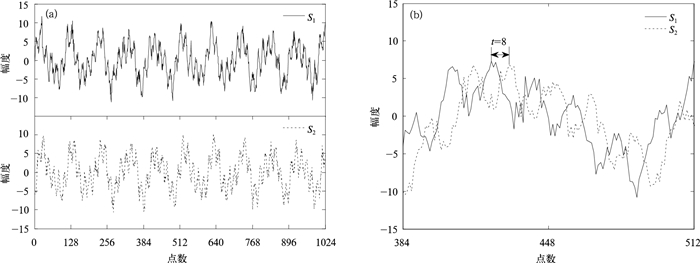
Application of Improved Cross Power Spectrum Phase Method to Acoustic Source Localization of Thunder
Yang Liao, Lü Weitao, Zhang Yang, Luo Hongyan, Liu Huanan, Gao Yan, Zhang Yijun
2014, 25(2): 193-201.
Abstract:
The thunder sound source is located by using single station lightning channel three-dimensional imaging system. Different time delaying estimation method is used, among which the cross correlation function method and the cross power spectrum phase method are mainly introduced. Considering the high frequency noise produced by the lightning process, reflection reverberation caused when the thunder reaches the ground, all kinds of noise is superimposed on the thunder signal (such as collection circuit itself noise), and an improved cross power spectrum phase delay estimation method is raised.Station imaging system is composed of microphone array and data acquisition card. A large amount of reliable data is collected by the system on the roof of Guangdong Provincal Meteorological Bureau building since 2009. Two thunder processing records in Guangzhou are selected, combined with the high speed camera data, and the cross correlation function method and the improvement cross power spectrum phase method are compared in the application of acoustic localization of thunder. First, the time difference of thunder signal reaching the different microphones is calculated by using the cross correlation function method and the improved cross power spectrum phase method. Then, the sound source azimuth and elevation angle information are solved by the array geometry. Comparing with the two-dimensional photographs observed by high speed camera, the imaging result is in good agreement, showing good reliability. As the cross correlation function method algorithm is based on the amplitude correlation, it can't distinguish the array arriving simultaneously from different sound source. Because its noise immunity is weak, the discrete imaging point can't depict the channel shape better. Instead, the improved cross power spectrum phase method calculates time delay by phase difference, and it has strong noise immunity and intensive imaging point, so it does better in discerning the branch channel. The contrast result indicates that the improved cross power spectrum phase method is better than the cross correlation function method for the low signal to noise ratio environments and multi-forked lightning. Finally, three-dimensional thunder source is obtained through the direction information and distance of thunder calculated with improved cross power phase method.The application of single station microphone array imaging system reduces the environmental requirements and costs. Although the accuracy of results is low, for close range, multi-branch, multi-ground lightning, the single station microphone array provides a simple and practical three-dimensional observation programs, and it has application prospects for small scale lightning monitoring, early warning and research. A real-time processing of three-dimensional imaging thunder sound source system is in plan, based on a single station of microphone array, and it will play its unique role in the three-dimensional structure of the lightning research.
Application of Spline Interpolation to Physical Process Feedback Accuracy Improvement of GRAPES Model
Su Yong, Shen Xueshun, Zhang Qian, Liu Junjie
2014, 25(2): 202-211.
Abstract:
The variable distribution in the vertical direction of GRAPES model's dynamic core adopts Charney-Phillips method. Vertical velocity, potential temperature, water substance are calculated at the whole layer, horizontal velocity and dimensionless pressure are calculated at the half layer, but in physical process, all the variables are placed on the half layer. In order to satisfy the needs of the central difference calculations and better representation of the physical processes in the boundary layer, a nonuniform stratification is adopted, which is dense near the ground, and the higher the more sparse. Therefore, in GRAPES model, linear interpolation is needed to convert variables between whole and half layers before and after the physical process calculation.For the weather prediction model of various international centers, Lorenz layers are used in the physical part and all the variables are on the half layer. Most models also use Lorenz layers in the dynamic core, except for the Unified Model of the UK Meteorological Office, which chooses Charney-Philips layer for dynamic core and uses linear interpolation in dealing with the similar problem of interpolation between whole and half layers.Linear interpolation is relatively simple, but the accuracy is not high, and it will cause deviation especially for lower and higher layers. The cumulative deviation in the temperature and humidity fields will further impact the height and wind fields. In addition, the interpolation process of water substance is also required to ensure monotonic, but the traditional cubic spline interpolation, polynomial interpolation, cannot be guaranteed monotonic, which will bring negative water, instability and other issues.In order to solve the problems above, the traditional cubic spline interpolation method is introduced for potential temperature interpolation in GRAPES model. After some special handling of the boundary value based on the traditional one, a monotonic cubic spline interpolation method is established for water substance, by which the forecast error of potential temperature and humidity fields in the GRAPES model is effectively reduced. The feedback accuracy of physical process is improved, and the model comprehensive performance is also enhanced.
Evaluation of BJ-RUC System for the Forecast Quality of Planetary Boundary Layer in Beijing Area
Liu Mengjuan, Chen Min
2014, 25(2): 212-221.
Abstract:
The performance of analyses and forecasts from BJ-RUC (Beijing Rapid Updated Cycling Analysis and Forecast System) are evaluated against the operational L-band radiosonde observations at Beijing Weather Observatory sounding station at 0800 BT, 1400 BT and 2000 BT during the 2-month period of August 2010 and August 2011. From the results, it can be found that in Beijing Area, the detailed structure of the boundary layer revealed by the very high vertical resolution L-band radiosonde observations during the daytime, is generally well predicted by the model. However, systematical bias is also significantly identified. For the temperature profile, WRF model is capable of forecasting the thin layer with smaller temperature lapse rate below 400 m, while the whole boundary layer is forecasted with cold bias and warm bias at 1400 BT and 2000 BT for the boundary layer below 1 km. In addition, significant wet biases are also identified from the analyses and forecasts within the boundary layer. Overall, there are much larger systematical biases for forecasts within planetary boundary layer (PBL) than those in free atmosphere.According to the L-band radiosonde observations, the prevailing PBL mountain breeze at night usually transits into the valley breeze in the morning (around 0800 BT), there after the SSW wind will be dominant in PBL below 1500 m during the afternoon (from 1400 BT to 2000 BT) in Beijing Area. The WRF model accurately predicts such kind of diurnal feature of PBL circulation, but the wind speed in the morning is under-predicted while over-predicted in the afternoon. The forecast performance for height of PBL at 1400 BT is also verified against those derived from radiosonde data. The forecasted daily variation tendency of the height fits well with the observation during the evaluation period. But more or less, WRF model will over-predict the height under the circumstances of clear sky and light-mist, which could be partially ascribed to the feature of too strong vertical mixing in Yongsei University (YSU) PBL scheme utilized in the model.
Quality Control for Shipborne Observations of Sea Level Pressure
Li Yansong, Xu Zhifang, Fan Guangzhou, Li Ping, Li Zechun
2014, 25(2): 222-231.
Abstract:
With the rapid development of numerical prediction model, kinds of observations play an important role, among which the shipborne observations show great importance. In order to ensure the quality of shipborne observations and its positive contribution in numerical model, according to the temporal and spatial distribution characteristics of shipborne observations, a quality control scheme for sea level pressure data is set up consisting of element extreme range checking, eliminating the missing and redundant data, background field consistency checking, deciding the blacklist of observation stations, quality control method for blacklist data and so on. The scheme is developed based on the contrast analysis results between the observations and the T639 analysis field (0.28125°×0.28125°) in January and July of 2011, and it's also applied to the data of February and June of 2011.Shipborne observations consist of the data from oceanographic research vessel and unmanned automatic buoy station, the highest density of data is found at mid-and low-latitude ocean of the Northern Hemisphere, and the number of observation reports are fluctuating with time unsteadily. Missing observations and data redundancy are common cases, which affect the effectiveness of some quality control methods such as time consistency check and space consistency check, but the background field consistency check could avoid these disadvantages. The amount of sea level pressure data is the largest among all observed elements, but the missing data ratio and redundant data ratio both reach up to 50% and needs pre-processing. Blacklist data quality control scheme include the data elimination of blacklist station and quality control of residual blacklist data. The scheme can identify and eliminate the blacklist data accurately, as well as establish the blacklist of observation stations, which is beneficial to the lookup and maintenance work. Due to the altitude difference between the observation terrain and the model terrain in the Five Lakes and Great Slave Lake areas, background field data must be corrected through background consistency checking, and the double weighted average correction method can effectively eliminate the systemic deviation between observations and model outputs, thereby avoiding the errors in data quality control. Quality control results are proved to be correct and reasonable by the verification of case analysis and data rejection percentage of every quality control steps, and the quality control scheme also has a favorable application foreground in providing reliable initial field for data assimilation work.
Integrated Risk Evaluation on Meteorological Disasters of Loquat in Fujian Province
Chen Jiajin, Li Lichun, Lin Jing, Wang Jiayi, Zheng Dongqi, Huang Chuanrong
2014, 25(2): 232-241.
Abstract:
In order to identify the risk of loquat growing on complicated terrain in Fujian Province, to avoid planting in high risk areas, integrated risk evaluation on meteorological disasters of loquat in Fujian Province is conducted using disaster risk analysis theory. A risk evaluation index system for meteorological disasters of loquat in Fujian Province is constructed, based on the identification of the major disaster-causing factors affecting loquat growth and yield, and from the analysis of the sensitivity and exposed property of loquat to meteorology disasters, and the disaster prevention and mitigation capability of loquat growing regions in the Province. In addition, the risk index of each evaluation unit is calculated based on the annual meteorological data, loquat planting areas and yield, and other socio-economic data in loquat growing region in Fujian Province, and by using the weight of risk indices determined by analytic hierarchy process method and entropy weight coefficient method. Therefore, an integrated risk evaluation model of meteorological disasters is established and a fine risk division map is drawn with GIS technique. The growing region is divided into four-risk-grade areas, including mild risk area, moderate risk area, severe risk area and severity risk area. The result shows that, from the aspect of risk factors composition for the meteorological disasters of loquat, potential hazard of the disaster-causing factors is the determinant factor influencing the synthetic risk, the vulnerability of the planting area takes the second place, and the damage prevention and mitigation capacity only plays an alleviative role. In the Province, loquat growth regions with severe and more severe integrated risk of meteorological disasters for planting loquat are mainly distributed in the mountain areas with mid-high elevation of the five major mountain ranges, and counties with large growing areas including Putian City, Fuqing City and Yunxiao County; the regions with light integrated risk are mainly in the coastal counties with low elevation in the middle south of the Province (except large planting counties and Dongshan County); and the regions with moderate integrated risk are distributed in the other areas of the Province. Based on the risk evaluation results combined with loquat damage examples in history, it could be verified that the risk evaluation and division results is consistent with the actual situation. The results could offer scientific basis for the adjustment and optimization of loquat planting distribution, and for reducing the integrated risk of loquat planting in Fujian Province.
OPERATIONAL SYSTEMS
Optimization of Data Cache Function in Beijing Global Information System Center
Wang Fudi, Jiang Lipeng, Yao Yan
2014, 25(2): 242-248.
Abstract:
WMO Information System (WIS) is a coordinated, distributed, global infrastructure for the collection and sharing of information for all WMO and related international programs. As the core center of WIS, each Global Information System Center (GISC) is responsible for the collection and distribution of global exchanging data, and providing data discovery and access service. As a GISC of WIS, a scalable and flexible system is designed and established to satisfy WIS/GISC functionalities in Beijing. Beijing Global Information System Center should hold at least 24-hour WMO global exchanging data files, which could be accessed by authorized users through DAR (data discovery, access and retrieval) services.GISC Beijing has to do validation check for all the global exchanging data files, and only files matching the corresponding metadata could be brought into data cache. The existing approach for the validation is based on database retrieval operation. Currently, there are more than 100000 metadata records stored in the relational database GISC Beijing, while the system receives more than 50000 global exchanging data files in an uneven distribution of collection time. The disadvantage of this way is that frequent database I/O operation would lead to a sharp decline of the system performance, especially when a large number of data entering. Therefore, the approach could not satisfy the requirement of real-time data cache service. Although establishing the table index and multi-threaded mechanism could solve the efficiency of data processing to some extent, it is inevitable that frequent database I/O operation would bring about the performance bottleneck. Therefore, the operation treatment should be optimized.It is a possible way making full use of memory technology to reduce disk I/O cache data and improve the efficiency significantly. Considering the complexity of the mature memory database, a more targeted approach is adopted which is suitable for the scenario of dynamic nature of data with the timeliness requirements. An application is designed and implemented based on the memory object caching technology. When initializing the application, the system loads metadata into memory as a hash table from the database based on stored key/value pairs, organized by the unique bulletin head information of global exchanging data. In this way, the metadata contents are encapsulated as memory objects, thereby providing fast data memory retrieval method. In addition, parallel processing is implemented to extend the functionalities, including data cache logging function and data subscription services.As a result, effects of the optimized function can satisfy the real-time business requirements, reducing the data processing time to an average of less than 5 ms. It also provides an easier way to do extensions by adding memory object using parallel processing.
An Event-based Public Meteorological Service Product System
Zhang Zhentao, Zhang Zhengwen, Chen Yu, Xue Bing
2014, 25(2): 249-256.
Abstract:
The rapid developments of the new media technology and the expansion of dissemination channels have brought higher requirements in timeliness and aesthetic property in the processes of making meteorological service products. The present meteorological working platform mostly relies on the third-party GIS component to complete the analysis of meteorological data and the output of products. Through the analysis on difficulties in making public meteorological service products, a manufacture framework based on weather events is proposed. The framework is oriented towards meteorological knowledge extraction, data analysis, geographical boundaries clipping and graphics quality control and so on.The key issues of the framework are focused on four procedures, including identified service hotspot, meteorological data analysis, applying product template and product output. The fundamental of service and product determination is to determine service hotspots, so knowledge modeling association between hotspots and products is linked. While meteorological data analysis is the bridge between data and products, the triangle-grid interpolation algorithm and rectangle-grid isoline tracking algorithm are integrated in analyzing observations and numerical forecast results. Applying product templates is based on the control of information area, the clip property of GDI+ helps exclude invalid information to ensure using the correct templates, and to highlight the key information of the product. Meanwhile, product output is often faced with a variety of distribution media, so the Octree algorithm is applied to quantize the product color when the file size is limited to a small value, and the products can be used through more media.C# language is used in programming the event-based public meteorological service product prototype system, which is called MonaRudo. MonaRudo is a lightweight system which adopts 1:4000000 GIS vector data, including hotspot verifying of meteorological service, interaction tools library, file browsing modules and so on. The interaction tools library, algorithms library and other libraries are all loaded as plugins. MonaRudo focuses on the flexibility of user interaction as well as an integrated scripting language named MonaScript which is provided for unattended products manufacture.Since 2012, MonaRudo has been used in typhoon meteorological service and "golden week" meteorological service, providing more than 20 kinds of service products. Because of the complete structure and powerful functionality, MonaRudo has brought good service results for Web sites and mobile phones.