Vol.26, NO.6, 2015

Display Method:
REVIEWS
Advances in Techniques of Monitoring, Forecasting and Warning of Severe Convective Weather
Zheng Yongguang, Zhou Kanghui, Sheng Jie, Lin Yinjing, Tian Fuyou, Tang Wenyuan, Lan Yu, Zhu Wenjian
2015, 26(6): 641-657. DOI: 10.11898/1001-7313.20150601
Abstract:
Significant progresses are made in monitoring, analyses, forecasting and warning techniques of severe convective weather. Techniques of thunderstorm-intensity determination using lightning jump algorithm, convection initiation identification based on geostationary satellite data, convective weather identification based on dual polarization Doppler weather radar data are developed, comprehensively monitoring techniques of convective weather and systems based on multi-source data are applied in Central Meteorological Office of China. Mesovortices within bow echo systems closely related to damaging winds, trigger, developing and maintaining mechanisms of convective systems are better understood; statistical climatological characteristics of different types of severe convective weather and their environmental conditions, the mesoscale weather analysis specification and corresponding operational website products are providing necessary foundations and technical supports for operational forecasting of severe convective weather in China. Optical flow method, multi-scale tracking technique, and comprehensive nowcasting techniques using fuzzy logic method based on climatology, topography, and multi-source data are advanced; weighted-average method and ARMOR (Adjustment of Rain from Models with Radar data) blending short-term forecasting techniques are widely applied; convection-allowing high resolution NWP (ensemble) forecasts and their post-processing products are getting tested in forecasting testbed; short-range forecasting techniques of different types of severe convective weather using fuzzy logic method based on NWP (ensemble) forecasts are providing supports for the operational forecasting. Comprehensively monitoring and multi-scale self-adaptive nowcasting techniques based on multi-source data, improved techniques of convective weather analyses, development of multi-scale analysis technique and combination technique between weighted-average and ARMOR blending short-term forecasting, and improved techniques of (probabilistic) forecasting different types of convective weather with different intensities or extreme using fuzzy logic method based on convection-allowing NWP forecasts should mainly be developed for convective weather forecasting and warning in the future.
Progresses of MJO Prediction Researches and Developments
Ren Hongli, Wu Jie, Zhao Chongbo, Liu Ying, Jia Xiaolong, Zhang Peiqun
2015, 26(6): 658-668. DOI: 10.11898/1001-7313.20150602
Abstract:
Madden-Julian oscillation (MJO) is the dominant mode of the sub-seasonal to seasonal (S2S) time-scale variability. It has great impacts on weather and climate events at low latitudes, and also influences the circulation at mid-high latitudes by its meridional propagation and stimulating teleconnection wave trains, which presents a primary source of predictability on extended-range time scale. Therefore, the MJO prediction, which is the crucial part of S2S climate prediction, has been paid much attention in recent years. Firstly, the history of MJO prediction is reviewed, and then the current status of MJO prediction in main international research and operation institutions is summarized. Furthermore, the latest progress of the MJO prediction technique development and operation system establishment in National Climate Center of China Meteorological Administration (NCC/CMA) is focused on. The development goal and research plan for the MJO prediction on next step in NCC/CMA are prospected finally.
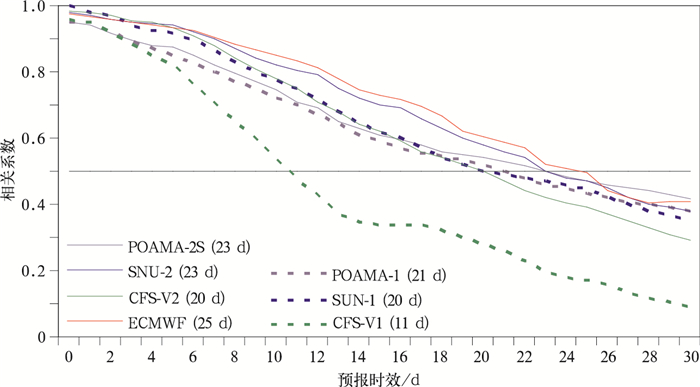
    Basic methodologies for the MJO prediction include the statistical and dynamical models. In recent years, big progresses have been made for two methodologies. For the former, the so-called spatial-temporal projection method (STPM) can extend the valid length of the MJO prediction to 25-30 days in terms of pentad mean. For the latter, atmospheric and coupled general circulation models (GCMs) have significantly pushed skills of the MJO prediction forward. Until now, the major research and operational institutions in the world have the valid prediction length longer than 20 days generally. More and more evidences indicate that the dynamical prediction based on GCMs is the most promising direction of MJO prediction. Indeed, it plays the crucial role in the model prediction that the GCMs need more adequate initial values including strong MJO signals, well designed initialization schemes making initial values dynamically consistent with model, and effectively perturbed ensemble members in terms of uncertainties from both initial values and model physics.
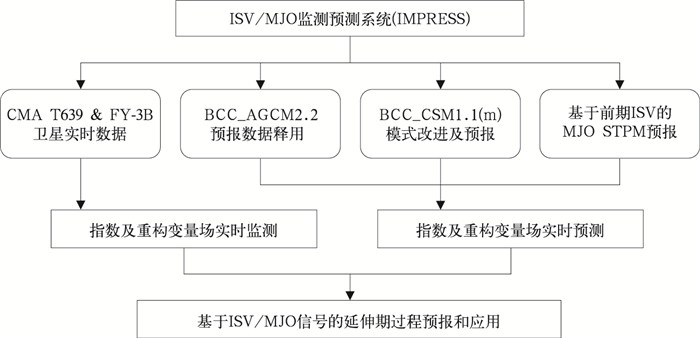
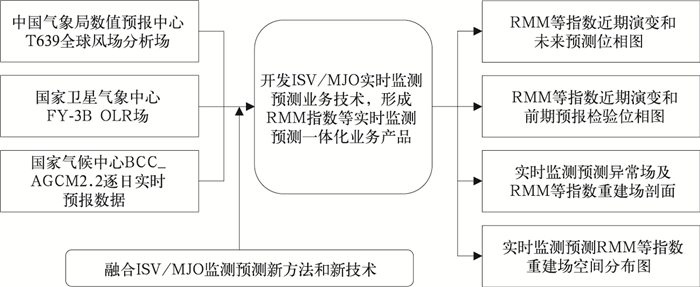
    In NCC/CMA, its own MJO prediction system using both the statistical and model is developed. On one hand, the STPM is now applied to the quasi-operational MJO prediction and the countrywide extended-range pentad-mean prediction of China station precipitation. On the other hand, methods and techniques of using BCC_AGCM2.2 and BCC_CSM1.1(m) models are being developed quickly in NCC/CMA, where particularly, a real-time MJO monitoring prediction system based on BCC_AGCM2.0 is established, fed by observations which all from CMA. By this system, daily real-time monitoring and prediction operational products are issued for forecaster use. Recently, a new ensemble method has been put forwards by averaging prediction results of BCC_CSM 1.1(m) with three different initialization schemes, which can significantly improve the MJO prediction and make the valid length reach about 20 days. Further studies are necessary for the MJO prediction, especially for that using the coupled GCMs.
ARTICLES
The Experiment of Hybrid Ensemble Forecast Approach in Short-range Forecast for South China Rainstorm
Tang Shengjun, Wang Donghai, Du Jun, Zhou Jingshi
2015, 26(6): 669-679. DOI: 10.11898/1001-7313.20150603
Abstract:
Hybrid ensemble forecast approach composed of high-resolution and low-resolution model is tested with multi-initial conditions and multi-physics ensemble prediction system (EPS) based on ARPS and WRF. Three kinds of ensemble prediction experiments (ARPS model ensemble, WRF model ensemble and ARPS-WRF multi-model ensemble) are designed to comparatively analyze the precipitation effect between the hybrid ensemble forecast approach and traditional ensemble forecast approach based on the heavy rainfall event occurred in Southern China on 8 May 2013. ARPS model ensemble improves local precipitation simulation over southern part of Guangdong Province. The center intensity of southern ensemble mean reaches 150 mm, close to the observation, but its location shifts northeast a little. The distribution of ensemble spread is similar to that of ensemble mean. The probabilistic forecast area of the approach is close to the observation in terms of the torrential rain and downpour forecast. The Threat Score (TS) show that the greatest improvements for order of magnitude precipitation are obtained by the hybrid ensemble approach. The Brier Score (BS) also shows that the improvement on moderate rain, heavy rain and torrential rain is obvious, but the improvement on downpour and excessive storm is limited for the approach. WRF model ensemble has a better performance on precipitation simulation over northern part of Guangdong Province, but the hybrid approach is limited because of the large frequency of false alarms and misses. ARPS-WRF multi-models obviously improve precipitation simulation which has a better performance than those of traditional ensemble forecast approach on precipitation area and intensity. The center intensity of southern precipitation reaches 70 mm, less than the observation and it is caused by the weaker WRF members forecast. The distribution of ensemble spread is similar to that of ensemble mean. The probabilistic forecast of torrential rain and downpour in southern area is best up to 40%. The TS shows that the greatest improvements for order of magnitude precipitation are obtained by the hybrid ensemble approach, especially for heavy rain, torrential rain and downpour. The BS also shows that the improvement on moderate rain, heavy rain and torrential rain is obvious. ARPS-WRF multi-models have better performance than ARPS model on the forecast of downpour and excessive storm. Therefore, the hybrid ensemble forecast approach achieves high-resolution ensemble forecast system and improves the precipitation simulation combining low-resolution ensemble run with single high-resolution control model run. Meanwhile, a reference to high-resolution ensemble forecast system is provided for operational weather prediction centers.
Observation and Comparison of Cloud-base Heights by Ground-based Millimeter-wave Cloud Radar
Tang Yingjie, Ma Shuqing, Yang Ling, Tao Fa, Li Siteng, Xie Chenghua, Tang Fanjie
2015, 26(6): 680-687. DOI: 10.11898/1001-7313.20150604
Abstract:
As cloud automatic observation achieved breakthrough progress, a long-term comparison test on different devices is needed to select the suitable cloud observation equipment for regular operation of China. A Ka-band millimeter-wave (35 GHz) cloud radar (KaCR) and a vaisala laser ceilometer (VCEIL) are installed in Meteorological Observation Center of CMA, and data are compared with L-band rawinsonde observations (LRAOBS) in Beijing Weather Observatory from 20 Nov to 31 Dec in 2014. Among these instruments, the KaCR observes the echo power value and its temporal resolution is from 1 s to 60 s, the VCEIL measures the back scattering intense data with the same temporal resolution of KaCR, and the LRAOBS works twice every day. Data acquisition ratio measured by KaCR and VCEIL under different visibility conditions are compared. A comparison test of cloud base heights and cloud top heights measured by KaCR and VCEIL is also carried out. A comparison test of cloud base height and cloud top height measured by KaCR and LRAOBS and a real example is analyzed. And the cloud base heights and cloud top heights measured by KaCR, VCEIL and LRAOBS during a precipitation process are compared too.
    The result indicates that the detection ability of KaCR is better than VCEIL under low visibility condition, and their difference of detection ability reduces with the visibility increasing. The cloud base heights measured by KaCR and VCEIL are well consistent, with the correlation coefficient reaching 0.92. The correlation coefficient of cloud base height between KaCR and LRAOBS is about 0.93, and that between KaCR and LRAOBS is about 0.78. Cloud base height measured by KaCR is slightly lower than that measured by VCEIL and LRAOBS, and cloud top height measured by KaCR is slightly lower than that measured by LRAOBS. KaCR can clearly show the process of cloud formation and dissipation and the structure changes of cloud compared with VCEIL and LRAOBS, but cannot accurately identify the cloud base position when it rains.
Comparative Analysis of Precipitation Between Weighing Gauge and Manual Gauge
Li Lin, Fan Xuebo, Cui Wei, Zhang Zhiguo, Liu Xulin
2015, 26(6): 688-694. DOI: 10.11898/1001-7313.20150605
Abstract:
Precipitation data play an important role in meteorological observation and relative applications. In order to accelerate CMA meteorological modernization, nearly 1000 weighing gauges are put into use in relative quantities national meteorological stations as an alternative observation device different from manual gauge for precipitation. Although field intercomparison experiments are carried out before the usage of weighing guage, there still exist some doubts on this kind of instrument, particularly in liquid precipitation measurements.
    Based on 1064 groups of precipitation data observed by weighing gauge and manual gauge at 15 national meteorological stations in Beijing during November 2012 to January 2014, several analyses are carried out to find out differences between two precipitation observation methods. 1064 precipitation processes include 253 snowfalls or sleets and 811 rainfalls. The error of accumulated precipitation for 14 stations meets requirements of operation. Also, the deviation of quantitative precipitation value obtained by weighing gauge and manual gauge also is within the margin of error, with 88.0% coverage rate of analyzed precipitation. In terms of the comparison, the average daily precipitation observed by weighing gauge is 0.04 mm smaller, and the RMSE (root mean square error) is 0.54 mm. Corresponding to different precipitation patterns, results make difference. For snowfall measurement, the quantitative value of precipitation obtained by manual gauge is 0.12 mm smaller and the RMSE is 0.51 mm. But for rainfall measurement, the quantitative value of precipitation obtained by manual gauge is 0.19 mm larger and the RMSE is 0.64 mm. For each significant precipitation process, the judgment of precipitation grade with weighing gauge and manual gauges is very close. But, more light rain phenomena can be detected by weighing gauge, typically when the quantitative value of daily precipitation is under 0.2 mm. The weighing gauge is shielded with Tretyakov wind shield, while manual gauge is unshielded. Results show that weighing gauge could capture more precipitation than manual gauge for solid precipitation, while effects of Tretyakov wind shield are not significant for liquid precipitation. Also, it's found that evaporation from the container of weighing gauge could reduce the precipitation of rainfall. The daily precipitation between weighing gauge and manual gauge is obviously linearly related with the correlation coefficient of 0.9990. In detail, the correlation coefficient is 0.9984 for solid precipitation and 0.9992 for liquid precipitation, respectively.
    In general, weighing gauge is satisfactory for measuring all kinds of precipitation, showing considerable advantages over manual gauge when measuring snowfall, and it can minimize some potential errors in manual methods of precipitation measurement.
Daily Crop Coefficient of Spring Maize Using Eddy Covariance Observation and Its Actual Evapo-transpiration Simulation
Zhang Shujie, Zhou Guangsheng, Li Rongping
2015, 26(6): 695-704. DOI: 10.11898/1001-7313.20150606
Abstract:
Spring maize is one of the most important crops in Northeast China and accounts for about 1/3 of grain crop area. Due to climate change in Northeast China during recent years, climate warming and drying trend is very significant. As a result, drought disasters of spring maize occur frequently, moreover, it often occurs in the critical period of the formation of maize production, resulting in a serious impact on maize yield. How to scientifically irrigate maize farmland and ensure maize yield stable and high is a serious challenge. In order to accurately calculate the actual evapotranspiration of maize, dynamic daily crop coefficient of spring maize and its relationship with leaf area index are studied, using the latent heat flux data from eddy covariance (EC), and corresponding data including meteorological data, phenological data and leaf area data during 2006-2008 and 2011 at Jinzhou Agricultural Ecosystem Research Station. Results indicate that both daily crop coefficient and actual evapotranspiration of spring maize farmland ecosystem show a unimodal curve change, and they reach the maximum from late July to early August (maize flowering and silk stages). A new dynamic crop coefficient model under conditions of enough water supply is developed for spring maize, and it indicates the close linear relationship between crop coefficient and leaf area index (R2=0.88, F=73.5, P < 0.01). Furthermore, the relative leaf area index is simulated using the standardization of growth period based on cumulative temperature. The relationship between daily crop coefficient of spring maize and relative leaf area index are also developed (R2=0.93, F=527, P < 0.01), which solves the calculation of daily actual evapotranspiration over spring maize farmland ecosystems without the leaf area observation. This new model improves the crop coefficient suggested by FAO, and extends the calculation from phonological stages to daily scale.
    At present, crop coefficients come from different evapotranspiration observation methods, including lysimeter and eddy covariance, and different methods lead to significantly different results. The comparison shows that crop coefficients of maize at four phenological stages based on the evapotranspiration observations from eddy covariance towers are the closest to values suggested by FAO. The newly developed crop coefficient model is able to simulate daily actual evapotranspiration of spring maize farmland ecosystem with a good accuracy. It could provide theoretical basis for the management of agricultural water resources and irrigation.
Yield Prediction of Sunflower Based on Crop Coefficient and Water Production Function
Yun Wenli, Hou Qiong, Li Jianjun, Miao Bailing, Feng Xuyu
2015, 26(6): 705-713. DOI: 10.11898/1001-7313.20150607
Abstract:

Crop coefficient and water production function are important parameters for water saving irrigation. Through making use of data from the stage sowing test at Bayannaoer (40°45′N, 107°25′E, elevation 1039.3 m) of Inner Mongolia in 2012 and historical agro-meteorological data from two monitoring stations, most of the research is carried out in accordance with yield prediction methods based on crop coefficient and water production function. As far as results are concerned, variations in the standard sunflower crop are small in the early stage, large in the medium stage and small again in the late stage. The peak value (1.21) presents itself in the blossom period. There are strong quadratic and cubic polynomial relationships amongst standard crop coefficients days after germination and positive accumulated temperature values (determination coefficient is 0.93). Through comparison with FAO recommended stage values, standard crop coefficient from the test computing is reasonable. In addition, when calibration methods of standard crop coefficient and relative leaf area index are put forward, the actual evapo-transpiration of water production function can be calculated, and dynamic calculation equations of sunflower crop coefficient in the irrigated districts are obtained. There is a quadratic parabola relationship between sunflower water consumption and yield with a suitable water consumption limit. The suitable water consumption threshold is about 400-460 mm, and the yield is 496.7-500.6 g·m-2. Moreover, when water supply is adequate, the water requirement of sunflowers during the entire growth period is 450 mm with an average frequency of 4.09 mm/d. The regular water requirement pattern indicates that minimum water is required during seeding stage, medium water is required during two pairs of true leaves-inflorescence formation stage and blossom-maturity stage, and maximum water is required during inflorescence formation-blossom stage. Additionally, when Jensen model is put forward and established through comparison with 4 sensitive indexes, the order of water deficit from high to low is blossom period, inflorescence formation period, maturity period and seeding period, which is consistent with the regular water requirement pattern. Through integrated utilization of sunflower crop coefficient equation and water production function model, the stage sowing production and production are obtained (504.36g·m-2 and 493.83 g·m-2, respectively), which show 4.4% and 4.1% deviations with actual production, respectively. There is preliminary evidence that the prediction method of production proposed is relatively reasonable with a great applicability in this region, and can be further applied to pre-assessment of production affected by water deficit in different stages.

The Optimization of Visibility Monitoring Network in Guangdong
Zhang Zhiyan, Deng Xuejiao, Wang Baomin, Li Fei, Tan Haobo, Deng Tao
2015, 26(6): 714-724. DOI: 10.11898/1001-7313.20150608
Abstract:
Visibility is an important indicator to measure the atmospheric transparency conditions, which not only reflects the regional air quality conditions, but also closely relates to human life. Under current visibility conditions, it is crucial to implement an extensive long term stations for visibility monitoring network to track changes in visibility and determine causal mechanism for the visibility impairment in the region. The visibility observation network in Guangdong includes artificial monitoring network and the visibility sensor network. Artificial visibility observation is carried out at 86 meteorological stations every day, instrument observation is carried out at 39 stations, and the spatial distribution of stations is intensive but quite uneven. Therefore, a new method is carried out aiming at the optimization the overall arrangement of visibility monitoring network.
    Based on the dataset (daily visibility and relative humidity from the 86 meteorological stations in Guangdong), the method can be applied to optimization of the overall arrangement of the establishing operational visibility sensor network in Guangdong, which will substitute the artificial monitoring network. The figure-of-merit (FOM) and the spheres of influence (SOI) are calculated, and the most desirable location is ranked and identified using the resultant FOM field. The spatial coverage for each of stations is determined by the SOI. The determination of the minimum number of stations required is carried out by deleting lower ranking stations if more than 50% of its effecting area is covered by higher ranking stations. Besides, taking the local terrain, background stations, and other factors into account, it's suggested 51 stations are required.
    Above results can be applied in establishing operational visibility sensor network in Guangdong, which will substitute the artificial monitoring network. The related methods are also applicable to the overall arrangement for monitoring network of other variables.
Characteristics of Raindrop Size Distribution for a Squall Line at Chuzhou of Anhui During Summer
Jin Qi, Yuan Ye, Ji Lei, Lu Dejin, Feng Jingyi
2015, 26(6): 725-734. DOI: 10.11898/1001-7313.20150609
Abstract:
Characteristics of raindrop size distribution are analyzed using a ground-based disdrometer for a mid-latitude squall line at Chuzhou of Anhui on 31 Jul 2014. The observational precipitation are classified into convective rain, transition rain and stratiform rain based on the radar reflectivity and rain rate at surface. The convective rain is divided into leading edge, convective center and trailing edge according to a threshold rain rate 10 mm·h-1. The raindrop spectrum characteristics in different precipitation regions are studied. Results show that the mass-weighted diameter for convective center, transition region, stratiform region are stable with mean values of 1.8 mm, 1.0 mm and 1.7 mm, respectively. The generalized intercepting parameter Nw of convective precipitation is larger compared with stratiform precipitation, indicating a larger number concentration of drops. The μ value is the largest for transition precipitation but the smallest for convective precipitation. The raindrop spectrums are different for varied rain type. For convective precipitation, it shows a highest concentration of raindrop within each size range, especially for small size of raindrops, which results in a smaller raindrop size than tropic region. For stratiform precipitation consists of a lower number concentration of small drops and less large raindrops, therefore, the spectrum curve is flat. For transition precipitation, the number concentration of small drops is close to stratiform precipitation without large drops, results in a steep spectrum. The mass-weighted diameter for leading edge is large probably caused by gravity separation at the early stage of precipitation. The rainwater content of stratiform precipitation is smaller compared with convective precipitation. The mass-weighted diameter of stratiform precipitation is larger compared with convective precipitation, and it increases more rapidly compared with convective precipitation as the rain water content increasing. The reflectivity is larger for stratiform precipitation compared with convective center precipitation at the same rain rate. The Z-I relationship of stratiform precipitation is Z=409I1.48 when partitioning the rain into convective rain, transition rain and stratiform rain, but Z=395I1.51 when the partitioning is blurred. The Z-I relationship is improved and the accuracy of radar rainfall estimates is enhanced by dividing the rain type more exactly. In summary, although the raindrop size distribution for a squall line at ground is discussed, the knowledge on microphysical process of mid-latitude squall line is still insufficient. Dual polarization radar can be applied to further investigate the microphysical process in different types of internal cloud precipitation in the future.
Verification and Correction on ASCAT Wind Velocities Within the Offshore East China Sea
Yao Risheng, Tu Xiaoping, Ding Yeyi, Wang Wujun, Wu Fangping, Zhu Wanjun
2015, 26(6): 735-742. DOI: 10.11898/1001-7313.20150610
Abstract:
Based on ASCAT wind velocities, observations of 14 meteorological buoys in the offshore East China Sea, and 249 automatic weather stations (AWS) along coastal Zhejiang Province from 2010 to 2014, verification and correction methods are implemented on ASCAT wind velocities and buoy observations. The analysis indicates ASCAT wind velocities are overestimated for all the 14 buoys in comparison with observations, but only 5 of them, all located off Zhoushan Archipelago, hold deviations greater than 2 m·s-1 with mean bias of 4.79 m·s-1, and the mean bias for the rest buoys is only 0.46 m·s-1. Results also imply ASCAT wind velocities are not only related to distances away from the coastal line, but also to the local terrains. Regression methods are applied to investigate relations between ASCAT wind velocities and observations at all the buoys with regression and independent test samples ratio of 70% to 30%. It shows that linear regression can help reduce ASCAT wind deviations at all the buoys, decreasing the mean bias from 2.02 m·s-1 down to 0.14 m·s-1, especially at those stations with big errors. The relation of ASCAT deviations among buoys is also studied, indicating there is a positive correlation between the ASCAT wind errors and distances for buoys within 160 km, the closer the distances between buoys are, the bigger the coefficients are, with the logarithmic fitting taking advantages of the linear fitting. Two methods, namely regression and deviation, are carried out to make corrections on ASCAT wind velocities, with effective radius taken into account while doing inverse distance weighing interpolations. Results show the mean deviations and root mean square errors decrease obviously after revision, two methods reduce the mean biases by 1.86 m·s-1 (67.9%) and 1.74 m·s-1 (64.2%), and reduce the root mean square errors by 1.19 m·s-1 (29.2%) and 0.89 m·s-1 (29.6%), repectively. Case study on the regression method is carried out with corrected ASCAT wind velocities compared with the 10 m wind fields at lead time 0 h of European Centre for Medium-Range Weather Forecasts (ECMWF) fine model (resolution of 0.25°×0.25°). It shows that two methods are proved positive and can help decrease mean wind deviation. Further analysis shows that the deviation method gets the least mean deviation when AWS observations are taken into account, implying that the enhancement of station resolution can help increase the correction result.
Probability Forecasting Model of Geological Disaster Along the Yingxia Railway Induced by Pre-cipitation with Its Application
Zhou Yu, Liu Zhiping, Zhang Guoping
2015, 26(6): 743-749. DOI: 10.11898/1001-7313.20150611
Abstract:
Precipitation is an important triggering factor of railway geological disasters. Every year significant economic losses are caused by railway geological disasters because of rainfall. To solve the problem of geological disaster forecasting in operational weather forecast service, a probability forecasting model is needed. Due to its special terrain and weather conditions, Yingxia Railway suffers from geological disasters more frequently and more severely. The disaster data from 2007 to 2012, as well as the temporal and spatial distribution features along Yingxia Railway are analyzed. Geological disasters happen most frequently at Qingzhou-Zhuozhai segment, especially from April to August.
    4 types of precipitation are the major trigger for the railway geological disasters: Local heavy precipitation, precipitation caused by typhoon, persistent precipitation and convectional weather. Geological disasters caused by typhoon are all relatively concentrated in Meishuikeng-Longhai-Xiamen segment. Persistent rainfall makes railway roadbed soil water saturation imbalance and thus slough or collapse may happen. Strong convective weather caused by rain could lead the soil flow to the air and thus causes the collapse of the shoulder. According to characteristics of different railway geological disasters caused by different types of precipitation, further study of the relationship between railway geological disasters and precipitation are carried out.
    10-min maximum precipitation, maximum hourly rainfall of a day, continuous rainfall and the cumulated rainfall of past 20 days are introduced as forecasting factors. Based on factor correlation analysis and logistic regression methods, the probabilistic forecasting models are established for each railway segment along Yingxia Railway. Although there are differences in precipitation hazard factor of each segment of geological disasters, the intraday precipitation is influencing for all segments. The precipitation one or two days before geological disasters plays an important role in probabilistic forecasting model. In order to verify the accuracy of this model, a test is applied on a heavy rainstorm happened from 20 May to 22 May in 2013 to forecast geological disasters of Yingxia Railway. The outcome indicates that the forecasting accuracy rates have reached above 80%. Effects of the probabilistic forecasting models are tested well. In the future, it can be used to conduct geological disaster forecasts to provide some technical support for railway safety meteorological services.
Comparison on Measurements by Airport Visibility Automatic Observation Instruments in Low Visiblity Weather
Ming Hu, Chen Lijie, Gao Lianhui, Wang Qi
2015, 26(6): 750-758. DOI: 10.11898/1001-7313.20150612
Abstract:
The runway visual range measurements form January 2013 to August 2014 by atmospheric transmission meter and forward scattering meter installed on the same end of Xi'an Xianyang international airport south runway are compared. Conclusions are as follows: When the visual range is greater than 400 m, measurements by forward scattering meter are likely to be greater than those by atmospheric transmission meter, while when the runway visual range is less than or equal to 400 m, measurements by atmospheric transmission meter are likely to be greater. Overall, when the runway visual range is less than or equal to 600 m, both two sets of equipment can be replaced by each other as their bias is accord with requirements of Civil Aviation Observation and Measurement. However, when the runway visual range is between 600 m and 1000 m, whether observations from two sets of equipment can be replaced mainly depends on weather conditions. When the runway visual range is greater than 1000 m, differences between two sets of equipment exceeds requirements of Civil Aviation Observation and Measurement.
    In fog, freezing fog, haze or big rain weather, observations show very good consistency and can be replaced with each other when runway visual range is less than or equal to 1000 m. In snow, smoke or floating sand weathers, measurements by forward scattering meter are much greater; while in big rain weather, it is found that measurements by atmospheric transmission meter are greater than that by forward scattering meter. In fog weather and haze weathers, it is found that measurements by atmospheric transmission meter are greater when the runway visual range is less than or equal to 1000 m, but less than data measured by forward scattering meter when visual range is greater than 1000 m.