Vol.34, NO.4, 2023

Display Method:
Articles
Stage Characteristics and Mechanisms of Extreme High Temperature in China in Summer of 2022
Chyi Dorina, He Lifu
2023, 34(4): 385-399. DOI: 10.11898/1001-7313.20230401
Abstract:
Stage characteristics and thermodynamic mechanisms of the extreme high temperature in China in summer of 2022 are analyzed with conventional observations, automatic weather station observations and the fifth-generation European Centre for Medium-Range Weather Forecasts (ECMWF) atmospheric reanalysis data (ERA5). It shows that the extreme high temperature process has two different stages. In June, high temperature areas are concentrated in North China and Huanghuai Region. From July to August the high temperature weather remains stable in Sichuan Basin and the middle and lower reaches of the Yangtze River. The influence area, intensity and duration of the high temperature from July to August are significantly stronger than those in June. Two stages of extreme high temperature occur in the anomalous circulation background. The South Asian high controls the upper troposphere with significant positive anomaly. Dominant systems are the strong development of high pressure ridge in North China and the stable maintenance of the evidently strong high-pressure dam in subtropical regions. The sustained dispersion of Rossby wave energy from upstream to North China and the weakening of transient weather disturbances are main causes for the enhancement and stability maintenance of the North China high pressure ridge. The strong convection in tropical regions, the enhancement of atmospheric heat sources on the southern side of the Northwest Pacific subtropical high, the strong updraft near the intertropical convergence zone and sinking in subtropical high ridge line near 30°N are conducive to the westward extension, strengthening, and stable maintenance of the Northwest Pacific subtropical high. The thermodynamic diagnostic analysis shows that the strong warm advection in the lower troposphere and the diabatic heating anomaly in the boundary layer above than the climatology is the main cause of the high temperature in North China and Huanghuai Region, and the maintenance of high temperature mainly relies on the contribution of strong diabatic heating. The formation of the extreme high temperature in Sichuan Basin and the middle and lower reaches of the Yangtze River is caused by subsidence warming anomaly which is in the low troposphere and stronger than the climatology. The second stage of the high temperature is also affected by the diabatic heating anomaly in the boundary layer. Besides the diabatic heating, the contribution of adiabatic heating (subsidence warming) term in the extremely strong South Asian high control region cannot be ignored.
An Integrated Correction Method for 2 m Temperature and Its Application to Yanqing Competition Zone of Olympic Winter Games
Qiu Guiqiang, Shi Shaoying, Wang Hongxia, Jing Hao, Zhang Lei
2023, 34(4): 400-412. DOI: 10.11898/1001-7313.20230402
Abstract:
The snow events in Olympic Winter Games and Paralympic Winter Games are held outdoors in mountainous areas and especially weather sensitive. Unfavorable weather conditions can lead to delays or cancellations of competitions, and even affect the safety of athletes. With dramatic variability in the surface meteorological conditions at venues due to local topographic effects, the provision of timely and accurate high-quality weather prediction pose serious challenges to forecasters. Over the past decades, the accuracy of numerical weather prediction models is gradually improving, but there are still some systematic errors because of the inherent modeling deficiencies, especially in areas characterized by highly variable orography. Fortunately, the weather prediction accuracy is usually improved with the help of post-processing techniques.In order to improve the meteorological service capability of the snow events, an integrated correction method for 2 m temperature prediction, composed of the model bias correction based on terrain correction and support vector machine algorithm, is proposed at sites with different altitudes within 72 h at 3 h interval. European Center for Medium Range Weather Forecasts (ECMWF) model data from 1 January to 28 March during 2018-2021 and the observation of 2 m temperature at eight automatic weather stations in Yanqing competition zone are used. The performance of the integrated correction method is evaluated before and during Olympic Winter Games and Paralympic Winter Games. The results show that the accuracy of the correction method is 0.856 and the mean absolute error is 1.08℃ for 2 m temperature prediction in Yanqing competition zone. The integrated correction method is better than the single algorithm, and performs well in 2 m temperature prediction exceeding the threshold and key weather process forecasts. The performance of the integrated correction method is more outstanding especially for the sites higher than the terrain height of the model. For most of the sites, the mean absolute error of 2 m temperature predicted by the integrated correction method within 72 h at 3 h interval generally shows a certain diurnal variation, and the variation of mean absolute error within 0-24 h, 24-48 h and 48-72 h lead time is relatively stable, but the daily variation trend is different at different sites. With the increase of lead times, the mean absolute error of 2 m temperature predicted by the integrated correction method shows the altitude dependence. The relevant research results may be extended to other complex mountainous areas to improve the weather prediction accuracy.
Refined Verification of Numerical Forecast of Subtropical High Edge Precipitation in Huanghuai Region
Li Han, Wang Xinmin, Lü Linyi, Ma Yunqi
2023, 34(4): 413-425. DOI: 10.11898/1001-7313.20230403
Abstract:
Taking precipitation processes at the edge of subtropical high as target objects, three typical sub-regions including the southern foothills of Taihang Mountains, the eastern foothills of Funiu Mountains, and the eastern plains in Huanghuai Region are investigated, according to the topography and precipitation distribution characteristics. On this basis, using multi-source fusion precipitation data of National Meteorological Information Center, the precipitation refinement verification index, FSS (fractional skill score) and STFSS (spatial temporal fractional skill score) that adds the temporal neighborhood are used to evaluate the forecasting performance of the precipitation diurnal variation of CMA-MESO and CMA-SH9. The results show that the precipitation frequency and intensity by CMA-MESO in mountainous areas are smaller than observations, leading to significant underestimation, while results by CMA-SH9 are both stronger. The deviation of precipitation amount forecast of CMA-MESO in plain area mainly comes from the deviation of precipitation frequency. The precipitation intensity forecast by CMA-SH9 is stronger than observations in the southern foothills of Taihang Mountains, and the forecast precipitation frequency in the afternoon is significantly larger. For the early morning to morning period in the eastern foothills of Funiu Mountains, the frequency of precipitation by CMA-MESO is significantly lower than observations, while the diurnal variation of precipitation intensity is better than that of CMA-SH9. For the eastern plains, the overestimation of precipitation in early evening by CMA-SH9 mainly comes from the significantly larger precipitation intensity, while CMA-MESO significantly underestimates the frequency of precipitation in early evening and early morning. Based on the analysis of FSS, CMA-MESO is superior to CMA-SH9 in hourly precipitation forecast of more than 10 mm during afternoon to mid-night in the eastern foothills of Funiu Mountains and 0200 BT to 0400 BT in the night in the eastern plains, but the conclusion is opposite in the southern foothills of Taihang Mountains in the nighttime. STFSS can better evaluate the temporal and spatial uncertainty of hourly precipitation forecasts. Precipitation forecasts of CMA-SH9 in southern foothills of Taihang Mountains from the afternoon to the first half of the night significantly lag behind observations, but its spatial-deviation-scale and performance is better than CMA-MESO. The precipitation forecast of CMA-MESO from 0200 BT to 0800 BT in the eastern foothills of Funiu Mountains is significantly ahead of observations, and the advance time is more obvious in the eastern plains in the morning.
Application of Deep Learning Bias Correction Method to Temperature Grid Forecast of 7-15 Days
Hu Yingying, Pang Lin, Wang Qiguang
2023, 34(4): 426-437. DOI: 10.11898/1001-7313.20230404
Abstract:
The forecast error of numerical weather forecasting is inevitable, and there are still difficulties in temperature forecast of 7-15 days. To improve forecast accuracy and timeliness, the deviation correction technique is often used in operation. In recent years, deep learning methods have shown great potential in statistical post-processing of model forecasts. To improve the accuracy of Global Ensemble Prediction System of China Meteorological Administration (CMA-GEPS) for 7-15 days, error characteristics of 2 m temperature and 10 m wind products of CMA-GEPS control forecast provided by TIGGE data center from 25 December 2018 to 5 July 2022, and ERA5 data provided by ECMWF are analyzed. The U-Net model and residual connection model is used to conduct 2 m temperature lattice forecast error revision experiment for the lead time of 168-360 h in the region 15.75°-55.25°N, 73°-136.5°E. The experiments are designed with various data features to explore differences of the deep learning methods for longer lead time with different sample characteristics and model parameters, and performances of models are examined by comparing the bias, mean absolute bias and root mean square error. The results show that 2 m temperature forecast errors of 7-15 days become larger as the lead time increases. The model forecast skill gradually decreases, and in the target area, performance in eastern and southern marine and offshore areas is better than in western and northern the plateaus and mountains. The differences in the spatial distribution of errors are more prominent. Among the revised models, the effect of the U-Net model is better than that of the U-Net residual connection model, and adding the initial 2 m temperature data of ERA5 can greatly improves the performance, but the effect of adding CMA-GEPS control forecast 10 m wind product of CMA-GEPS control forecast is not apparent. For 9 lead times, the revised root mean square errors are reduced by 10%-25%, and the model can effectively reduce the large forecast errors for the northern Mongolian Plateau and the western Tibetan Plateau, and some mountainous areas in the target area.
Comparison Experiment for Rainfall Observation of Micro-smart Weather Stations
Wang Zhenchao, Chen Xuejiao, Liu Shu, Hua Jiajia, Liu Wenzhong
2023, 34(4): 438-450. DOI: 10.11898/1001-7313.20230405
Abstract:
In order to enhance the understanding of rainfall observation performance of micro-smart (integrated) weather stations and to promote the application in rainfall observation operations, a comparative experiment for the rainfall observation of radar, photoelectric, piezoelectric and tipping bucket micro-smart weather stations is carried out by Hebei Xiong'an New Area Meteorological Service from June to November in 2021. The rainfall observation capability of micro-smart weather stations with different rainfall observation principles are analyzed in terms of total rainfall, rainfall intensity, percentage of rainfall intensity and temporal characteristics. It shows that when the accumulated precipitation exceeds 10 mm, the precipitation measured by the tipping bucket micro-smart weather station can meet observation error control requirements compared with the precipitation observed by the standard station, while results of the radar micro-smart weather station are large and results of the photoelectric and piezoelectric micro-smart weather stations are small. When the cumulative precipitation is less than 10 mm, results of the tipping bucket and piezoelectric micro-smart weather stations can meet observation error control requirements, while results of radar micro-smart weather stations are large and results of photoelectric micro-smart weather stations are small. In terms of rainfall intensity, the double tipping bucket station is suitable for monitoring rainfall extreme, while photovoltaic and piezoelectric stations underestimate the extreme. Radar-based micro-smart weather stations can be calibrated and revised for rainfall extreme monitoring by adjusting internal parameters. Analysis of different rainfall intensities and their corresponding rainfall ratios show that the rain intensity corresponding to a rain intensity accumulation ratio greater than 95% at each micro-smart weather station is[0.3 mm·min-1, 0.6 mm·min-1] and the rain intensity corresponding to a rainfall accumulation ratio greater than 50% is[0.1 mm·min-1, 0.4 mm·min-1]. It shows that within 0.4 mm·min-1, the proportion of rainfall measured by any type of rain sensor accounts for more than half of the total rainfall, so more attention should be paid to accuracy for small rain intensity in the operational rain sensor rate determination. As the resolving capacity increases, the tipping bucket type micro-smart weather station becomes less sensitive to the starting time and will identify the ending time earlier. The radar type micro-smart weather station responds to rainfall relatively more quickly. Finer resolving capacity of the rain sensor will enhance the monitoring effectiveness of fine rainfall and the effective rainfall rate.
A Synchronous Variation Process of Tibetan Plateau Vortex and Southwest Vortex
Huang Honghui, Li Lun
2023, 34(4): 451-462. DOI: 10.11898/1001-7313.20230406
Abstract:
The synchronous variation of Tibetan Plateau vortex (TPV) and southwest vortex (SWV) is an important way to trigger heavy precipitation in southwest and eastern China. However, the physical process and mechanism of the coordinated change of two vortices are still unclear. A synchronous variation process of the TPV and SWV during the super-strong and super-long Meiyu period in 2020 (during 1-4 June of 2020) is selected to analyze the evolution characteristics of the strength and structure corresponding to the special time node (T1-T5) when two vortices coexist, as well as the potential vorticity budget with the data including the fifth-generation European Centre for Medium-Range Weather Forecasts atmospheric reanalysis (ERA5) hourly data and the precipitation observations. It's found that during the period T1-T2, TPV moves eastward on the Tibetan Plateau. When the SWV is generated (T1), it is far away from the TPV, and it is considered that two vortices have no interaction at that time. At the time of T3, when the TPV moves to the lower slope terrain on the eastern side of the Tibetan Plateau, its intensity is significantly weakened. Also at that monment, the TPV begins to change in coordination with the SWV. During T4-T5, two vortices strengthen and continue to change synchronously, and then merge into cyclonic circulation on their east side. Combined with the intensity changes of two vortices, the TPV and SWV with non-overlapping horizontal positions can also undergo synchronous variations, when their characteristics of intensity changes are roughly similar. From the analysis results of the potential vorticity diagnostic equation, two vortices have different evolution mechanisms before the synchronous variation, but their evolution mechanisms are basically the same when the synchronous variation occurs. It can be concluded that, when there is no synchronous variation (T1-T2), the TPV mainly relies on the heating field to maintain the eastward movement, and the SWV is maintained by the horizontal potential vorticity flux divergence. When the two vortices change synchronously (T3-T5), their intensity changes are similar, and the evolution mechanisms of them are consistent. The maintenance of two vortices mainly depends on the horizontal potential vorticity flux divergence, followed by the heating field.
Covariation Relationship Between Tropical Cyclone Intensity and Size Change over the Northwest Pacific
Zhou Mingzhu, Xu Jing
2023, 34(4): 463-474. DOI: 10.11898/1001-7313.20230407
Abstract:
Tropical cyclone (TC) has brought huge losses to coastal areas, whose intensity and size are both important indicators of destruction. The Northwest Pacific is the area with the most TCs generated. Due to the lack of effective observation methods and monitoring information, the TC operational centers of coastal countries or regions have not yet established complete TC outer-core size prediction and testing service. Thus, to select factors that significantly impact TC size changes and improve TC size forecast, statistical analysis is carried out on the climatological characteristics and the lifetime covariation characteristics of intensity and outer-core size (selected as the radius of damaging-force winds, R26) over the Northwest Pacific from July to November during 2004-2020, using the tropical cyclone best track data from JTWC (Joint Typhoon Warning Center) and SHIPS (Statistical Hurricane Intensity Prediction Scheme) reanalysis data. The results show that TC intensity and size peak in October, mainly showing a higher proportion of strong and large-sized TCs with longer lifetime at sea than in other months. Generally, the TC size expands with the increase in intensity and shrinks as the TC weakens. TCs reach the lifetime maximum size (LMS) later than the lifetime maximum intensity (LMI), with a mean lag time of 40 hours. Compared to the TC rapid intensification and LMI, the mean meridional positions of TC rapid expansion and LMS are closer to the coastal continent. Initial vortex size of TC affects the size development, especially LMS. Specifically, 58% of small initial vortices maintain the size in the small to medium category, while 71% of vortices with large initial size develop to large vortices in later periods, with 59% intensify to strong TCs (no less than 59 m·s-1) at LMI stage. Compared to small initial vortices, vortices with larger initial sizes tend to attain the greater integrated kinetic energy. The size of the latter stage has a high correlation (no less than 0.45) with the initial R26 for 66 h, indicating that the initial size of TCs can be a key predictor. The peak of size change rate (ΔR26) is located at moderate intensity (25~50 m·s-1) and the peak intensity change rate (ΔVmax) is located at medium and small size (50-100 km). The outer-core size is more likely to expand outward and even leads to rapid expansion under the conditions of stronger upper air divergence, higher relative humidity, larger ocean heat content and moderate vertical shear.
Statistical Characteristics and Regional Differences of Raindrop Size Distribution During 6 Typhoon Rainstorms in Shandong
Wang Jun, Zheng Lina, Wang Hong, Liu Chang
2023, 34(4): 475-488. DOI: 10.11898/1001-7313.20230408
Abstract:
Based on disdrometers, Doppler radar products and conventional meteorological observation, precipitation characteristics of typhoon rainstorms affecting Shandong from 2018 to 2021 are explored, and evolution characteristics of raindrop size distribution and integral parameters of typhoon raindrops are analyzed. lgNw-Dm distribution shows that microphysical characteristics of different typhoons are different when entering Shandong. Ampil(1810), Rumbia(1818), Bavi(2008) and In-Fa(2106) are more maritime-like, while Yagi(1814) and Lekima(1909) are more continental-like. Microphysical characteristics of these typhoons are quite different after passing different distance and affected by the environment. Microphysical characteristics of Ampil and Bavi at two observation sites in north and south Shandong are similar, and rain drop size distribution (DSD) characteristics of their convective precipitation are maritime. Microphysical characteristics of Yagi are more continental when it enters Shandong. After moving northward, its DSD changes into a typical continental convective precipitation in northwest Shandong. DSD characteristics of Rumbia convective precipitation in Feicheng, Shandong Province are maritime, and change to continental near Guangrao under the influence of cold air, and then changes to maritime type over Laiyang after moving eastward. Microphysical characteristics of convective precipitation change several times. DSD characteristics of convective precipitation before Lekima denaturation are continental type (Lanling and Gaotang), while the spectral characteristics of convective precipitation DSD change to maritime (Linqu and Zhangqiu) during and after denaturation. In the process of In-Fa moving northward, the precipitation weakens obviously, and the microphysical characteristics of convective precipitation change significantly, from maritime in the south to continental in the north. The statistical relationships of various parameters between continental and maritime convective precipitation are different. The μ-λ statistical relation of the quadratic polynomial show that continental (maritime) precipitation generally has smaller (larger) constant terms except for Capricorn Texas, during which continental (maritime) precipitation generally has a slightly larger (slightly smaller) primary term and a smaller (larger) secondary term. However, Z-R relationship is complicated, and there are no significant differences between continental and maritime convective precipitation processes. Large index b is more likely to appear in continental precipitation processes, while small index b is more likely to appear in maritime precipitation processes. In addition, the proportion of equilibrium DSD is low, which can appear in both maritime and continental convective precipitation process, while the transition DSD with high proportion is more in continental convective precipitation processes.
Seasonal Distribution Characteristics of Raindrop Spectrum in Taiyuan
Ge Lili, Lü Guozhen, Zhao Guixiang, Han Chenhui, Guo Dong, Li Yajun
2023, 34(4): 489-502. DOI: 10.11898/1001-7313.20230409
Abstract:
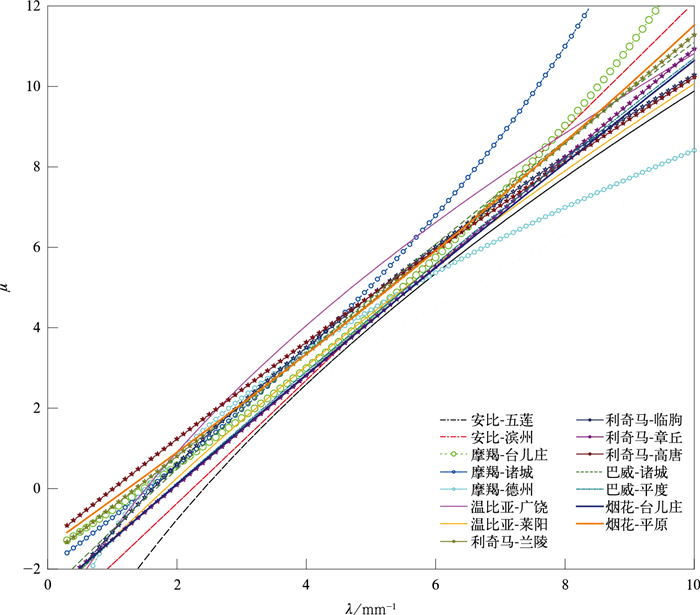
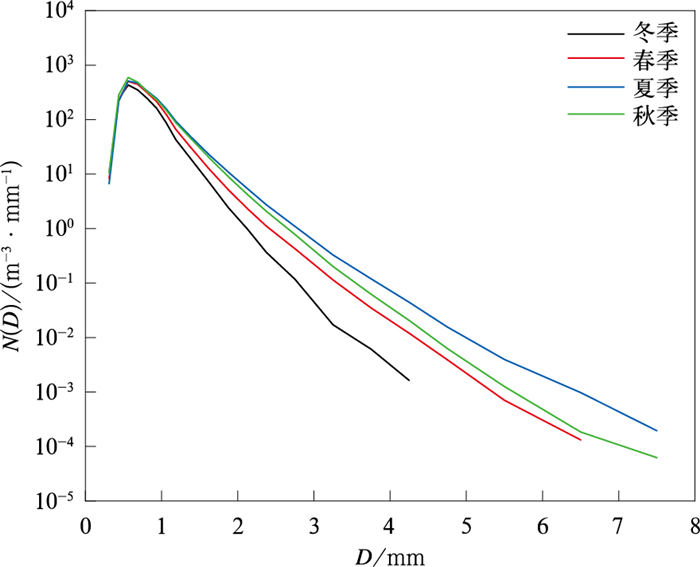
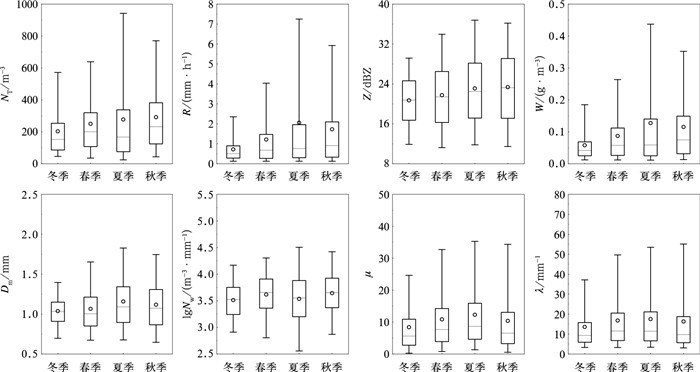
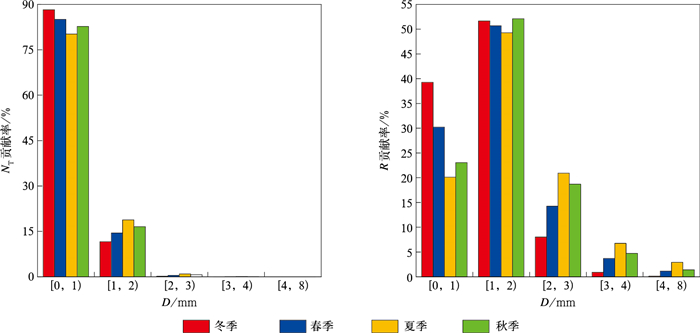
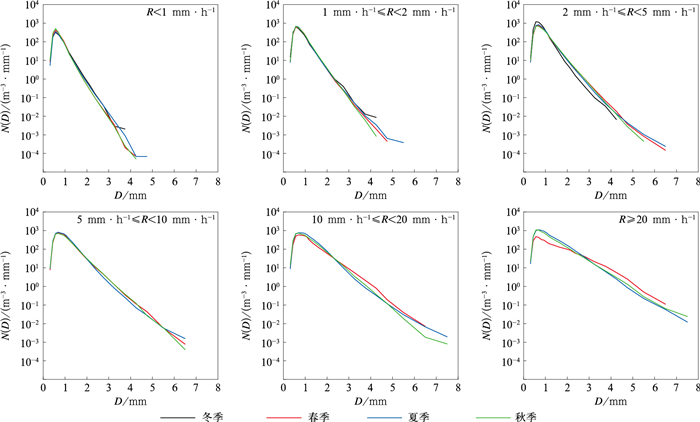
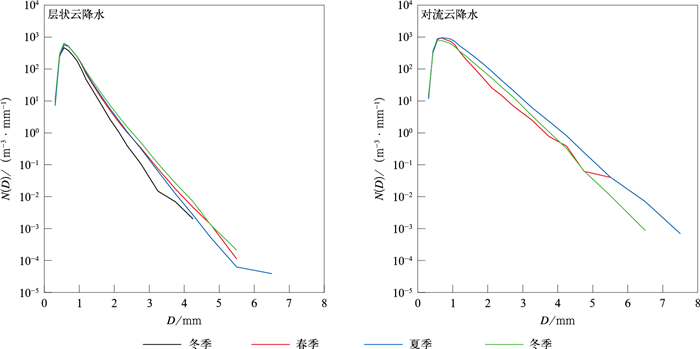
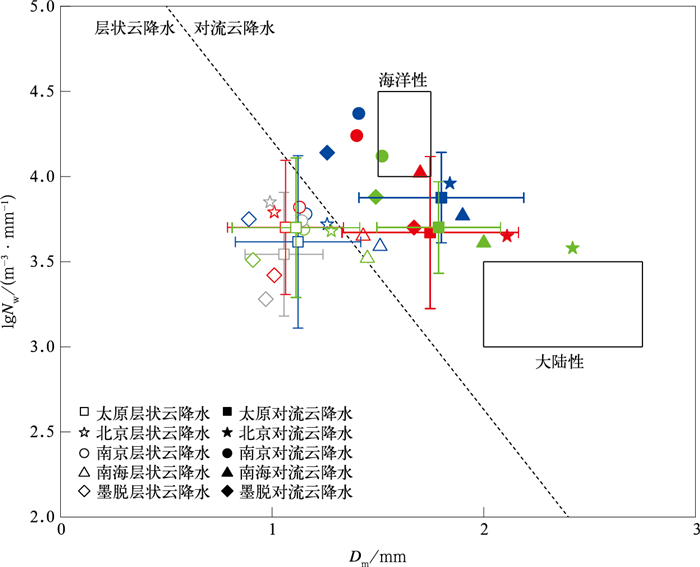
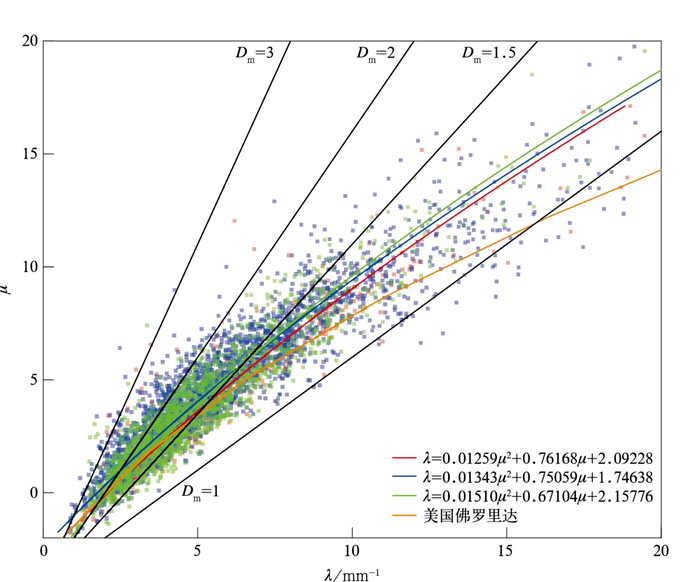
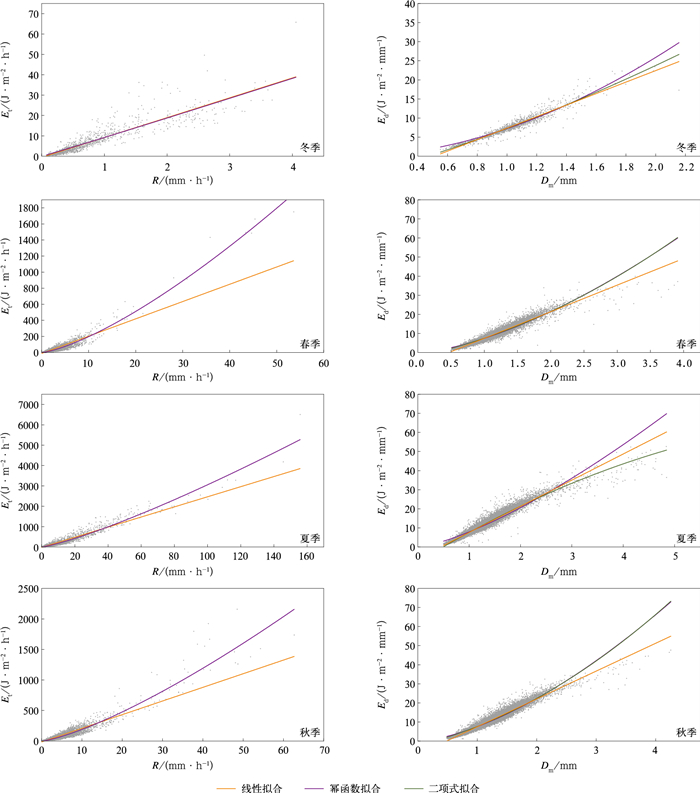
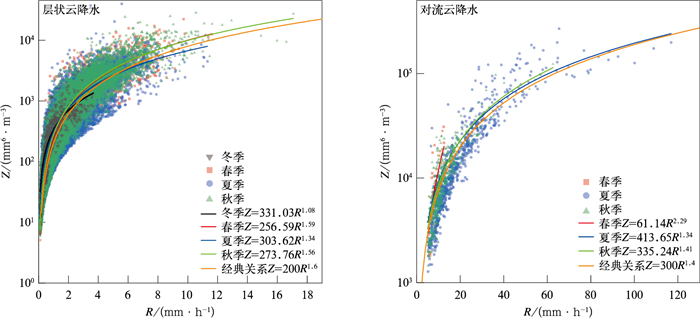
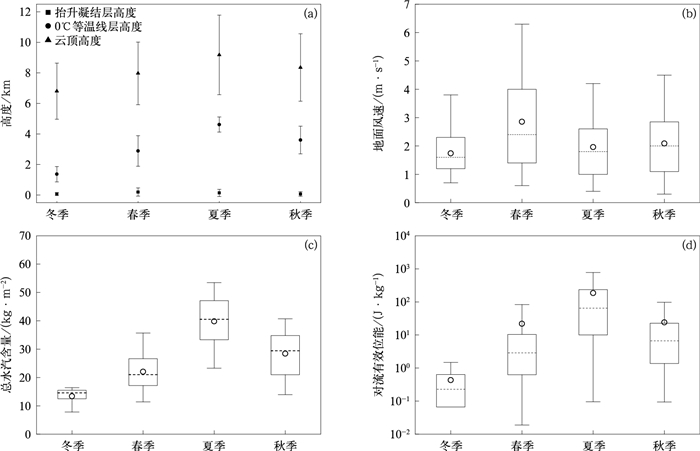
The raindrop size distribution (RSD) and parameter characteristics of different climate regions, rain types, topographies or weather systems have been extensively studied focusing on summer precipitation. However, even microphysical characteristics of precipitation in the same region can show significant seasonal differences. Seasonal distribution characteristics of RSD with different rain rates and rainfall types in Taiyuan are investigated and compared with conclusions from other regions based on observations of precipitation phenomenometer from December 2017 to November 2022. It can provide references for localized application of the parameterization of rainfall microphysics in numerical weather and climate prediction models, the rainfall kinetic energy flux estimation and the radar quantitative precipitation estimation. In addition, satellite measurements, ground observations, and reanalysis data are applied to explain the possible mechanism of seasonal differences in RSD. The RSD presents a unimodal structure with a peak of 0.562 mm and the decrease trend of concentration is more obvious in winter. Small raindrops with diameter less than 1.0 mm contribute more than 80% of the total number concentration, while the rain rate (R) is contributed primarily from mid-size raindrops with diameter of 1-2 mm during all seasons. The rainfall with R < 1 mm·h-1 are most frequent in different seasons, but the rainfall with R ≥ 5 mm·h-1 is predominant in summer. For the RSD of different rain rate, the highest (lowest) concentration of large (small) raindrops in winter is observed from the first two rain rate classes, while the concentration is higher in summer when the rain rate exceeds 5 mm·h-1. Rainfall at Taiyuan is dominated by stratiform rain throughout the year, lgNw or Dm has minor seasonal differences, and the distribution of lgNw and Dm is more similar to Nanjing. The convective rain occurs most often during summer and is close to the maritime-like cluster, the convective rain during spring and autumn is neither continental nor maritime, and there is no convective rain in winter. The stratiform rain has a wider spectrum width and higher concentration compared with the convective rain. μ-λ, Et-R, Ed-Dm, and Z-R relationships are derived by the least square method for different seasons. μ-λ relationships change little with seasons, but vary significantly compared with Florida in America. The power function and the binomial function has better fitting performance for Et-R and Ed-Dm, respectively. There is an inverse relationship between the coefficient and the exponent of the Z-R relationships. For stratiform rain, the classical relationship overestimates rainfall in spring and autumn, while the classical relationship turns from overestimated to underestimated as the rain rate increases. For convective rain, the classical relationship overestimates rainfall slightly in summer and autumn.
Temporal and Spatial Distribution of Thunderstorms and Strong Winds with Characteristics of Lightning and Convective Activities in the South China Sea
Yan Lincheng, Zhang Wenjuan, Zhang Yijun, Zhang Zenghai, Zheng Dong, Yao Wen, Sun Xiubin, Zhang Yixu
2023, 34(4): 503-512. DOI: 10.11898/1001-7313.20230410
Abstract:
Using the cloud top data provided by Fengyun-4A (FY-4A) multi-channel scanning imaging radiometer (AGRI) and lightning observations provided by the ground-based global lightning positioning network (WWLLN) during 2019-2020, combined with the meteorological and oceanographic data from MICAPS and extreme wind data recorded by buoys, the spatial-temporal distribution and convective activity characteristics of 71 thunderstorm and strong wind processes in the South China Sea are studied. Results show that the thunderstorms and strong winds recorded by the observatory are mainly distributed in the northern part of the South China Sea. Thunderstorms and strong winds mainly occur from May to September, with the peak in August and valley in March. Thunderstorms and strong winds mainly occur in the morning (0700-1200 BT), with the highest frequency at 1000 BT, a sharp decrease in the frequency in the afternoon, and the lowest frequency between 2100 BT and 2300 BT. The maximum value area of lightning density is distributed in the offshore area of southern Guangdong, and the lightning concentration occurs in the radius of 40 km to 80 km of the observation station. There is an obvious lightning jump in the isolated thunderstorms and strong winds process, and the occurrence time of the first jump is 30 min to 2 min ahead of the peak time of the wind, showing that the lightning activity is indicative of the peak of thunderstorms and strong winds. In terms of convection characteristics, at the peak moment of thunderstorms and wind speed, the cloud top brightness temperature at the location of the observation station is concentrated at 200-220 K, and the cloud top height is concentrated at 12.5 km to 15 km. The distance between the lowest brightness temperature value of isolated thunderstorms and strong winds cloud cluster (i.e., the location of the strongest convection) and the strong winds observation site (i.e., the location of the thunderstorms and strong winds) is 77.2 km on average, and the average difference of brightness temperature value is 2.6 K.