Mao Jiajia, Mo Yueqin, Zhang Xuefen, et al. Comparison and analysis of automatically-observed and manually-observed relative humidity. J Appl Meteor Sci, 2016, 27(3): 370-379. DOI:  10.11898/1001-7313.20160312.
Citation: Mao Jiajia, Mo Yueqin, Zhang Xuefen, et al. Comparison and analysis of automatically-observed and manually-observed relative humidity. J Appl Meteor Sci, 2016, 27(3): 370-379. DOI:  10.11898/1001-7313.20160312.

Comparison and Analysis of Automatically-observed and Manually-observed Relative Humidity

DOI: 10.11898/1001-7313.20160312
  • Received Date: 2015-09-14
  • Rev Recd Date: 2016-01-04
  • Publish Date: 2016-05-31
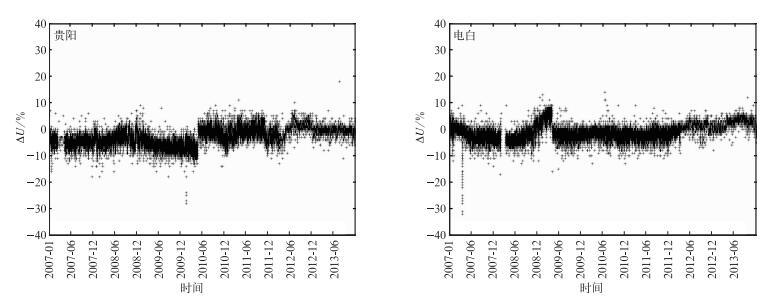
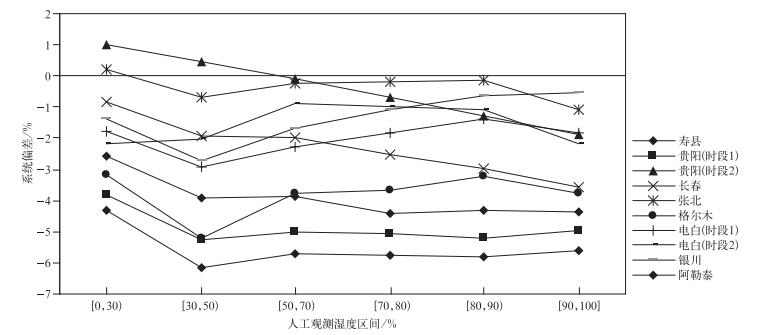
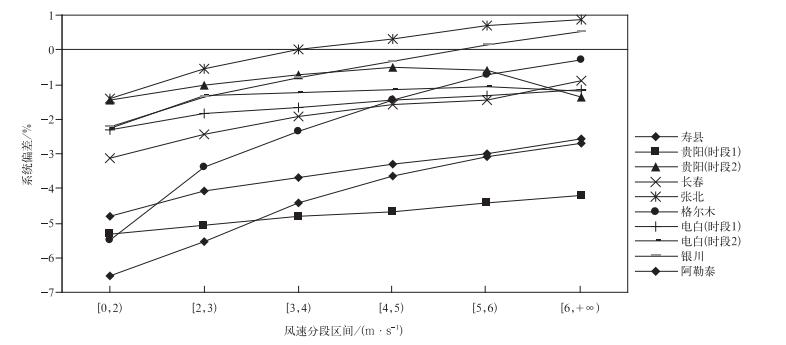
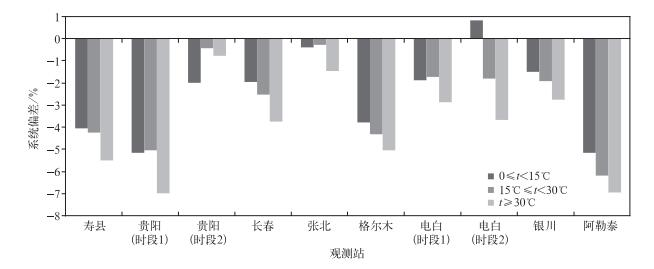
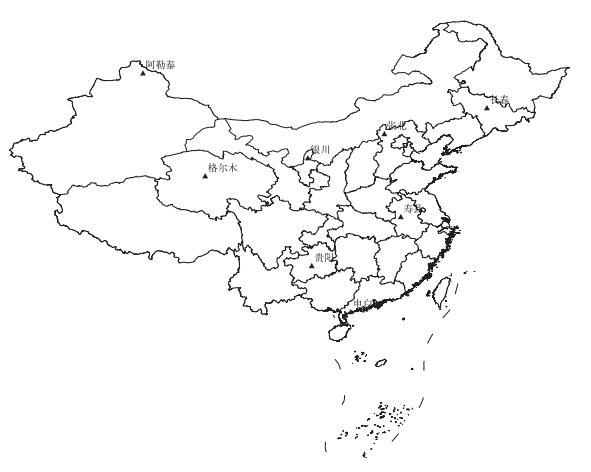
  • In 2012, the artificial meteorological observation is replaced by auto weather station in China. More than 2300 surface weather stations begin to use automatic weather observation system, and only 8 national reference climatological stations retain long-term manual observation. Great changes have taken place in observational rules and methods of automatic weather stations comparing with manual observations. Inhomogeneity of data series may be caused by many causes and the change of observational instrument is an important one, and therefore comprehensive comparisons are demanded to gain understanding of their differences.In order to determine the comparability of automatically-observed and manually-observed relative humidity and find out differences between them, the integral point observations from 2007 to 2013 of 8 national reference climatological stations which retain long-term manual observation are analyzed. Analysis results show that the average relative humidity observed by automatic way is from-5.69% to-0.1% lower than that by manual way, and the standard deviation is 2.02%-4.71%. As the humidity rises, the system error of the two increases. Differences between automatically-observed and manually-observed relative humidity are most significant in summer, and related to the wind speed. The difference is obvious under low speed conditions and it decreases gradually as the wind speed increases. The observation of relative humidity is also influenced by the ambient temperature. There is no significant time difference between two types of the hourly observation. The daily variation of differences between automatically-observed and manually-observed relative humidity have a rising trend in the early morning when the relative humidity is higher, especially in the high humid area, and have a dropping trend in the afternoon when the relative humidity is low.The relative humidity data of 8 national reference climatological stations observed by inner screen psychrometer and the hair hygrometer which have some deviations between them, and there are some deficiencies in the measurement performance of humicap too. Besides, the background information of the instruments are not fully known. For all of these, the conclusion has some limitations, although some problems can be explained. It is recommended that the maintenance and calibration of humicap should be carried out regularly, and the performance of the humicap at low temperature should be further tested.
  • Fig. 1  Distribution of eight national reference climatological stations which retained long-term manual observation

    Fig. 2  The difference between automatically-observed and manually-observed relative humidity from 1 Jan 2007 to 31 Dec 2013

    Fig. 3  Humidity segmentation system error

    Fig. 4  Wind speed segmentation system error

    Fig. 5  Difference of the relative humidity measured by two observation instruments under different temperatures

    Fig. 6  Difference of the relative humidity measured by two observation instruments under different temperatures

    Table  1  Statistic results of the difference between high and low humidity

    台站 UM≤80% UM>80% 总计
    样本量 系统
    偏差/%
    标准
    偏差/%
    样本量 系统
    偏差/%
    标准
    偏差/%
    样本量 系统
    偏差/%
    标准
    偏差/%
    贵阳 (时段1) 12001 -5.04* 2.11 14989 -5.05* 2.49 26990 -5.05* 2.33
    贵阳 (时段2) 7198 -0.32 2.45 9966 -1.62* 1.96 17164 -1.07* 2.28
    电白 (时段1) 15208 -2.07* 2.24 22411 -1.6* 1.82 37619 -1.79* 2.02
    电白 (时段2) 3257 -1.06* 3.02 5090 -1.75* 3.42 8347 -1.48* 3.29
    寿县 21949 -4.01* 2.94 20756 -4.33* 2.73 42705 -4.17* 2.84
    长春 21599 -1.93* 2.93 7545 -3.27* 1.85 29144 -2.28* 2.75
    张北 21995 -0.26 3.02 6345 -0.59* 2.29 28340 -0.34 2.87
    银川 30975 -1.88* 3.78 4119 -0.57* 2.54 35094 -1.72* 3.68
    阿勒泰 25458 -5.68* 3.89 3429 -5.76* 2.93 28887 -5.69* 3.79
    格尔木 27559 -3.97* 3.76 426 -3.4* 2.58 27985 -3.96* 3.74
      注:*表示达到0.05显著性水平。
    DownLoad: Download CSV

    Table  2  Statistical results of the difference between high and low humidity (t < 0℃)

    站名 UM≤80% UM>80% 总计
    样本量 系统
    偏差/%
    标准
    偏差/%
    样本量 系统
    偏差/%
    标准
    偏差/%
    样本量 系统
    偏差/%
    标准
    偏差/%
    寿县 1741 -2.57* 3.05 1303 -4.19* 2.31 3044 -3.27* 2.87
    贵阳 323 -3.45* 2.76 2069 -3.42* 2.61 2392 -3.42* 2.63
    长春 13951 -1.65* 3.61 3380 -3.15* 3.29 17331 -1.94* 3.6
    张北 15865 -0.75* 4.23 2948 -1.95* 3.89 18813 -0.94* 4.2
    格尔木 12930 -2.28* 3.93 130 -1.06* 3.32 13060 -2.26* 3.93
    银川 10300 -0.08 3.63 1758 -0.24 3.08 12058 -0.1 3.56
    阿勒泰 10274 -5.46* 5.14 7571 -4.64* 4.01 17845 -5.11* 4.71
      注:*表示通过0.05显著性水平。
    DownLoad: Download CSV
  • [1]
    Wendland W M, Armstrong W.Comparison of maximum-minimum resistance and liquid-in-glass thermometer records.J Atmos Ocean Tech, 1993, 10:233-237. doi:  10.1175/1520-0426(1993)010<0233:COMRAL>2.0.CO;2
    [2]
    Quayle G, Easterling D R, Karl T R, et al.Effects of recent thermometer changes in the cooperative station network.Bull Amer Meteor Soc, 1991, 72:1718-1723. doi:  10.1175/1520-0477(1991)072<1718:EORTCI>2.0.CO;2
    [3]
    Guttman R N B, Baker C B.Exploratory analysis of the difference between temperature observations recorded by ASOS and conventional methods.Bull Amer Meteor Soc, 1996, 77:2865-2873. doi:  10.1175/1520-0477(1996)077<2865:EAOTDB>2.0.CO;2
    [4]
    胡玉峰.自动与人工观测数据的差异.应用气象学报, 2004, 15(6):719-726. http://qikan.camscma.cn/jams/ch/reader/view_abstract.aspx?file_no=20040689&flag=1
    [5]
    王颖, 刘小宁, 鞠晓慧.自动观测与人工观测差异的初步分析.应用气象学报, 2007, 18(6):849-855. doi:  10.11898/1001-7313.200706128
    [6]
    连志鸾.自动站与人工站观测记录的差异分析.气象, 2005, 31(3):48-52. doi:  10.7519/j.issn.1000-0526.2005.03.011
    [7]
    刘小宁, 任芝花.地面气象资料质量控制方法研究概述.气象科技, 2006, 33(3):199-203. http://www.cnki.com.cn/Article/CJFDTOTAL-QXKJ200503001.htm
    [8]
    罗树如, 胡玉峰, 刘钧, 等.自动气象站综合探测网的构建.气象科技, 2006, 34(2):184-187. http://www.cnki.com.cn/Article/CJFDTOTAL-QXKJ200602014.htm
    [9]
    任芝花, 余予, 邹凤玲, 等.部分地面要素历史基础气象资料质量检测.应用气象学报, 2006, 17(1):107-112. doi:  10.11898/1001-7313.20060101
    [10]
    王颖, 刘小宁.自动站与人工观测气温的对比分析.应用气象学报, 2002, 13(6):741-748. http://qikan.camscma.cn/jams/ch/reader/view_abstract.aspx?file_no=20020697&flag=1
    [11]
    刘小宁, 任芝花, 王颖.自动观测与人工观测地面温度的差异及其分析.应用气象学报, 2008, 19(5):554-563. doi:  10.11898/1001-7313.20080506
    [12]
    杨志彪, 李中华, 何菊.自动气象站温湿度传感器更换的影响评估.应用气象学报, 2014, 25(2):135-142. doi:  10.11898/1001-7313.20140202
    [13]
    任芝花, 李伟, 雷勇, 等.降水测量对比试验及其主要结果.气象, 2007, 33(10):96-101. doi:  10.7519/j.issn.1000-0526.2007.10.014
    [14]
    曾英, 陈高峰, 任芝花, 等.陕西自动观测与人工观测相对湿度差异分析.陕西气象, 2010(4):18-21. http://www.cnki.com.cn/Article/CJFDTOTAL-SXQI201004005.htm
    [15]
    苑跃, 赵晓莉, 王小兰, 等.相对湿度自动与人工观测的差异分析.气象, 2010, 36(2):102-108. doi:  10.7519/j.issn.1000-0526.2010.02.015
    [16]
    余君, 牟容.自动站与人工站相对湿度观测结果的差异及原因分析.气象, 2008, 34(12):96-102. doi:  10.7519/j.issn.1000-0526.2008.12.013
    [17]
    中国气象局.地面气象观测规范.北京:气象出版社, 2003:42-44.
    [18]
    费业泰.误差理论与数据处理.北京:机械工业出版社, 1987:44-45.
    [19]
    黄嘉佑.气象统计分析与预报方法.北京:气象出版社, 2004:19.
    [20]
    中国气象局. 新型自动气象 (气候) 站功能规格书 (业务试用版). 2012: 26.
    [21]
    中国气象局.仪器和观测方法指南 (第六版).北京:气象出版社, 2004:59.
    [22]
    杨健, 张玉存, 宋志刚.湿度测量体制历史和现状分析及建议.气象水文海洋仪器, 2009, 26(2):17-23. http://www.cnki.com.cn/Article/CJFDTOTAL-QXSW200902006.htm
  • 加载中
  • -->

Catalog

    Figures(6)  / Tables(2)

    Article views (2372) PDF downloads(576) Cited by()
    • Received : 2015-09-14
    • Accepted : 2016-01-04
    • Published : 2016-05-31

    /

    DownLoad:  Full-Size Img  PowerPoint