| 年份 | 周期 | |||
| 10~30 d | 30~60 d | |||
| 1982 | PRE | EAP | PRE | EAP |
| 1983 | PRE | |||
| 1986 | PRE | EAP | ||
| 1989 | PRE | EAP | ||
| 1991 | PRE | EAP | ||
| 1993 | PRE | |||
| 1995 | PRE | EAP | ||
| 1996 | PRE | EAP | PRE | |
| 1998 | PRE | EAP | PRE | EAP |
| 1999 | PRE | EAP | EAP | |
| 2000 | PRE | EAP | ||
| 2009 | PRE | EAP | EAP | |
| Citation: | Zhai Panmao, Li Lei, Zhou Baiquan, et al. Progress on mechanism and prediction methods for persistent extreme precipitation in the Yangtze-Huai River Valley. J Appl Meteor Sci, 2016, 27(5): 631-640. DOI: 10.11898/1001-7313.20160511.

|
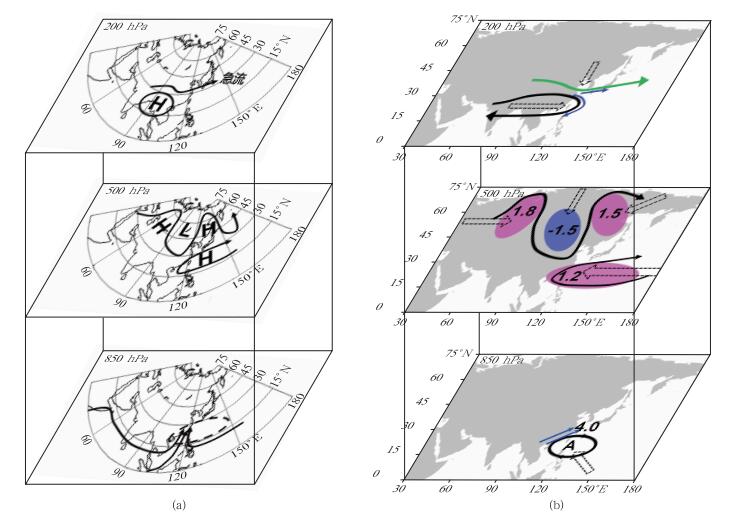
Fig. 1 Schematics for concurrent and precursor circulation features responsible for PEP events of double blocking high type (from reference [20, 23])
(a) concurrent conceptual model schematics (H and L denote locations of high (ridge) and low (trough) systems, respectively; solid lines denote geopotential height contours and locations of the jet axis at 200 hPa and 500 hPa; solid lines with arrowheads denote water-vapour transport paths and dashed line denotes the location of the anomalous anticyclone which contribute most heavily to the anomalous moisture supply at 850 hPa), (b) schematics for precursor circulation features (black solid line with arrowhead denotes geopotential height contour of 12500 gpm, the green line denotes the jet axis, hollow arrows denote moving direction and blue arrows denote direction of the horizontal wind at 200 hPa; black solid lines with arrowhead denote streamlines, purple and blue shadings denote positive anomalies and negative anomalies of geopotential height with the regional average normalized anomaly values (unit:dagpm) at 500 hPa; A denotes the anomalous anticyclone, blue arrows denote anomalous southwesterlies at 850 hPa)
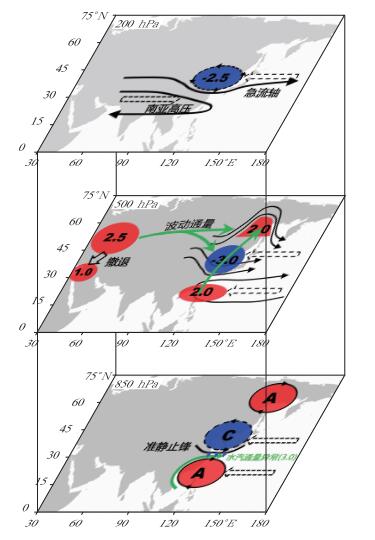
Fig. 2 Schematics for precursor circulation features of typical EAP patterns responsible for persistent extreme precipitation events in the YHRV (hollow arrows denote propagating routes of these precursors, red and blue shadings denote positive and negative anomalies of geopotential height with regional average normalized anomaly values, respectively; A denotes the anomalous anticyclone, while C denotes the anomalous cyclone)(from refrence [26])
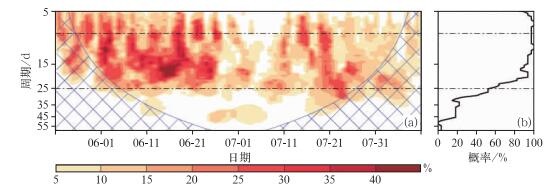
Fig. 3 Wavelet analysis of EAP index (from refrence [31])
(a) occurrence frequency (the shaded) of significant oscillations accumulated (0.05 level at least), (b) occurrence frequency of global wavelet spectrums at 0.05 significant level
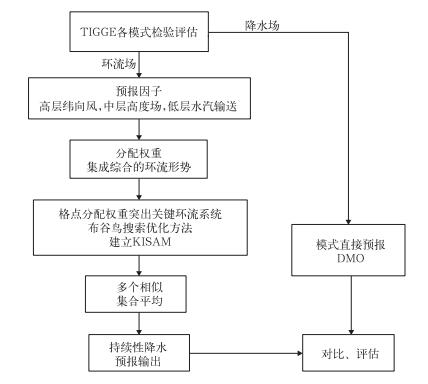
Fig. 4 Schematic graph of the forecast model based on key influential systems-KISAM
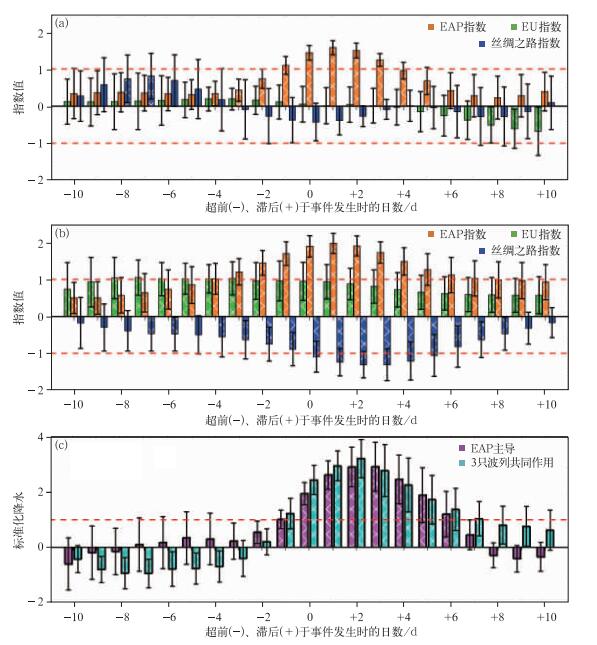
Fig. 5 The composition of the corresponding teleconnection index during PEP events under the effect of two different teleconnection patterns (0 on abscissa indicates the day when precipitation occurred, negative and positive numbers indicate days before and after the occurrence of precipitation, respectively)(from refrence [31])
(a) only East Asia/Pacific teleconnection exists, (b) three kinds of teleconnection exists, (c) the composition of precipitation associated with two teleconnection patterns
Table 1 Distribution of low frequency oscillation of precipitation and EAP in each event when PEP occurred
| 年份 | 周期 | |||
| 10~30 d | 30~60 d | |||
| 1982 | PRE | EAP | PRE | EAP |
| 1983 | PRE | |||
| 1986 | PRE | EAP | ||
| 1989 | PRE | EAP | ||
| 1991 | PRE | EAP | ||
| 1993 | PRE | |||
| 1995 | PRE | EAP | ||
| 1996 | PRE | EAP | PRE | |
| 1998 | PRE | EAP | PRE | EAP |
| 1999 | PRE | EAP | EAP | |
| 2000 | PRE | EAP | ||
| 2009 | PRE | EAP | EAP | |
 DownLoad: Download CSV
| [1] |
Lu R Y. Anomalies in the tropics associated with the heavy rainfall in East Asia during the summer of 1998.Adv Atmos Sci, 2000, 17(2):205-220. doi: 10.1007/s00376-000-0004-y
|
| [2] |
翟盘茂, 倪允琪, 陈阳.我国持续性重大天气异常成因与预报方法研究回顾与未来展望.地球科学进展, 2013, 28(11):1177-1188. doi: 10.11867/j.issn.1001-8166.2013.11.1177
|
| [3] |
陆尔, 丁一汇.1991年江淮特大暴雨的位涡分析与冷空气活动.应用气象学报, 1994, 5(3):266-274. http://qikan.camscma.cn/jams/ch/reader/view_abstract.aspx?file_no=19940349&flag=1
|
| [4] |
陈忠明, 闵文彬, 高文良, 等.一次持续性强暴雨过程的平均特征.应用气象学报, 2006, 17(3):273-280. http://qikan.camscma.cn/jams/ch/reader/view_abstract.aspx?file_no=20060348&flag=1
|
| [5] |
陶诗言.中国之暴雨.北京:科学出版社, 1980.
|
| [6] |
鲍名.近50年我国持续性暴雨的统计分析及其大尺度环流背景.大气科学, 2007, 31(5):779-794. http://www.cnki.com.cn/Article/CJFDTOTAL-DQXK200705002.htm
|
| [7] |
钱维宏.气候变化与中国极端气候事件图集.北京:气象出版社, 2011.
|
| [8] |
Tang Y B, Gan J J, Zhao L, et al.On the climatology of persistent heavy rainfall events in China.Adv Atmos Sci, 2006, 23(5):678-692. doi: 10.1007/s00376-006-0678-x
|
| [9] |
Ren F M, Cui D L, Gong Z Q, et al.An objective identification technique for regional extreme events.J Climate, 2012, 25(20):7015-7027. doi: 10.1175/JCLI-D-11-00489.1
|
| [10] |
汪汇洁, 孙建华, 卫捷, 等.近30年我国南方区域持续性暴雨过程的分类研究.气候与环境研究, 2014, 19(6):713-725. doi: 10.3878/j.issn.1006-9585.2013.13143
|
| [11] |
Chen Y, Zhai P M.Persistent extreme precipitation events in China during 1951-2010.Clim Res, 2013, 57(2):143-155. doi: 10.3354/cr01171
|
| [12] |
Dole R M, Gordon N D.Persistent anomalies of the extratropical northern hemisphere wintertime circulation:Geographical distribution and regional rersistence characteristics.Mon Wea Rev, 1983, 111(8):1567-1586. doi: 10.1175/1520-0493(1983)111<1567:PAOTEN>2.0.CO;2
|
| [13] |
Higgins R W, Mo K C.Persistent north Pacific circulation anomalies and the tropical intraseasonal oscillation.J Climate, 1997, 10(2):223-244. doi: 10.1175/1520-0442(1997)010<0223:PNPCAA>2.0.CO;2
|
| [14] |
Ding Y H, Reiter E R.A relationship between planetary waves and persistent rain-and thunderstorms in China.Archives for Meteorology, Geophysics, and Bioclimatology, Series B, 1982, 31(3):221-252. doi: 10.1007/BF02278295
|
| [15] |
Lau W K M, Kim K M.The 2010 Pakistan flood and Russian heat wave:Teleconnection of hydrometeorological extremes.Journal of Hydrometeorology, 2012, 13(1):392-403. doi: 10.1175/JHM-D-11-016.1
|
| [16] |
陶诗言, 张小玲, 张顺利.长江流域梅雨锋暴雨灾害研究.北京:气象出版社, 2004.
|
| [17] |
Liu H B, Zhang D L, Wang B.Daily to submonthly weather and climate characteristics of the summer 1998 extreme rainfall over the Yangtze River Basin.J Geophys Res, 2008, 113, D22101, doi: 10.1029/2008JD010072.
|
| [18] |
张庆云, 陶诗言.亚洲中高纬度环流对东亚夏季降水的影响.气象学报, 1998, 56(2):199-211. doi: 10.11676/qxxb1998.019
|
| [19] |
孙建华, 赵思雄.1998年夏季长江流域梅雨期环流演变的特殊性探讨.气候与环境研究, 2003, 8(3):291-306. http://www.cnki.com.cn/Article/CJFDTOTAL-QHYH200303003.htm
|
| [20] |
Chen Y, Zhai P M.Two types of typical circulation pattern for persistent extreme precipitation in Central-Eastern China.Q J R Meteorol Soc, 2014, 140(682):1467-1478. doi: 10.1002/qj.2014.140.issue-682
|
| [21] |
Wei W, Zhang R H, Wen M, et al.Interannual variation of the south Asian high and its relation with Indian and east Asian summer monsoon rainfall.J Climate, 2015, 28(7):2623-2634. doi: 10.1175/JCLI-D-14-00454.1
|
| [22] |
Chen Y, Zhai P M.Mechanisms for concurrent low-latitude circulation anomalies responsible for persistent extreme precipitation in the Yangtze River Valley.Clim Dyn, 2015:1-18, doi: 10.1007/s00382-015-2885-6.
|
| [23] |
Chen Y, Zhai P M.Precursor circulation features for persistent extreme precipitation in Central-Eastern China.Wea Forecasting, 2014, 29(2):226-240. doi: 10.1175/WAF-D-13-00065.1
|
| [24] |
Archambault H M, Bosart L F, Keyser D, et al.Influence of large-scale flow regimes on cool-season precipitation in the Northeastern United States.Mon Wea Rev, 2008, 136(8):2645-2663. https://www.researchgate.net/publication/249621804_Influence_of_Large-Scale_Flow_Regimes_on_Cool-Season_Precipitation_in_the_Northeastern_United_States
|
| [25] |
Kucharski F, Kang I S, Straus D, et al.Teleconnections in the atmosphere and oceans.Bull Amer Meteor Soc, 2010, 91(3):381-383. doi: 10.1175/2009BAMS2834.1
|
| [26] |
Chen Y, Zhai P M.Synoptic-scale precursors of the East Asia/Pacific teleconnection pattern responsible for persistent extreme precipitation in the Yangtze River Valley.Q J R Meteorol Soc, 2015, 141:1389-1403. doi: 10.1002/qj.2015.141.issue-689
|
| [27] |
Wheeler M C, Hendon H H.An all-season real-time multivariate MJO index:Development of an index for monitoring and prediction.Mon Wea Rev, 2004, 132(8):1917-1932. doi: 10.1175/1520-0493(2004)132<1917:AARMMI>2.0.CO;2
|
| [28] |
Mao J Y, Sun Z, Wu G X.20-50-day oscillation of summer Yangtze rainfall in response to intraseasonal variations in the subtropical high over the western north Pacific and south China sea.Clim Dyn, 2010, 34(5):747-761. doi: 10.1007/s00382-009-0628-2
|
| [29] |
Ren X J, Yang X Q, Sun X G.Zonal oscillation of western Pacific subtropical high and subseasonal SST variations during Yangtze persistent heavy rainfall events.J Climate, 2013, 26(22):8929-8946. doi: 10.1175/JCLI-D-12-00861.1
|
| [30] |
齐艳军, 张人禾.1998年夏季长江流域大气季节内振荡的结构演变及其对降水的影响.大气科学, 2016, 40(3):451-462. http://www.cnki.com.cn/Article/CJFDTOTAL-DQXK201603001.htm
|
| [31] |
陈阳.大气遥相关影响下的江淮地区持续性极端降水发生机理和预报信号.南京:南京信息工程大学, 2016.
|
| [32] |
Li L, Zhai P M, Chen Y.Low-frequency oscillations of East Asia/Pacific teleconnection pattern and their impacts on persistent heavy precipitation in the Yangtze-Huai River Valley.J Meteorol Res, 2016, doi: 10.1007/s13351-016-6024-z.
|
| [33] |
Niu R Y, Zhai P M.Synoptic verification of medium-extended-range forecasts of the northwest pacific subtropical high and South Asian high based on multi-center TIGGE data.Acta Meteo Sin, 2013, 27(5):725-741. doi: 10.1007/s13351-013-0513-0
|
| [34] |
Niu R Y, Zhai P M, Zhou B.Evaluation of forecast performance of Asian summer monsoon low-level winds using the TIGGE Dataset.Wea Forecasting, 2015, 30(2):455-470. doi: 10.1175/WAF-D-13-00141.1
|
| [35] |
Zhou B Q, Niu R Y, Zhai P M.An assessment of the predictability of the east Asian subtropical westerly jet based on TIGGE data.Adv Atmos Sci, 2015, 32(3):401-412. doi: 10.1007/s00376-014-4026-2
|
| [36] |
Peng X D, Che Y Z, Chang J.A novel approach to improve numerical weather prediction skills by using anomaly integration and historical data.Journal of Geophysical Research:Atmospheres, 2013, 118(16):8814-8826. doi: 10.1002/jgrd.50682
|
| [37] |
Wang H J, Fan K.A new scheme for improving the seasonal prediction of summer precipitation anomalies.Wea Forecasting, 2009, 24(2):548-554. doi: 10.1175/2008WAF2222171.1
|
| [38] |
Hsu P C, Li T, You L, et al.A spatial-temporal projection model for 10-30 day rainfall forecast in South China.Clim Dyn, 2015, 44(5-6):1227-1244. doi: 10.1007/s00382-014-2215-4
|
| [39] |
刘琳, 陈静, 程龙, 等.基于集合预报的中国极端强降水预报方法研究.气象学报, 2013, 71(5):853-866. doi: 10.11676/qxxb2013.044
|
| [40] |
Zhou B Q, Zhai P M.A new forecast model based on the analog method for persistent extreme precipitation.Wea Forecasting, 2016, 31(4):1325-1341. doi: 10.1175/WAF-D-15-0174.1
|
| [41] |
Kosaka Y, Nakamura H.Mechanisms of meridional teleconnection observed between a summer monsoon system and a subtropical anticyclone.Part Ⅰ:The Pacific-Japan pattern.J Climate, 2010, 23:5085-5108. doi: 10.1175/2010JCLI3413.1
|
| [42] |
Kosaka Y, Xie S P, Nakamura H.Dynamics of interannual variability in summer precipitation over east Asia.J Climate, 2011, 24:5435-5453. doi: 10.1175/2011JCLI4099.1
|
| [43] |
Yuan N M, Fu Z T, Zhang H, et al.Detrended partial-cross-correlation analysis:A new method for analyzing correlations in complex system.Scientific Reports, 2015, 5:8143. doi: 10.1038/srep08143
|

Figures(5) / Tables(1)
