| 观测站 | 观测时段 | 观测时段日平均气象要素 | 辅助观测 | |||
| 气温/℃ | 水汽压/hPa | 云量/成 | 日照/h | |||
| 那曲 | 2011-07—08 | 9.4±8.0 | 7.4±5.0 | 6.8 | 5.4 | CM21,激光雷达 |
| 拉萨 | 2012-05—07 | 18.0±10.0 | 8.39±5.0 | 6.9 | 5.4 | CM21 |
| 林芝 | 2014-06—07 | 16.8±10.0 | 13.4±4.0 | 9.0 | 2.6 | CM21,激光雷达 |
| 阿里 | 2016-05—09 | 14.0±8.0 | 4.8±4.0 | 4.9 | 7.2 | CM21,激光雷达 |
| Citation: | Liu Mengqi, Zheng Xiangdong, Zhao Chunsheng. Observational analysis of summer atmospheric downward longwave radiation at 4 sites on the Tibetan Plateau. J Appl Meteor Sci, 2018, 29(5): 596-608. DOI: 10.11898/1001-7313.20180508.

|
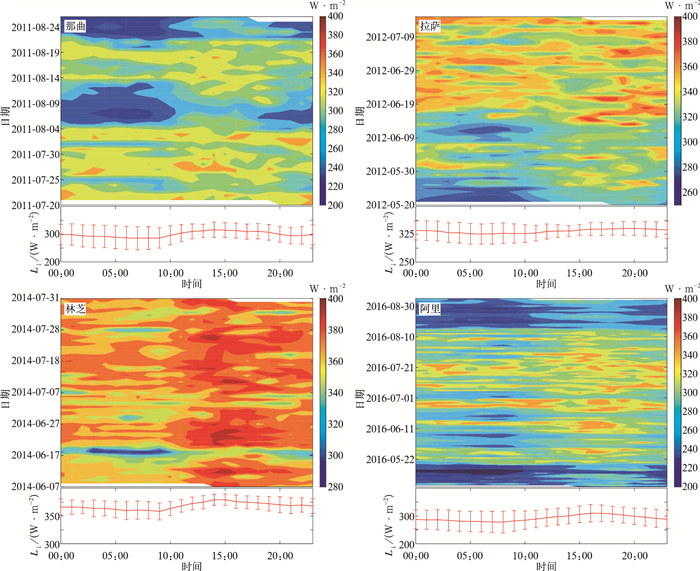
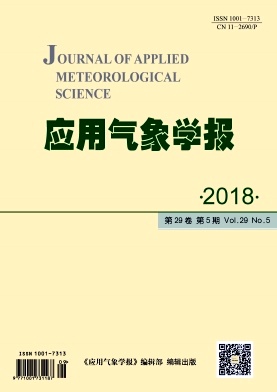
Fig. 1 Diurnal and daily L↓at Naqu, Lhasa, Nyingchi and Ali
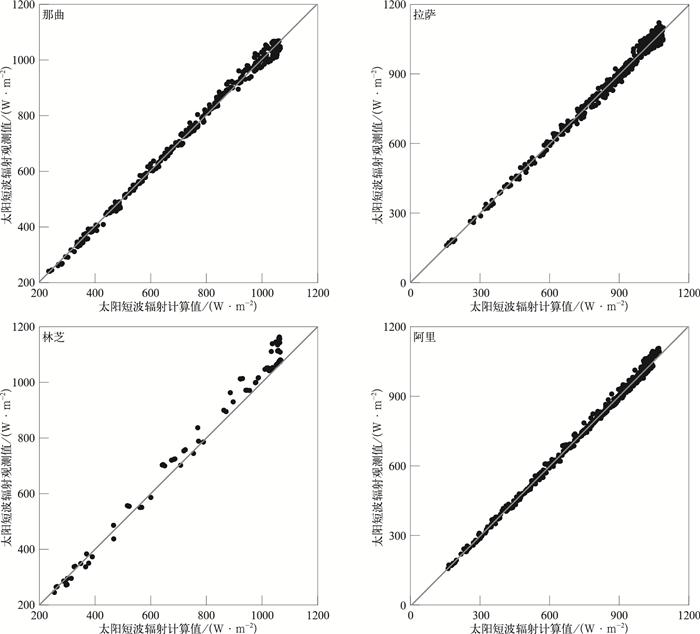
Fig. 2 Observed and calculated solar shortwave radiation at Naqu, Lhasa, Nyingchi and Ali under cloud-free condition in daytime

Fig. 3 Observed and calculated L↓ at Naqu, Lhasa, Nyingchi and Ali under
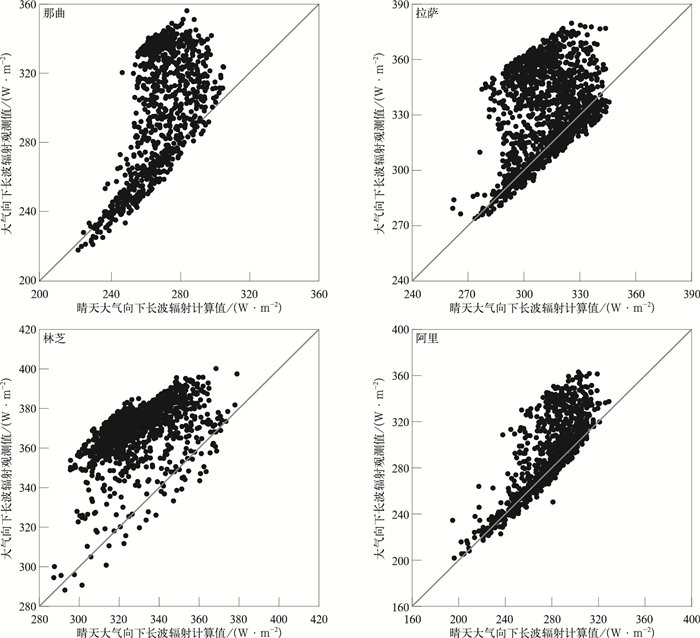
Fig. 4 All observed and calculated cloud-free L↓ at Naqu, Lhasa, Nyingchi and Ali
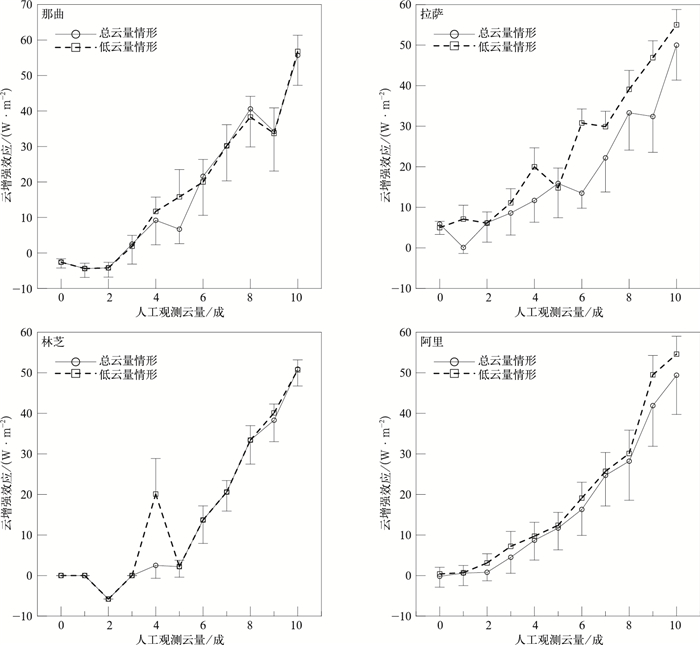
Fig. 5 Enhancements of L↓ and the artificially observed cloud amount (error bars of L↓ enhancement corresponding to total(low) cloud amount are the downward(upward) direction) at Naqu, Lhasa, Nyingchi and Ali
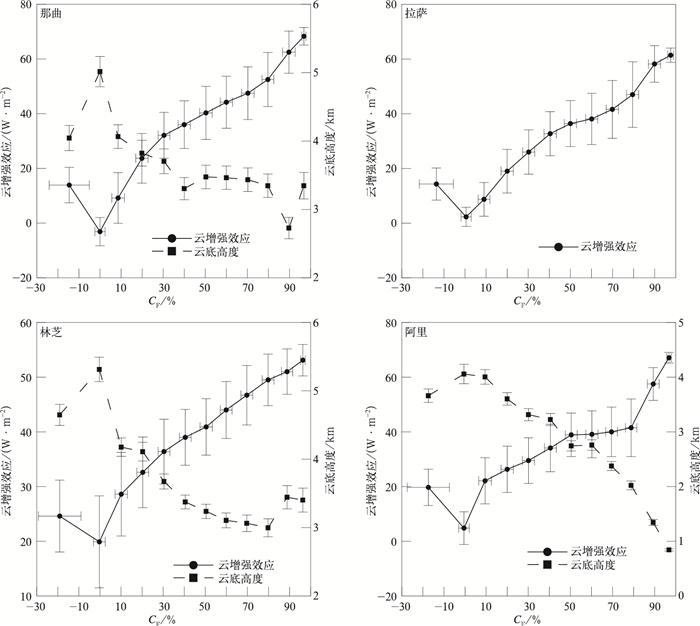
Fig. 6 L↓enhancement effect, CF and its corresponding variations of zenith averaged cloud basement height at Naqu, Lhasa, Nyingchi and Ali
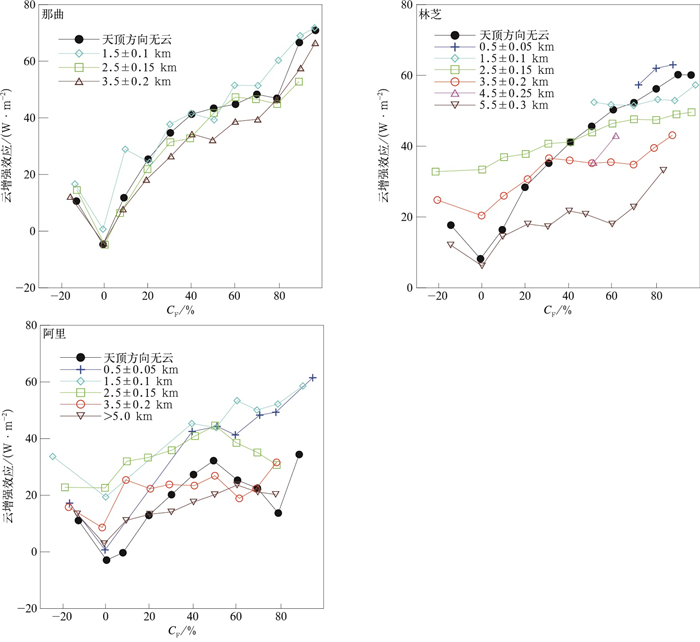
Fig. 7 Given the fixed zenith cloud base height, L↓ enhancement effects as functions of CF variations at Naqu, Nyingchi and Ali in daytime
Table 1 General descriptions of 4 sites deploying L↓ observations
| 观测站 | 观测时段 | 观测时段日平均气象要素 | 辅助观测 | |||
| 气温/℃ | 水汽压/hPa | 云量/成 | 日照/h | |||
| 那曲 | 2011-07—08 | 9.4±8.0 | 7.4±5.0 | 6.8 | 5.4 | CM21,激光雷达 |
| 拉萨 | 2012-05—07 | 18.0±10.0 | 8.39±5.0 | 6.9 | 5.4 | CM21 |
| 林芝 | 2014-06—07 | 16.8±10.0 | 13.4±4.0 | 9.0 | 2.6 | CM21,激光雷达 |
| 阿里 | 2016-05—09 | 14.0±8.0 | 4.8±4.0 | 4.9 | 7.2 | CM21,激光雷达 |
 DownLoad: Download CSV
Table 2 General descriptions of surface L↓ parameterization schemes under cloud-free condition
| 来源 | 晴天比辐射率ε | a | b | c |
| 文献[17] | a-be-ce | 0.83 | 0.18 | 0.067 |
| 文献[18] | a+b(e)1/2 | 0.52 | 0.065 | |
| 文献[19] | aT2 | 9.365×10⁻⁶ | ||
| 文献[20] | 1-ae-b(273-T)2 | 0.261 | 7.77×10⁻⁴ | |
| 文献[21] | a(e/T)1/b | 1.24 | 7 | |
| 文献[22] | a(1-e-e(T/b)) | 1.08 | 2016 | |
| 文献[23] | a+beec/T | 0.7 | 5.95×10⁻⁵ | 1500 |
| 文献[24] | 0.23+a(e/T)(1/b) | 0.484 | 8 | |
| 文献[25] | 1-(1+a)e-(b+ca)0.5 | 46.5(e/T) | 1.2 | 3 |
| 文献[26] | 1-ae-be/T | 0.43 | 11.5 | |
| 注:e为近地面水汽压,单位为hPa; T为近地面气温,单位为K。 | ||||
DownLoad: Download CSV
Table 3 Statistics of day-time cloud base height frequency distribution and its corresponding CF and L↓ enhancements
| 台站 | 统计变量 | (0 km,1 km] | (1 km,2 km] | (2 km,3 km] | (3 km,4 km] | (4 km,5 km] | >5 km |
| 那曲 | 出现频率/% | 6.2 | 31.4 | 33.4 | 8.6 | 1.2 | 18.4 |
| 云底高度/km | 0.8±0.15 | 1.5±0.28 | 2.5±0.28 | 3.3±0.26 | 4.4±0.28 | 10.6±2.7 | |
| CF/% | 60±24 | 54±33 | 33±36 | 40±35 | 47±29 | 41±34 | |
| L↓增强/(W·m-2) | 55±19 | 44±25 | 24±27 | 31±26 | 33±20 | 24±24 | |
| 林芝 | 出现频率/% | 1.3 | 15.9 | 50.5 | 16.7 | 6.2 | 9.1 |
| 云底高度/km | 0.8±0.16 | 1.8±0.24 | 2.4±0.29 | 3.4±0.25 | 4.4±0.27 | 10.0±3.5 | |
| CF/% | 76±13 | 68±17 | 55±25 | 41±29 | 36±32 | 27±34 | |
| L↓增强/(W·m-2) | 57±5 | 52±5 | 45±9 | 35±11 | 26±13 | 18±15 | |
| 阿里 | 出现频率/% | 15.4 | 15.6 | 30.2 | 15.8 | 3.4 | 19.4 |
| 云底高度/km | 0.5±0.21 | 1.6±0.3 | 2.5±0.28 | 3.3±0.24 | 4.5±0.28 | 7.77±1.4 | |
| CF/% | 27±36 | 44±35 | 31±35 | 15±34 | 21±33 | 20±31 | |
| L↓增强/(W·m-2) | 26±27 | 45±16 | 33±16 | 20±14 | 22±15 | 19±15 |
DownLoad: Download CSV
| [1] |
张瑛, 高庆先.硫酸盐和碳黑气溶胶辐射效应的研究.应用气象学报, 1997, 8(增刊Ⅰ):87-91. http://www.cnki.com.cn/Article/CJFDTotal-YYQX7S1.011.htm
|
| [2] |
李维亮, 程耕奎.1979年夏季青藏高原地区云对辐射周期振荡的作用.气象科学研究院院刊, 1988(1):64-69. http://www.wanfangdata.com.cn/details/detail.do?_type=perio&id=QK000004908151
|
| [3] |
Ohmura A.Physical basis for the temperature-based melt-index method.J Appl Meteor, 2001, 40(4):753-761. doi: 10.1175/1520-0450(2001)040<0753:PBFTTB>2.0.CO;2
|
| [4] |
Zhao W, William R, Roland S.The significance of detailed structure in the boundary layer to thermal radiation at the surface in climate model.Geophys Res Lett, 1994, 21(15):1631-1634. doi: 10.1029/94GL01393
|
| [5] |
汪方, 丁一汇, 徐影.辐射参数化方案对一个海气耦合模式云和辐射模拟的影响.应用气象学报, 2007, 18(3):257-265. doi: 10.3969/j.issn.1001-7313.2007.03.001
|
| [6] |
彭丽春, 李万彪, 叶晶, 等.地表向下短波和长波辐射遥感参数化方案研究综述.北京大学学报, 2015, 51(4):772-782. http://d.old.wanfangdata.com.cn/Periodical/bjdxxb201504024
|
| [7] |
Crawford T, Duchon C.An improved parameterization for estimating effective atmospheric emissivity for use in calculating daytime downwelling Longwave Radiation.J Appl Meteor, 1999, 38(4):474-480. doi: 10.1175/1520-0450(1999)038<0474:AIPFEE>2.0.CO;2
|
| [8] |
杨汉波, 吕华芳, 胡庆芳, 等.华北平原的大气逆辐射参数化方法比较.清华大学学报, 2014, (5):590-595. http://www.wanfangdata.com.cn/details/detail.do?_type=perio&id=SciencePaper201407310000017673
|
| [9] |
江灏, 吴青柏, 王可丽, 等.青藏铁路沿线地表和路基表面热力学模式(Ⅲ):参数化方案.冰川冻土, 2005, 27(5):680-685. http://d.wanfangdata.com.cn/Periodical/bcdt200505010
|
| [10] |
中国气象局监测网络司, 译.地面辐射基准站网操作手册.北京:气象出版社, 2004.
|
| [11] |
宋建洋, 郑向东, 程兴宏, 等.临安与龙凤山辐射数据质量及初步结果比较.应用气象学报, 2013, 24(1):65-74. doi: 10.3969/j.issn.1001-7313.2013.01.007
|
| [12] |
Liang Hong, Zhang Renhe, Liu Jingmiao, et al.Estimation of hourly solar radiation at the surface under cloudless conditions on the Tibetan Plateau using a simple radiati6on model.Adv Atmos Sci, 2012, 29(4):675-689. doi: 10.1007/s00376-012-1157-1
|
| [13] |
赵兴炳.青藏高原不同地区夏季近地面能量输送与微气象特征比较分析.高原山地气象研究, 2011, 31(1):6-11. doi: 10.3969/j.issn.1674-2184·2011.01.002
|
| [14] |
Gubler S, Gruber S, Purves R S.Uncertainties of parameterized surface downward clear-sky shortwave and all-sky longwave radiation.Atmospheric Chemistry & Physics, 2012, 12(11):5077-5098. http://d.old.wanfangdata.com.cn/OAPaper/oai_doaj-articles_1e4da72c649065bb65503023646aad24
|
| [15] |
盛裴轩, 毛节泰, 李建国, 等.大气物理学.北京:北京大学出版社, 2003.
|
| [16] |
Staley D, Jurica G.Effective atmospheric emissivity under clear skies.J Appl Meteor, 1972, 11:349-356. doi: 10.1175/1520-0450(1972)011<0349:EAEUCS>2.0.CO;2
|
| [17] |
Angström A.A Study of the Radiation of the Atmosphere: Smithsonian Institution.1915.
|
| [18] |
Brunt D.Notes on radiation in the atmosphere.Quart J Roy Meteor Soc, 1932, 58(247):389-420. doi: 10.1002-qj.49705824704/
|
| [19] |
Swinbank W.Long-wave radiation from clear skies.Quart J Roy Meteor Soc, 1963, 89:339-348. doi: 10.1002/(ISSN)1477-870X
|
| [20] |
Idso S B, Jackson R D.Thermal radiation from the atmosphere.J Geophys Res, 1969, 74(23):5397-5403. doi: 10.1029/JC074i023p05397
|
| [21] |
Brutsaert W.On a derivable formula for long-wave radiation from clear skies.Water Resour Res, 1975, 11(5):742-744. doi: 10.1029/WR011i005p00742
|
| [22] |
Satterlund D R.An improved equation for estimating long-wave radiation from the atmosphere.Water Resour Res, 1979, 15(6):1649-1650. doi: 10.1029/WR015i006p01649
|
| [23] |
Idso S B.A set of equations for full spectrum and 8 to 14μm and 10.5 to 12.5μm thermal radiation from cloudless skies.Water Resour Res, 1981, 17(2):295-304. doi: 10.1029/WR017i002p00295
|
| [24] |
Konzelmann T, Wal R, Greuell W, et al.Parameterization of global and longwave incoming radiation for the Greenland Ice Sheet.Global and Planetary Change, 1994, 9(1-2):143-164. doi: 10.1016/0921-8181(94)90013-2
|
| [25] |
Prata A J.A new long-wave formula for estimating downward clear-sky radiation at the surface.Quart J Roy Meteor Soc, 1996, 122(533):1127-1151. doi: 10.1002/(ISSN)1477-870X
|
| [26] |
Iziomon M G, Mayer H, Matzarakis A.Downward atmospheric longwave irradiance under clear and cloudy skies:Measurement and parameterization.Journal of Atmospheric and Solar-Terrestrial Physics, 2010, 65(10):1107-1116. http://d.old.wanfangdata.com.cn/NSTLQK/NSTL_QKJJ024993953/
|
| [27] |
Wang K, Liang S.Global atmospheric downward longwave radiation over land surface under all-sky conditions from 1973 to 2008.J Geophys Res, 2009, 114, D19101, DOI: 10.1029/2009JD011800.
|
| [28] |
陆龙骅, 周国贤.1992年夏季珠穆朗玛峰地区的太阳直接辐射和总辐射.太阳能学报, 1995, 16(3):229-233. http://www.cnki.com.cn/Article/CJFDTotal-TYLX503.000.htm
|
| [29] |
Dahlback A, Gelsor N, Stamnes J, et al.UV measurements in the 3000-5000 m altitude region in Tibet.J Geophys Res, 2007, 112(9):139-155. http://www.wanfangdata.com.cn/details/detail.do?_type=perio&id=JJ021584410
|
| [30] |
陈树, 郑向东, 林伟立, 等.西藏当雄地基紫外线指数观测研究.应用气象学报, 2015, 26(4):482-291. http://qikan.camscma.cn/jams/ch/reader/view_abstract.aspx?file_no=20150410&flag=1
|
| [31] |
李清泉, 王兰宁, 徐影, 等.辐射参数化方案对气候模拟和回报的影响.应用气象学报, 2005, 16(增刊Ⅰ):12-21. http://kns.cnki.net/KCMS/detail/detail.aspx?filename=YYQX2005S1001&dbname=CJFD&dbcode=CJFQ
|
| [32] |
沈元芳, Baer F, 王超.初始场和长波辐射对气候模拟的影响.应用气象学报, 2003, 14(3):266-276. doi: 10.3969/j.issn.1001-7313.2003.03.002
|
| [33] |
周广强, 赵春生, 丁守国, 等.不同辐射传输方案对中尺度降水影响的对比分析.应用气象学报, 2005, 16(2):148-158. doi: 10.3969/j.issn.1001-7313.2005.02.003
|
| [34] |
Dupont J C, Haeffelin M, Drobinski P, et al.Parametric model to estimate clear-sky longwave irradiance at the surface on the basis of vertical distribution of humidity and temperature.J Geophys Res, 2008, 113(7):1829-1836. doi: 10.1029-2007JD009046/
|
| [35] |
Gr bner J, Wacker S, Vuilleumier L, et al.Effective atmospheric boundary layer temperature from longwave radiation measurements.J Geophys Res, 2009, 114, D19116, DOI: 10.1029/2009JD012274.
|
| [36] |
Dupont J, Haeffelin M, Long C N.Evaluation of cloudless-sky periods detected by shortwave and longwave algorithms using lidar measurements.Geophys Res Lett, 2008, 35(10):237-255. http://www.wanfangdata.com.cn/details/detail.do?_type=perio&id=JJ024300696
|
| [37] |
Dürr B, Philipona R.Automatic cloud amount detection by surface longwave downward radiation measurements.J Geophys Res, 2004, 109, D05201, DOI: 10.1029/2003JD004182.
|

Figures(7) / Tables(3)
