Wang Chunzhi, Zhang Lei, Guo Anhong, et al. Long-term meteorological prediction model on the occurrence and development of rice leaf roller based on atmospheric circulation. J Appl Meteor Sci, 2019, 30(5): 565-576. DOI:  10.11898/1001-7313.20190505.
Citation: Wang Chunzhi, Zhang Lei, Guo Anhong, et al. Long-term meteorological prediction model on the occurrence and development of rice leaf roller based on atmospheric circulation. J Appl Meteor Sci, 2019, 30(5): 565-576. DOI:  10.11898/1001-7313.20190505.

Long-term Meteorological Prediction Model on the Occurrence and Development of Rice Leaf Roller Based on Atmospheric Circulation

DOI: 10.11898/1001-7313.20190505
  • Received Date: 2019-05-10
  • Rev Recd Date: 2019-07-24
  • Publish Date: 2019-09-30
  • To understand the possible influencing mechanism of atmospheric circulation on the occurrence and development of rice leaf roller in China, relationships between atmospheric circulation characteristic indices and ratios of the occurrence area of rice leaf roller in China are fully analyzed from 1980 to 2016. 74 atmospheric circulation characteristic indices and their combinations are analyzed by factor puffing. Results show that 46 indices of these atmospheric circulation characteristic ones have significant influences on the ratio of occurrence area of rice leaf roller, and main influencing periods are from July to September, as well as last July to March. Indices of subtropical high category are most influential, followed by polar vortex category, circulation category, trough category and then others. Among 46 significant atmospheric circulation characteristic factors, 27 subtropical high factors and 10 polar vortex factors, accounting for 59% and 22% of the total, respectively, are the main factors influencing the ratio of the occurrence area of rice leaf roller. 10 key atmospheric circulation characteristic indices that directly influence the ratio of occurrence area of rice leaf roller are determined, and 7 of them have great change at 4 occurrence levels of rice leaf roller as light, partially light, partially severe and severe. 9 prediction models for ratios of the occurrence area of rice leaf roller are established to predict at the beginning of January and March to October. The hindcast of 9 models from 1980 to 2014 are good and accuracies in extending prediction years of 2015-2016 are 86.6%, 90.5%, 91.8%, 93.4%, 93.4%, 94.0%, 94.0%, 94.3% and 95.4%, respectively. Key atmospheric circulation characteristic factors represent climate background for the occurrence area of rice leaf roller very well in China. In the rice-planted area the atmospheric circulation influences the temperature, precipitation, etc., and thus affects the ratio of occurrence area of rice leaf roller. The ratio of the occurrence area of rice leaf roller in dry-warm and wet-warm years is usually larger than that in dry-cold years.
  • Fig. 1  Significant circulation characteristic factors influencing the ratio of occurrence area of rice leaf roller in China

    Fig. 2  Main influencing periods of 46 significant circulation characteristic factors

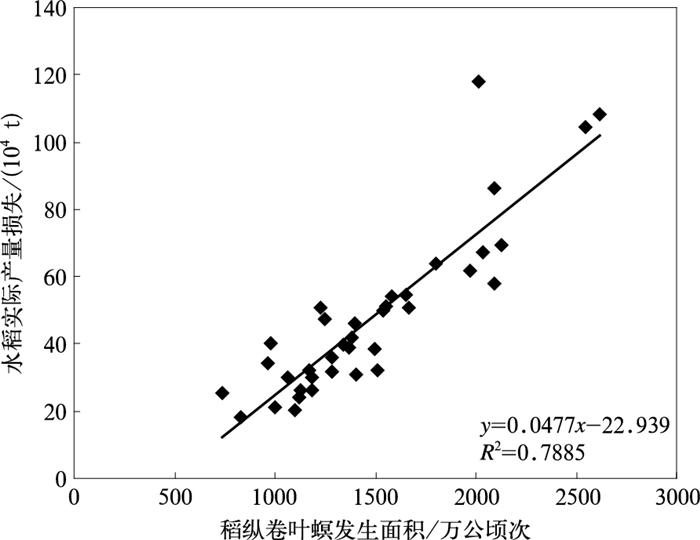
    Fig. 3  The scatter plot between the occurrence area of rice leaf roller and the corresponding loss of rice production in China

    Fig. 4  Scatter plots between the occurrence area, the ratio of occurrence area of rice leaf roller in China and the average temperature, the average maximum temperature in South China from May to Sep

    (a)the scatter plot between the occurrence area of rice leaf roller in China and the average temperature in South China from May to Sep, (b)the scatter plot between the occurrence area of rice leaf roller in China and the average maximum temperature in South China from May to Sep, (c)the scatter plot between the ratio of occurrence area of rice leaf roller in China and the average temperature in South China from May to Sep, (d)the scatter plot between the ratio of occurrence area of rice leaf roller in China and the average maximum temperature in South China from May to Sep

    Table  1  Key circulation characteristic factors for different occurrence levels of rice leaf roller in China

    关键环流特征因子 关键环流特征因子含义 稻纵卷叶螟发生面积率等级指标
    偏轻 偏重
    51s10d1 上年10月至当年1月亚洲区极涡强度指数 86 83 78 74
    52s3s8 上年3—8月太平洋区极涡强度指数 53 50 46 44
    52d5d6 当年5—6月太平洋区极涡强度指数 49 45 41 35
    31s1d9 上年1月至当年9月南海副高脊线 18 16 13 10
    12s7s10 上年7—10月北半球副高强度指数 183 240 330 391
    66s9s10 上年9—10月东亚槽强度 257 264 275 281
    42s3d8 上年3月至当年8月南海副高北界 22 20 16 10
    64d2d3 当年2—3月亚洲经向环流指数 71 68 62 57
    68d3d4 当年3—4月西藏高原指数 689 701 720 732
    39d2d3 当年2—3月东太平洋副高北界 22 15 4 0
    注:亚洲区和太平洋区极涡强度指数、南海副高脊线和副高北界、亚洲经向环流指数、东太平洋副高北界与中国稻纵卷叶螟发生面积率均呈显著负相关关系;北半球副高强度指数、东亚槽强度、西藏高原指数与之则均呈显著正相关关系;且上述相关系数均达到0.001的显著性水平(样本量为35)。
    DownLoad: Download CSV

    Table  2  Prediction time and periods of prediction factors in prediction models of the ratio of occurrence area of rice leaf roller in China

    模型 预报时间 所用因子时段
    1 当年1月初 上年1—12月
    2 当年3月初 上年1月至当年2月
    3 当年4月初 上年1月至当年3月
    4 当年5月初 上年1月至当年4月
    5 当年6月初 上年1月至当年5月
    6 当年7月初 上年1月至当年6月
    7 当年8月初 上年1月至当年7月
    8 当年9月初 上年1月至当年8月
    9 当年10月初 上年1月至当年9月
    DownLoad: Download CSV

    Table  3  Prediction models of the ratio of occurrence area of rice leaf roller in China for Jan, Mar to Oct

    模型 预报模型 关键环流因子 复相关系数
    x1 x2 x3 x4
    1 =41.48-1.33x1+0.25x2+0.05x3-1.09x4 52s3s8 66s9s10 12s7s10 41s11s12 0.8483
    2 =57.13-1.34x1+0.20x2+0.10x3-1.74x4 52s3s8 66s9s10 12s7s10 42s3d2 0.8602
    3 =86.81-1.29x1+0.23x2-1.48x3-0.39x4 52s3s8 66s9s10 39d2d3 64d2d3 0.8705
    4 =-150.80-1.30x1+0.27x2-1.56x3+0.28x4 52s3s8 66s9s10 28d2d3 68d3d4 0.8665
    5 =-150.80-1.30x1+0.27x2-1.56x3+0.28x4 52s3s8 66s9s10 28d2d3 68d3d4 0.8665
    6 =97.73-1.12x1+0.16x2-1.40x3-0.66x4 52s3s8 66s9s10 39d2d3 52d5d6 0.8662
    7 =97.73-1.12x1+0.16x2-1.40x3-0.66x4 52s3s8 66s9s10 39d2d3 52d5d6 0.8662
    8 =86.44-1.60x1+0.15x2+0.09x3-1.72x4 52s3s8 66s9s10 12s7s10 42s3d8 0.8690
    9 =124.01-0.21x1-0.87x2+0.13x3-2.84x4 51s10d1 64d2d3 12s7s10 31s1d9 0.8695
    注:模型1~9中,各回归方程的复相关系数均达到0.001显著性水平(样本量为35)。
    DownLoad: Download CSV

    Table  4  The hindcast accuracy of prediction models of the ratio of occurrence area of rice leaf roller in China from 1980 to 2014

    模型 预报时间 最大准确率/% 最小准确率/% 平均准确率/%
    1 当年1月初 99.4 55.5 83.7
    2 当年3月初 99.7 59.7 85.2
    3 当年4月初 99.2 60.8 86.1
    4 当年5月初 99.5 55.2 85.2
    5 当年6月初 99.5 55.2 85.2
    6 当年7月初 99.5 58.4 87.6
    7 当年8月初 99.5 58.4 87.6
    8 当年9月初 99.9 65.6 85.5
    9 当年10月初 99.7 65.8 86.1
    DownLoad: Download CSV

    Table  5  The extrapolated accuracy of prediction models of the ratio of occurrence area of rice leaf roller in China from 2015 to 2016

    模型 预报时间 2015年准确率/% 2016年准确率/% 两年预测平均准确率/%
    1 当年1月初 81.9 91.2 86.6
    2 当年3月初 91.7 89.3 90.5
    3 当年4月初 94.1 89.4 91.8
    4 当年5月初 94.9 91.9 93.4
    5 当年6月初 94.9 91.9 93.4
    6 当年7月初 95.6 92.4 94.0
    7 当年8月初 95.6 92.4 94.0
    8 当年9月初 95.2 93.5 94.3
    9 当年10月初 97.9 92.9 95.4
    DownLoad: Download CSV

    Table  6  The year type for larger ratios of the occurrence area of rice leaf roller in China from 1980 to 2016

    区域 年型 偏重发生年份 偏重发生年数 各年型年数 各年型偏重发生年份占比/%
    南方15省(区、市) 干冷年 1991,2004 2 9 22
    干暖年 2003,2006,2007,2009,2011,2013 6 9 67
    湿冷年 1999,2002 2 8 25
    湿暖年 2005,2008,2010,2012,2014,2015 6 11 55
    南方4省(华南3省/区及云南省) 干冷年 2004 1 11 9
    干暖年 1991,2003,2007,2009,2011,2012 6 9 67
    湿冷年 1999,2002 2 9 22
    湿暖年 2005,2006,2008,2010,2013,2014,2015 7 8 88
    注:以稻纵卷叶螟发生面积率不低于48%定为偏重发生年份。
    DownLoad: Download CSV
  • [1]
    李传明, 徐健, 杨亚军, 等.人工饲料饲养稻纵卷叶螟的生长发育与繁殖.中国水稻科学, 2011, 25(3):321-325. doi:  10.3969/j.issn.1001-7216.2011.03.014
    [2]
    包云轩, 曹云, 谢晓金, 等.中国稻纵卷叶螟发生特点及北迁的大气背景.生态学报, 2015, 35(11):3519-3533. http://d.old.wanfangdata.com.cn/Periodical/stxb201511003
    [3]
    李照会.农业昆虫与鉴定.北京:中国农业出版社, 2002:205.
    [4]
    王凤英, 胡高, 陈晓, 等.近年来广西南宁稻纵卷叶螟大发生原因分析.中国水稻科学, 2009, 23(5):537-545. doi:  10.3969/j.issn.1001-7216.2009.05.14
    [5]
    全国稻纵卷叶螟研究协作组.我国稻纵卷叶螟迁飞规律研究进展.中国农业科学, 1981(5):1-8. http://www.cnki.com.cn/Article/CJFDTotal-znyk198105000.htm
    [6]
    王翠花, 包云轩, 王建强, 等.2003年稻纵卷叶螟大发生的水汽条件分析.应用生态学报, 2006, 17(9):1693-1698. doi:  10.3321/j.issn:1001-9332.2006.09.028
    [7]
    姜淦, 王茹琳, 王闫利, 等.基于气候变化的稻纵卷叶螟在我国的风险区预测与分析.气象与环境科学, 2017, 40(3):21-27. http://www.wanfangdata.com.cn/details/detail.do?_type=perio&id=hnqx201703004
    [8]
    陆明红, 刘万才, 胡高, 等.中越水稻迁飞性害虫稻飞虱、稻纵卷叶螟发生关系分析.植物保护, 2018, 44(3):31-36. http://www.wanfangdata.com.cn/details/detail.do?_type=perio&id=zwbh201803007
    [9]
    周广胜, 何奇瑾, 汲玉河.适应气候变化的国际行动和农业措施研究进展.应用气象学报, 2016, 27(5):527-533. http://qikan.camscma.cn/jams/ch/reader/view_abstract.aspx?file_no=20160502&flag=1
    [10]
    霍治国, 陈林, 叶彩玲, 等.气候条件对中国水稻稻飞虱为害规律的影响.自然灾害学报, 2002, 11(1):97-102. doi:  10.3969/j.issn.1004-4574.2002.01.016
    [11]
    Masahiko Morishita.A possible relationship between outbreaks of rice planthoppers in Japan and the El Nio phenomenon.Plant Epidemic Prevention, 1992, 46(5):11-13.
    [12]
    Wood C R, Chapman J W, Reynolds D R, et al.The influence of the atmospheric boundary layer on nocturnal layers of noctuids and other moths migrating over southern Britain.Int J Biometeor, 2006, 50(4):193-204. doi:  10.1007/s00484-005-0014-7
    [13]
    Park H H, Ahn J J, Park C G.Temperature-dependent development of Cnaphalocrocis medinalis Guenée (Lepidoptera:Pyralidae) and their validation in semi-field condition.J Asia-Pac Entomol, 2014(17):83-91.
    [14]
    翟保平, 张孝羲.迁飞过程中昆虫的行为:对风温场的适应与选择.生态学报, 1993, 13(4):356-363. doi:  10.3321/j.issn:1000-0933.1993.04.002
    [15]
    翟保平, 张孝羲.稻纵卷叶螟标记蛾迁飞轨迹的数值模拟.西南农业大学学报, 1998, 20(5):528-535. http://www.cnki.com.cn/Article/CJFDTotal-XNND805.029.htm
    [16]
    谈涵秋, 毛瑞曾, 程极益, 等.褐飞虱远距离迁飞中的降落和垂直气流、降雨的关系.南京农学院学报, 1984(2):18-25. http://www.cnki.com.cn/Article/CJFDTotal-NJNY198402003.htm
    [17]
    王翠花, 包云轩, 王建强, 等.2003年稻纵卷叶螟重大迁入过程的大气动力机制分析.昆虫学报, 2006, 49(4):604-612. doi:  10.3321/j.issn:0454-6296.2006.04.011
    [18]
    包云轩, 王永平, 严明良, 等.2003年我国稻纵卷叶螟发生特征及其灾变大气背景的研究.气象科学, 2008, 28(2):184-189. doi:  10.3969/j.issn.1009-0827.2008.02.010
    [19]
    包云轩, 唐辟如, 孙思思, 等.中南半岛前期异常气候条件对中国南方稻区褐飞虱灾变性迁入的影响及其预测模型.生态学报, 2018, 38(8):2934-2947. http://www.wanfangdata.com.cn/details/detail.do?_type=perio&id=stxb201808031
    [20]
    侯婷婷, 霍治国, 卢志光, 等.副热带高压与中国稻飞虱发生关系的研究.自然灾害学报, 2003, 12(2):213-219.
    [21]
    钱拴, 霍治国.大气环流对中国稻飞虱为害的影响及其预测.气象学报, 2007, 65(6):994-1002. doi:  10.3321/j.issn:0577-6619.2007.06.017
    [22]
    于彩霞, 霍治国, 张蕾, 等.中国稻飞虱发生的大气环流指示指标.生态学杂志, 2014, 33(4):1053-1060. http://www.wanfangdata.com.cn/details/detail.do?_type=perio&id=stxzz201404030
    [23]
    白蕤, 李宁, 吴立, 等.大气环流指数对海南省稻飞虱发生的影响.江苏农业科学, 2017, 45(15):80-85. http://www.wanfangdata.com.cn/details/detail.do?_type=perio&id=jsnykx201715020
    [24]
    侯英雨, 张蕾, 吴门新, 等.国家级现代农业气象业务技术进展.应用气象学报, 2018, 29(6):641-656. http://qikan.camscma.cn/jams/ch/reader/view_abstract.aspx?file_no=20180601&flag=1
    [25]
    霍治国, 范雨娴, 杨建莹, 等.中国农业洪涝灾害研究进展.应用气象学报, 2017, 28(6):641-653. http://qikan.camscma.cn/jams/ch/reader/view_abstract.aspx?file_no=20170601&flag=1
    [26]
    高苹, 武金岗, 杨荣明, 等.江苏省稻纵卷叶螟迁入期虫情指标与西太平洋海温的遥相关及其长期预报模型.应用生态学报, 2008, 19(9):2056-2066. http://www.wanfangdata.com.cn/details/detail.do?_type=perio&id=yystxb200809030
    [27]
    冼晓青, 翟保平, 张孝羲, 等.江苏沿江和江淮区褐飞虱前期迁入量与太平洋海温场的遥相关及其可能机制.昆虫学报, 2007, 50(6):578-587. doi:  10.3321/j.issn:0454-6296.2007.06.006
    [28]
    姜燕, 霍治国, 李世奎, 等.全国小麦条锈病长期预报模型比较研究.自然灾害学报, 2006, 15(6):109-113. doi:  10.3969/j.issn.1004-4574.2006.06.019
    [29]
    中国气象局预测减灾司, 中国气象局国家气象中心.中国气象地理区划手册.北京:气象出版社:2006.
    [30]
    陈正洪, 马德栗.湖北省1961-2008年冷冬时空变化特征//中国气象局国家气候中心暨气候研究开放实验室2010年度学术年会论文集.北京: 国家气候中心, 中国气象局气候研究开放实验室, 2011.
    [31]
    秦钟, 章家恩, 骆世明, 等.温度影响下的稻纵卷叶螟实验种群动态的系统动力学模拟.中国农业气象, 2011, 32(2):303-310. doi:  10.3969/j.issn.1000-6362.2011.02.026
    [32]
    Wan Nianfeng, Ji Xiangyun, Cao Liming, et al.The occurrence of rice leaf roller, Cnaphalocrocis medinalis Guenée in the large-scale agricultural production on Chongming Eco-island in China.Ecol Eng, 2015, 77:37-39. doi:  10.1016/j.ecoleng.2015.01.006
    [33]
    Gu Lingling, Li Mingzhu, Wang Gaorong, et al.Multigenerational heat acclimation increases thermal tolerance and expression levels of Hsp70 and Hsp90 in the rice leaf folder larvae.J Therm Biol, 2019, 81:103-109. doi:  10.1016/j.jtherbio.2019.02.024
    [34]
    王玉洁, 周波涛, 任玉玉, 等.全球气候变化对我国气候安全影响的思考.应用气象学报, 2016, 27(6):750-758. http://qikan.camscma.cn/jams/ch/reader/view_abstract.aspx?file_no=20160612&flag=1
    [35]
    霍治国, 李茂松, 王丽, 等.气候变暖对中国农作物病虫害的影响.中国农业科学, 2012, 45(10):1926-1934. doi:  10.3864/j.issn.0578-1752.2012.10.005
    [36]
    谭桂容, 范艺媛, 牛若芸.江淮地区强降水分型及其环流演变.应用气象学报, 2018, 29(4):396-409. http://qikan.camscma.cn/jams/ch/reader/view_abstract.aspx?file_no=20180402&flag=1
    [37]
    王月, 张强, 顾西辉, 等.淮河流域夏季降水异常与若干气候因子的关系.应用气象学报, 2016, 27(1):67-74. http://qikan.camscma.cn/jams/ch/reader/view_abstract.aspx?file_no=20160107&flag=1
    [38]
    晏红明, 王灵.西北太平洋副高东西变动与西南地区降水的关系.应用气象学报, 2019, 30(3):360-375. http://qikan.camscma.cn/jams/ch/reader/view_abstract.aspx?file_no=20190309&flag=1
    [39]
    陈思, 高建芸, 黄丽娜, 等.华南前汛期持续性暴雨年代际变化特征及成因.应用气象学报, 2017, 28(1):86-97. http://qikan.camscma.cn/jams/ch/reader/view_abstract.aspx?file_no=20170108&flag=1
  • 加载中
  • -->

Catalog

    Figures(4)  / Tables(6)

    Article views (4349) PDF downloads(54) Cited by()
    • Received : 2019-05-10
    • Accepted : 2019-07-24
    • Published : 2019-09-30

    /

    DownLoad:  Full-Size Img  PowerPoint