| 生育阶段 | Ⅰ区 | Ⅱ区 | Ⅲ区 | Ⅳ区 | Ⅴ区 |
| 播种至出苗 | 1170 | 1180 | 1100 | 1150 | 1250 |
| 出苗至开花 | 600 | 620 | 610 | 600 | 610 |
| 开花至成熟 | 110 | 120 | 120 | 130 | 120 |
| Citation: |
Li Ying, Zhao Guoqiang, Chen Huailiang, et al. WOFOST model parameter calibration based on agro-climatic division of winter wheat. J Appl Meteor Sci, 2021, 32(1): 38-51. DOI: 10.11898/1001-7313.20210104.

|
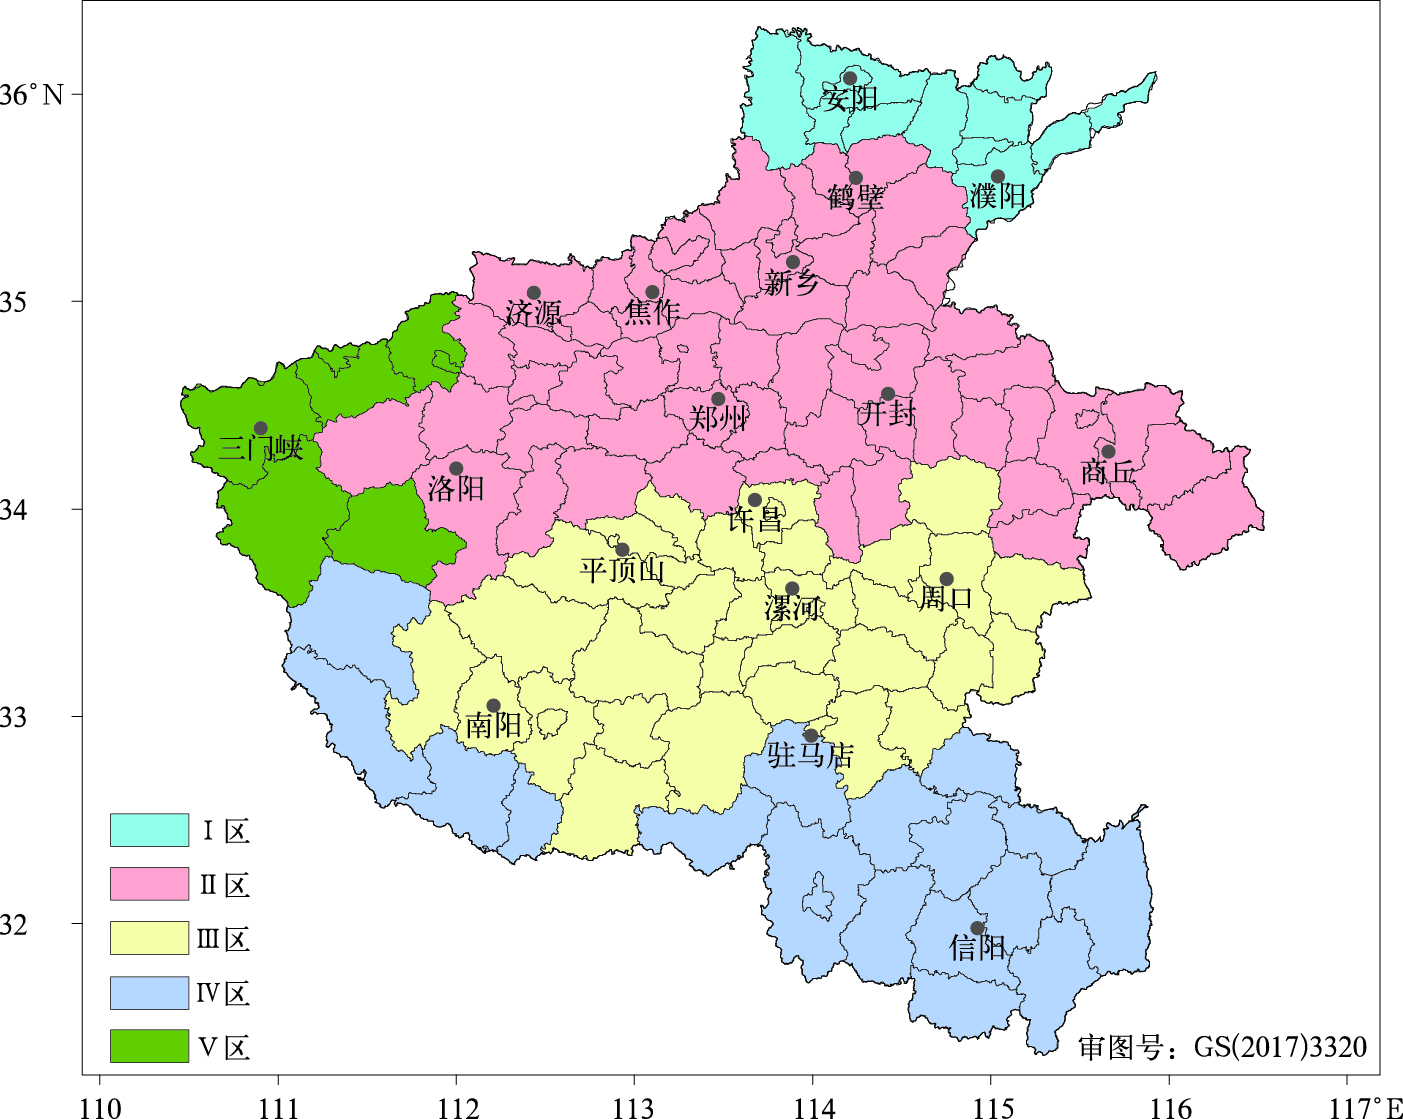
Fig 1. Agro-climatic division of winter wheat in Henan Province
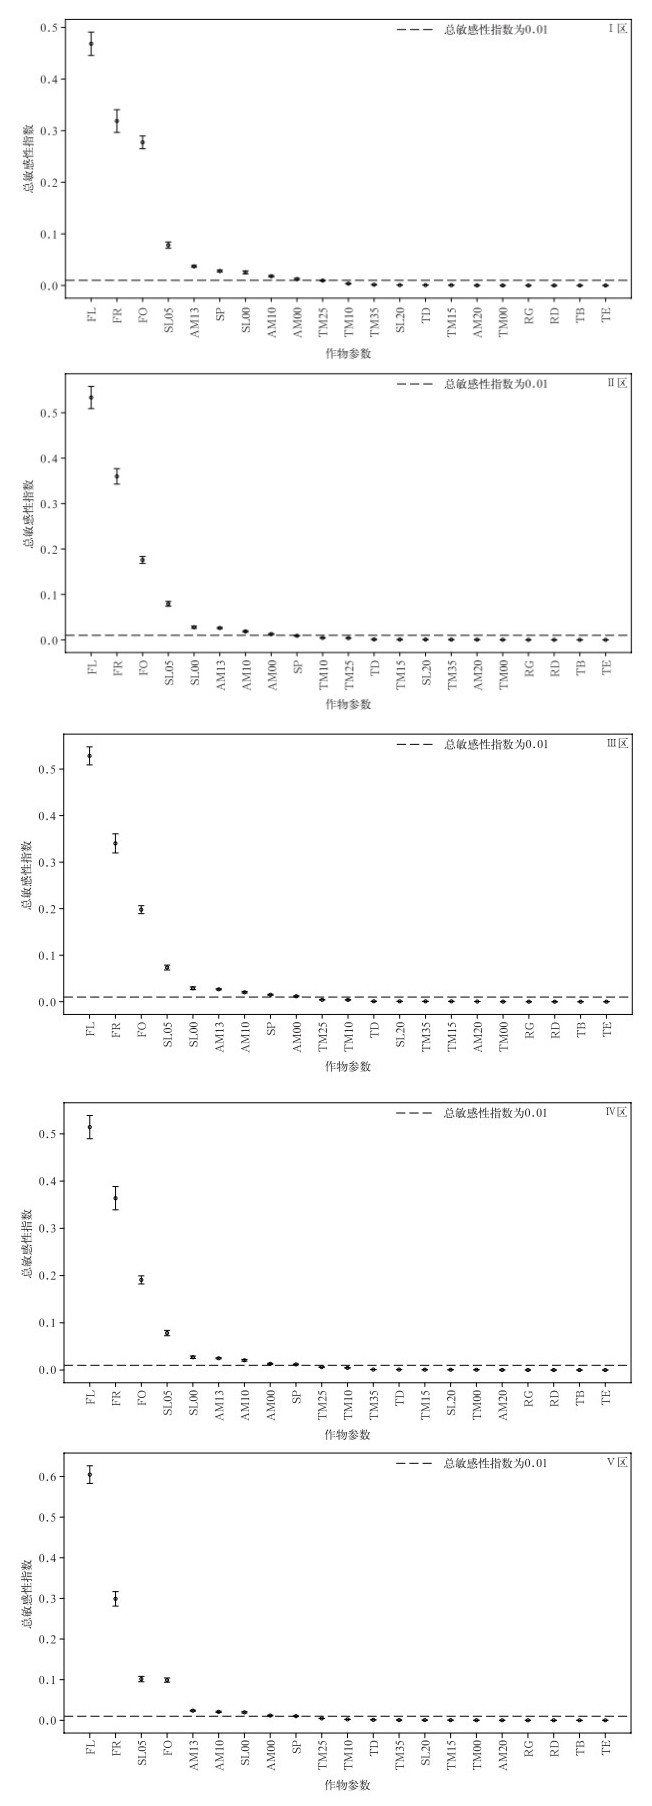
Fig 2. Total sensitivity index of parameters in five agro-climatic ecological zones
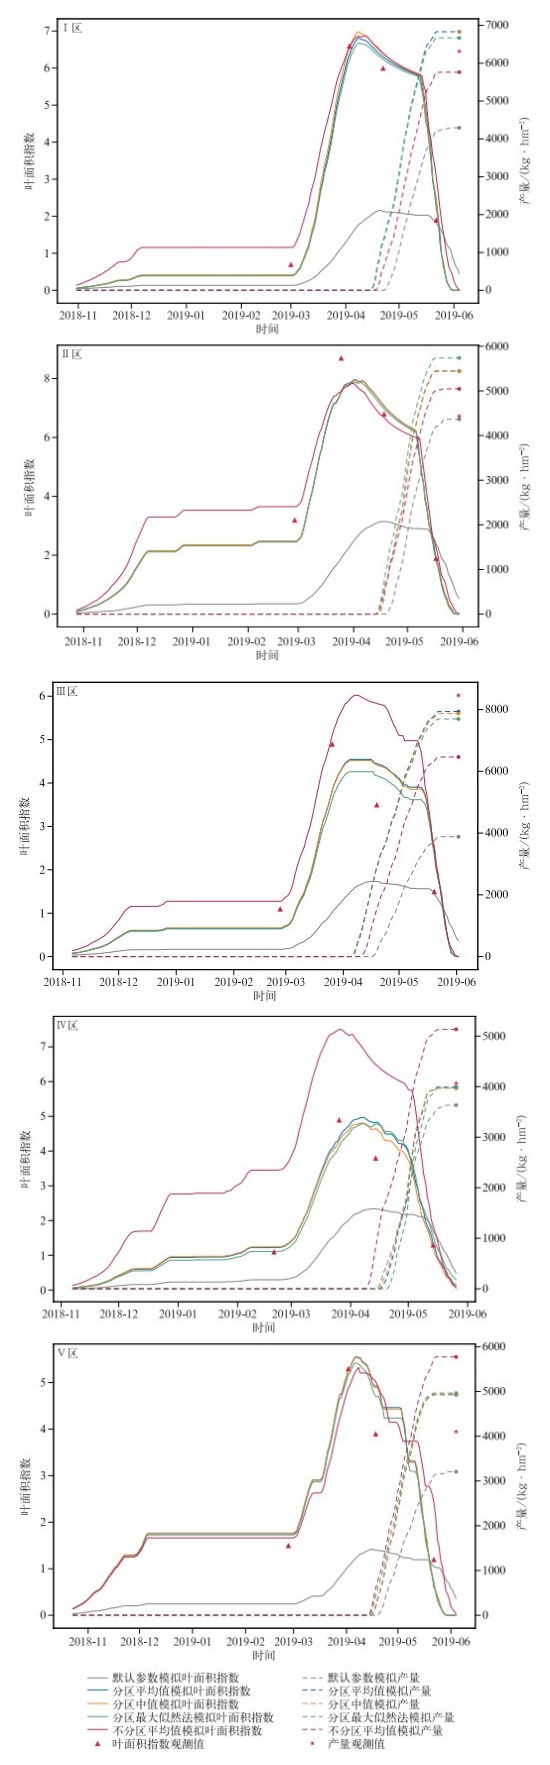
Fig 3. Verification results of yield and leaf area index in 2019
Table 1 Accumulated temperature parameters of winter wheat in different zones(unit:℃·d)
| 生育阶段 | Ⅰ区 | Ⅱ区 | Ⅲ区 | Ⅳ区 | Ⅴ区 |
| 播种至出苗 | 1170 | 1180 | 1100 | 1150 | 1250 |
| 出苗至开花 | 600 | 620 | 610 | 600 | 610 |
| 开花至成熟 | 110 | 120 | 120 | 130 | 120 |
 DownLoad: CSV
Table 2 The proportion of changes of parameters to be analyzed around the default value
| 参数 | 定义 | 最小比例 | 最大比例 |
| AM00 | 发育期为0时CO2最大同化速率 | 0.7 | 1.5 |
| AM10 | 发育期为1时CO2最大同化速率 | 0.7 | 1.5 |
| AM13 | 发育期为1.3时CO2最大同化速率 | 0.7 | 1.5 |
| AM20 | 发育期为2时CO2最大同化速率 | 0.7 | 1.5 |
| SL00 | 发育期为0时比叶面积 | 0.7 | 1.5 |
| SL05 | 发育期为0.5时比叶面积 | 0.7 | 1.5 |
| SL20 | 发育期为2时比叶面积 | 0.7 | 1.5 |
| FL | 总物质分配到叶片的比例 | 0.5 | 2.0 |
| FO | 总物质分配到储存器官的比例 | 0.8 | 1.2 |
| FR | 总物质分配到根的比例 | 0.5 | 2.0 |
| SP | 35℃时叶片的生命周期 | 0.7 | 1.5 |
| TB | 出苗最低温度 | 0.5 | 1.5 |
| TD | 初始总干物质重量 | 0.9 | 1.3 |
| TE | 出苗最高有效温度 | 0.9 | 1.3 |
| TM00 | 日平均温度为0℃时CO2最大同化速率减小因子 | 0.7 | 1.5 |
| TM10 | 日平均温度为10℃时CO2最大同化速率减小因子 | 0.7 | 1.3 |
| TM15 | 日平均温度为15℃时CO2最大同化速率减小因子 | 0.7 | 1.5 |
| TM25 | 日平均温度为25℃时CO2最大同化速率减小因子 | 0.7 | 1.5 |
| TM35 | 日平均温度为35℃时CO2最大同化速率减小因子 | 0.7 | 1.5 |
| RD | 根的相对死亡速率 | 0.9 | 1.0 |
| RG | 叶面积指数最大日增量 | 0.9 | 1.3 |
DownLoad: CSV
Table 3 Modeling data and verification data used for parameter calibration
| 研究区 | 优化数据 | 验证数据 | |||
| 年份 | 站点 | 年份 | 站点 | ||
| Ⅰ区 | 2013 | 林州 | |||
| 2014 | 汤阴 | ||||
| 2015 | 安阳 | 2018—2019 | 汤阴 | ||
| 2016 | 濮阳 | ||||
| 2017 | 范县 | ||||
| Ⅱ区 | 2013 | 郑州 | |||
| 2014 | 商丘 | ||||
| 2015 | 伊川 | 2018—2019 | 郑州 | ||
| 2016 | 济源 | ||||
| 2017 | 郑州 | ||||
| Ⅲ区 | 2013 | 许昌 | |||
| 2014 | 许昌 | ||||
| 2015 | 黄泛区 | 2018—2019 | 黄泛区 | ||
| 2016 | 驻马店 | ||||
| 2017 | 南阳 | ||||
| Ⅳ区 | 2013 | 信阳 | |||
| 2014 | 正阳 | ||||
| 2015 | 新野 | 2018—2019 | 潢川 | ||
| 2016 | 潢川 | ||||
| 2017 | 固始 | ||||
| Ⅴ区 | 2013 | 卢氏 | |||
| 2014 | 三门峡 | ||||
| 2015 | 三门峡 | 2018—2019 | 卢氏 | ||
| 2016 | 卢氏 | ||||
| 2017 | 卢氏 | ||||
DownLoad: CSV
Table 4 The posteriori distribution of sensitive parameters in Zone Ⅰ of Henan Province
| 参数 | 平均值 | 中值 | 最大似然值 | 均方根误差 | 95%置信区间 |
| AM00 | 1.369 | 1.414 | 1.470 | 0.00396 | [1.361, 1.377] |
| AM10 | 1.351 | 1.374 | 1.426 | 0.00301 | [1.345, 1.357] |
| AM13 | 0.729 | 0.722 | 0.704 | 0.00070 | [0.728, 0.731] |
| SL00 | 1.443 | 1.455 | 1.500 | 0.00130 | [1.440, 1.445] |
| SL05 | 0.774 | 0.770 | 0.707 | 0.00127 | [0.771, 0.776] |
| FL | 1.904 | 1.932 | 1.994 | 0.00220 | [1.900, 1.909] |
| FO | 0.857 | 0.856 | 0.860 | 0.00023 | [0.856, 0.857] |
| FR | 1.423 | 1.429 | 1.487 | 0.00131 | [1.421, 1.426] |
| SP | 0.831 | 0.829 | 0.826 | 0.00026 | [0.831, 0.832] |
DownLoad: CSV
Table 5 The posteriori distribution of sensitive parameters in Zone Ⅱ of Henan Province
| 参数 | 平均值 | 中值 | 最大似然值 | 均方根误差 | 95%置信区间 |
| AM00 | 0.761 | 0.750 | 0.704 | 0.00176 | [0.757, 0.764] |
| AM10 | 1.397 | 1.410 | 1.412 | 0.00274 | [1.392, 1.403] |
| AM13 | 0.793 | 0.785 | 0.760 | 0.00235 | [0.788, 0.798] |
| SL00 | 1.350 | 1.361 | 1.458 | 0.00385 | [1.342, 1.357] |
| SL05 | 0.772 | 0.759 | 0.737 | 0.00195 | [0.768, 0.775] |
| FL | 1.823 | 1.848 | 1.973 | 0.00496 | [1.813, 1.833] |
| FO | 0.921 | 0.920 | 0.901 | 0.00055 | [0.919, 0.922] |
| FR | 0.946 | 0.964 | 1.112 | 0.00573 | [0.934, 0.957] |
| SP | 0.822 | 0.824 | 0.824 | 0.00034 | [0.822, 0.823] |
DownLoad: CSV
Table 6 The posteriori distribution of sensitive parameters in Zone Ⅲ of Henan Province
| 参数 | 平均值 | 中值 | 最大似然值 | 均方根误差 | 95%置信区间 |
| AM00 | 0.715 | 0.711 | 0.702 | 0.00040 | [0.714, 0.716] |
| AM10 | 0.891 | 0.872 | 0.869 | 0.00319 | [0.885, 0.897] |
| AM13 | 0.738 | 0.730 | 0.700 | 0.00089 | [0.737, 0.740] |
| SL00 | 1.352 | 1.376 | 1.498 | 0.00296 | [1.346, 1.358] |
| SL05 | 1.082 | 1.067 | 1.144 | 0.00383 | [1.075, 1.090] |
| FL | 1.326 | 1.334 | 1.215 | 0.00426 | [1.317, 1.334] |
| FO | 0.809 | 0.807 | 0.802 | 0.00023 | [0.809, 0.810] |
| FR | 0.790 | 0.787 | 0.794 | 0.00397 | [0.782, 0.798] |
| SP | 0.932 | 0.938 | 0.940 | 0.00042 | [0.932, 0.933] |
DownLoad: CSV
Table 7 The posteriori distribution of sensitive parameters in Zone Ⅳ of Henan Province
| 参数 | 平均值 | 中值 | 最大似然值 | 均方根误差 | 95%置信区间 |
| AM00 | 1.446 | 1.460 | 1.496 | 0.00094 | [1.444, 1.447] |
| AM10 | 1.118 | 1.127 | 0.744 | 0.00472 | [1.109, 1.128] |
| AM13 | 1.418 | 1.441 | 1.497 | 0.00151 | [1.415, 1.421] |
| SL00 | 1.174 | 1.188 | 0.918 | 0.00304 | [1.168, 1.180] |
| SL05 | 0.799 | 0.777 | 0.711 | 0.00164 | [0.796, 0.802] |
| FL | 1.090 | 1.076 | 1.297 | 0.00250 | [1.085, 1.095] |
| FO | 1.033 | 1.021 | 1.124 | 0.00076 | [1.031, 1.034] |
| FR | 0.625 | 0.595 | 0.602 | 0.00198 | [0.621, 0.629] |
| SP | 0.834 | 0.829 | 0.828 | 0.00027 | [0.833, 0.834] |
DownLoad: CSV
Table 8 The posteriori distribution of sensitive parameters in Zone Ⅴ of Henan Province
| 参数 | 平均值 | 中值 | 最大似然值 | 均方根误差 | 95%置信区间 |
| AM00 | 1.082 | 1.070 | 1.333 | 0.00562 | [1.071, 1.093] |
| AM10 | 0.732 | 0.724 | 0.705 | 0.00068 | [0.730, 0.732] |
| AM13 | 0.728 | 0.721 | 0.708 | 0.00057 | [0.727, 0.729] |
| SL00 | 1.481 | 1.484 | 1.492 | 0.00036 | [1.480, 1.481] |
| SL05 | 0.718 | 0.715 | 0.708 | 0.00026 | [0.717, 0.718] |
| FL | 1.880 | 1.885 | 1.792 | 0.00203 | [1.876, 1.884] |
| FO | 0.937 | 0.935 | 0.915 | 0.00046 | [0.936, 0.938] |
| FR | 0.532 | 0.527 | 0.502 | 0.00059 | [0.531, 0.533] |
| SP | 0.738 | 0.741 | 0.748 | 0.00030 | [0.738, 0.739] |
DownLoad: CSV
Table 9 The posteriori distribution of sensitive parameters for the whole Henan Province
| 参数 | 平均值 | 中值 | 最大似然值 | 均方根误差 | 95%置信区间 |
| AM00 | 0.758 | 0.747 | 0.756 | 0.00170 | [0.755, 0.761] |
| AM10 | 0.724 | 0.717 | 0.709 | 0.00072 | [0.722, 0.725] |
| AM13 | 0.714 | 0.711 | 0.702 | 0.00044 | [0.714, 0.715] |
| SL00 | 1.483 | 1.485 | 1.499 | 0.00048 | [1.482, 1.484] |
| SL05 | 0.712 | 0.709 | 0.701 | 0.00032 | [0.711, 0.712] |
| FL | 1.855 | 1.853 | 1.856 | 0.00178 | [1.851, 1.858] |
| FO | 0.901 | 0.899 | 0.892 | 0.00046 | [0.900, 0.902] |
| FR | 0.553 | 0.544 | 0.538 | 0.00149 | [0.550, 0.556] |
| SP | 0.896 | 0.896 | 0.906 | 0.00015 | [0.895, 0.896] |
DownLoad: CSV
| [1] |
Edwards D, Hamson M.Guide to Mathermatical Modeling.Boca Raton Florida, US:CRC Press, Inc., 1990.
|
| [2] |
谢云, James R K.国外作物生长模型发展综述.作物学报, 2002, 28(2): 190-195. DOI: 10.3321/j.issn:0496-3490.2002.02.009
Xie Y, James R K.A review on the development of crop modeling and its application.Acta Agronomica Sinica, 2002, 28(2): 190-195. DOI: 10.3321/j.issn:0496-3490.2002.02.009
|
| [3] |
Boote K J, Jones J W, Pickering N B.Potential uses and limitations of crop models.Agronomy Journal, 1996, 88: 704-716. DOI: 10.2134/agronj1996.00021962008800050005x
|
| [4] |
林忠辉, 莫兴国, 项月琴.作物生长模型研究综述.作物学报, 2003, 29(5): 750-758. DOI: 10.3321/j.issn:0496-3490.2003.05.021
Lin Z H, Mo X G, Xiang Y Q.Research advances on crop growth models.Acta Agronomica Sinica, 2003, 29(5): 750-758. DOI: 10.3321/j.issn:0496-3490.2003.05.021
|
| [5] |
高永刚, 顾红, 姬菊枝, 等.近43年来黑龙江气候变化对农作物产量影响的模拟研究.应用气象学报, 2007, 18(4): 532-538. DOI: 10.3969/j.issn.1001-7313.2007.04.014
Gao Y G, Gu H, Ji J Z, et al.Simulation study of climate change impact on crop yield in Heilongjiang Province from 1961 to 2003.J Appl Meteor Sci, 2007, 18(4): 532-538. DOI: 10.3969/j.issn.1001-7313.2007.04.014
|
| [6] |
张蕾, 侯英雨, 郑昌玲, 等.作物长势评估指数的设计与应用.应用气象学报, 2019, 30(5): 543-554. DOI: 10.11898/1001-7313.20190503
Zhang L, Hou Y Y, Zheng C L, et al.The construction and application of assessing index to crop growing condition.J Appl Meteor Sci, 2019, 30(5): 543-554. DOI: 10.11898/1001-7313.20190503
|
| [7] |
陈怀亮, 李颖, 田宏伟, 等.利用亚像元尺度信息改进区域冬小麦生长的模拟.生态学杂志, 2018, 37(7): 2221-2228.
Chen H L, Li Y, Tian H W, et al.Improvement of regional-scale winter wheat growth modeling with sub-pixel information.Chinese Journal of Ecology, 2018, 37(7): 2221-2228.
|
| [8] |
Curnel Y, de Wit A J W, Duveiller G, et al.Potential performances of remotely sensed LAI assimilation in WOFOST model based on an OSS Experiment.Agric For Meteorol, 2011, 151(12): 1843-1855. DOI: 10.1016/j.agrformet.2011.08.002
|
| [9] |
李颖, 陈怀亮, 田宏伟, 等.同化遥感信息与WheatSM模型的冬小麦估产.生态学杂志, 2019, 38(7): 2258-2264.
Li Y, Chen H L, Tian H W, et al.Estimation of winter wheat yield based on coupling remote sensing information and WheatSM model.Chinese Journal of Ecology, 2019, 38(7): 2258-2264.
|
| [10] |
孙琳丽, 马玉平, 景元书, 等.基于约束性分析的数据与作物模型同化方法.应用气象学报, 2013, 24(3): 287-296. DOI: 10.3969/j.issn.1001-7313.2013.03.004
Sun L L, Ma Y P, Jing Y S, et al.Assimilation of observations with crop growth model based on the constrained analysis of parameters.J Appl Meteor Sci, 2013, 24(3): 287-296. DOI: 10.3969/j.issn.1001-7313.2013.03.004
|
| [11] |
黄健熙, 黄海, 马鸿元, 等.基于MCMC方法的WOFOST模型参数标定与不确定性分析.农业工程学报, 2018, 34(16): 113-119. DOI: 10.11975/j.issn.1002-6819.2018.16.015
Huang J X, Huang H, Ma H Y, et al.Markov Chain Monte Carlo based WOFOST model parameters calibration and uncertainty analysis.Transactions of the Chinese Society of Agricultural Engineering, 2018, 34(16): 113-119. DOI: 10.11975/j.issn.1002-6819.2018.16.015
|
| [12] |
马玉平, 王石立, 王馥棠.作物模拟模型在农业气象业务应用中的研究初探.应用气象学报, 2005, 16(3): 293-303. DOI: 10.3969/j.issn.1001-7313.2005.03.003
Ma Y P, Wang S L, Wang F T.A preliminary study on the application of crop simulation models in agrometeorological services.J Appl Meteor Sci, 2005, 16(3): 293-303. DOI: 10.3969/j.issn.1001-7313.2005.03.003
|
| [13] |
刘布春, 王石立, 庄立伟, 等.基于东北玉米区域动力模型的低温冷害预报应用研究.应用气象学报, 2003, 14(5): 616-625. DOI: 10.3969/j.issn.1001-7313.2003.05.012
Liu B C, Wang S L, Zhuang L W, et al.Study of low temperature damage prediction applications in EN, China based on a scaling up maize dynamic model.J Appl Meteor Sci, 2003, 14(5): 616-625. DOI: 10.3969/j.issn.1001-7313.2003.05.012
|
| [14] |
秦鹏程, 刘敏, 万素琴, 等.不完整气象资料下基于作物模型的产量预报方法.应用气象学报, 2016, 27(4): 407-416. DOI: 10.11898/1001-7313.20160403
Qin P C, Liu M, Wan S Q, et al.Methods for yield forecast based on crop model with incomplete weather observations.J Appl Meteor Sci, 2016, 27(4): 407-416. DOI: 10.11898/1001-7313.20160403
|
| [15] |
许伟, 秦其明, 张添源, 等.SCE标定结合EnKF同化遥感和WOFOST模型模拟冬小麦时序LAI.农业工程学报, 2019, 35(14): 166-173.
Xu W, Qin Q M, Zhang T Y, et al.Time-series LAI simulation of winter wheat based on WOFOST model calibrated by SCE and assimilated by EnKF.Transactions of the Chinese Society of Agricultural Engineering, 2019, 35(14): 166-173.
|
| [16] |
张琨.遥感蒸散发模型参数敏感性分析与优化方法研究.兰州:兰州大学, 2018.
Zhang K.Parameter Sensitivity Analysis and Optimization for Remote Sensing Based Evapotranspiration Model.Lanzhou:Lanzhou University, 2018.
|
| [17] |
段国辉, 田文仲, 温红霞, 等.近13 a河南省高产冬小麦产量构成及亲本利用演变分析.山西农业科学, 2020, 48(2): 148-153.
Duan G H, Tian W Z, Wen H X, et al.Analysis on yield components and parent utilization evolution of high yield winter wheat in Henan province in the past 13 years.Journal of Shanxi Agricultural Sciences, 2020, 48(2): 148-153.
|
| [18] |
Hijmans R J, Guiking-Lens I M, Van Diepen C A.WOFOST 6.0:User's Guide for the WOFOST 6.0 Crop Growth Simulation Model.Wageningen:DLO Winand Staring Centre, 1994.
|
| [19] |
兴安, 卓志清, 赵云泽, 等.基于EFAST的不同生产水平下WOFOST模型参数敏感性分析.农业机械学报, 2020, 51(2): 161-171.
Xing A, Zhuo Z Q, Zhao Y Z, et al.Sensitivity analysis of WOFOST model crop parameters under different production levels based on EFAST method.Transactions of the Chinese Society for Agricultural Machinery, 2020, 51(2): 161-171.
|
| [20] |
张弘, 刘伟昌, 李树岩.WOFOST模型对河南省冬小麦模拟的适用性分析.气象与环境科学, 2019, 42(1): 34-40.
Zhang H, Liu W C, Li S Y.Applicability analysis of WOFOST model for winter wheat in Henan.Meteorological and Environmental Sciences, 2019, 42(1): 34-40.
|
| [21] |
邱美娟, 宋迎波, 王建林, 等.山东省冬小麦产量动态集成预报方法.应用气象学报, 2016, 27(2): 191-200. DOI: 10.11898/1001-7313.20160207
Qiu M J, Song Y B, Wang J L, et al.Integrated technology of yield dynamic prediction of winter wheat in Shandong province.J Appl Meteor Sci, 2016, 27(2): 191-200. DOI: 10.11898/1001-7313.20160207
|
| [22] |
Allen R G, Pereira L S, Raes D, et al.Crop Evapotranspiration:FAO Irrigation and Drainage Paper No.56.FAO, Rome, Italy, 1998.
|
| [23] |
张文君, 顾行发, 陈良富, 等.基于均值-标准差的K均值初始聚类中心选取算法.遥感学报, 2006, 10(5): 715-721.
Zhang W J, Gu X F, Chen L F, et al.An algorithm for initilizing of K-Means clustering based on Mean-standard deviation.Journal of Remote Sensing, 2006, 10(5): 715-721.
|
| [24] |
Sobol I M.Sensitivity estimates for nonlinear mathematical models.Math Model Comput Exp, 1993, 1(4): 407-414.
|
| [25] |
Sobol I M.Global sensitivity indices for nonlinear mathematical models and their Monte Carlo estimates.Mathematics and computers in simulation, 2001, 55(1-3): 271-280. DOI: 10.1016/S0378-4754(00)00270-6
|
| [26] |
Tang Y, Reed P, Wagener T, et al.Comparing sensitivity analysis methods to advance lumped watershed model identification and evaluation.Hydrology and Earth System Sciences, 2007, 3(6): 793-817.
|
| [27] |
Nossent J, Elsen P, Bauwens W.Sobol'sensitivity analysis of a complex environmental model.Environmental Modelling & Software, 2011, 26: 1515-1525.
|
| [28] |
符天凡.基于聚类的随机梯度马尔科夫链蒙特卡洛算法.上海:上海交通大学, 2018.
Fu T F.Clustering-based Stochastic Gradient Markov Chain Monte Carlo.Shanghai:Shanghai Jiao Tong University, 2018.
|
| [29] |
Hasting W.Monte Carlo sampling methods using Markov Chains and their applications.Biometrika, 1970, 57: 97-109. DOI: 10.1093/biomet/57.1.97
|
| [30] |
孙玫.MCMC算法及其应用.应用数学进展, 2018, 7(12): 1626-1637.
Sun M.MCMC algorithm and its application.Advances in Applied Mathematics, 2018, 7(12): 1626-1637.
|
| [31] |
Braak C J.A Markov Chain Monte Carlo version of the genetic algorithm differential evolution.Stats and Computing, 2006, 16: 239-249. DOI: 10.1007/s11222-006-8769-1
|
| [32] |
周广胜, 何奇瑾, 汲玉河.适应气候变化的国际行动和农业措施研究进展.应用气象学报, 2016, 27(5): 527-533. DOI: 10.11898/1001-7313.20160502
Zhou G S, He Q J, Ji Y H.Advances in the international action and agricultural measurements of adaptation to climate change.J Appl Meteor Sci, 2016, 27(5): 527-533. DOI: 10.11898/1001-7313.20160502
|
| [33] |
郭建平.气候变化对中国农业生产的影响研究进展.应用气象学报, 2015, 26(1): 1-11. DOI: 10.11898/1001-7313.20150101
Guo J P.Advances in impacts of climate change on agricultural production in China.J Appl Meteor Sci, 2015, 26(1): 1-11. DOI: 10.11898/1001-7313.20150101
|
| [1] | Sun Guanghui, Duan Juqi, Li Junru, Liao Yaoming. Agro-climatic Zoning of Oiltea Camellia in China Based on Climate-land Integrated Impacts[J]. Journal of Applied Meteorological Science, 2024, 35(4): 444-455. DOI: 10.11898/1001-7313.20240405 |
| [2] | Tian Fuyou, Zheng Yongguang, Zhang Tao, Mao Dongyan, Tang Wenyuan, Zhou Qingliang, Sun Jianhua, Zhao Sixiong. Sensitivity Analysis of Short-duration Heavy Rainfall Related Diagnostic Parameters with Point-area Verification[J]. Journal of Applied Meteorological Science, 2015, 26(4): 385-396. DOI: 10.11898/1001-7313.20150401 |
| [3] | Lu Xue, Gao Shanhong, Rao Lijuan, Wang Yongming. Sensitivity Study of WRF Parameterization Schemes for the Spring Sea Fog in the Yellow Sea[J]. Journal of Applied Meteorological Science, 2014, 25(3): 312-320. |
| [4] | Yang Zhifeng, Zhang Xiaoye, Che Huizheng, Zhang Xiaochun, Hu Xiuqing, Zhang Lijun. An Introductory Study on the Calibration of CE318 Sunphotometer[J]. Journal of Applied Meteorological Science, 2008, 19(3): 297-306. |
| [5] | Li Yachun, Wu Jingang, Xie Zhiqing, Jiao Shengming, Liu Cong. Turbulent Characteristic Parameter of Different Strong Wind Samples[J]. Journal of Applied Meteorological Science, 2008, 19(1): 28-34. |
| [6] | Zhu Lekun, Zheng Lichun. Uncertainty Analysis of Various Sensors Calibration Results for AWS[J]. Journal of Applied Meteorological Science, 2006, 17(5): 635-642. |
| [7] | Wang Guoqing, Wang Yunzhang, Kang Lingling. ANALYSIS ON THE SENSITIVITY OF RUNOFF IN YELLOW RIVER TO CLIMATE CHANGE[J]. Journal of Applied Meteorological Science, 2002, 13(1): 117-121. |
| [8] | Ma Gang, Fang Zongyi, Zhang Fengying. THE IMPACT OF CLOUD PARAMETERS ON THE SIMULATED ERRORS IN RTTOV5[J]. Journal of Applied Meteorological Science, 2001, 12(4): 385-392. |
| [9] | Bian Huisheng, Yan Pen, Zhu Cuijuan, Li Xingsheng. The Parameter Study of a High-order Turbulence Model[J]. Journal of Applied Meteorological Science, 1995, 6(2): 192-198. |
| [10] | Fang Zongyi, Liu Yujie, Zhu Xiaoxiang. A Cloud Parameters Retrieval Algorithm and Cloud Characteristic Analysis over East Asia in 1991[J]. Journal of Applied Meteorological Science, 1994, 5(2): 135-142. |
| 1. |
关皓月,李梦瑶,李国强,张建涛,高桐梅,陈先冠,张文宇,吴金芝. 芝麻发育期模拟模型参数敏感性分析与优化. 河南农业科学. 2024(09): 159-170 .

| |
| 2. |
杨景燕. 基于GIS的气候资源评价及区划研究——以新疆阿克苏苹果为例. 中南农业科技. 2024(10): 103-106 .
| |
| 3. |
吴清滢,谭忠昕,余强毅,汪彩华,宋茜,陆苗,吴文斌. 作物遥感估产方法对比及一致性评价. 中国农业信息. 2024(06): 27-40 .
| |
| 4. |
万青松,罗晓姣. 基于无监督过滤式指标选择的冬小麦种植区域尺度管理分区算法. 湖北农业科学. 2023(04): 185-189 .
| |
| 5. |
魏瑞江,郑昌玲,王鑫,申双和. WOFOST作物生长模型在国内应用研究进展. 气象科学. 2023(03): 402-411 .
| |
| 6. |
刘小飞,王景雷,刘祖贵,宋妮,方文松. 基于日天气预报数据估算小麦生长季参考作物蒸散量. 中国农业气象. 2022(03): 194-203 .
| |
| 7. |
高浚,周保平,王昱,王君,于晗. 基于EFAST的DSSAT模型对南疆地区棉花参数敏感性分析及适用性评价. 江苏农业科学. 2022(05): 185-191 .
| |
| 8. |
王君. Cotton2k模型在南疆地区棉花虚拟生长中的应用. 农业科技与信息. 2022(10): 126-128 .
| |
| 9. |
高浚,周保平,王昱,于晗,王君. 不同参数取值范围下CROPGRO-cotton模型全局敏感性和不确定性分析. 江苏农业科学. 2022(09): 195-202 .
| |
| 10. |
邓晓垒,董莉霞,李广,聂志刚,胥建杰,王钧,逯玉兰. 西北春麦区Apsim-Wheat模型参数全局敏感性分析. 麦类作物学报. 2022(06): 746-754 .
| |
| 11. |
郑昌玲,张蕾,侯英雨,宋迎波. 基于WOFOST模型的冬小麦产量动态预报方法. 干旱地区农业研究. 2022(06): 242-250+267 .
| |
| 12. |
孙爽,王春乙,宋艳玲,杨晓光. 我国北方一作区马铃薯高产稳产区分布特征. 应用气象学报. 2021(04): 385-396 .
本站查看
| |
| 13. |
柏秦凤,王景红,李化龙,张维敏,郭建平,张焘,贺晨昕. 美味系猕猴桃越冬冻害指标. 应用气象学报. 2021(04): 504-512 .
本站查看
| |
| 14. |
唐俊贤,王培娟,俄有浩,马玉平,邬定荣,霍治国. 中国大陆茶树种植气候适宜性区划. 应用气象学报. 2021(04): 397-407 .
本站查看
|
Figures(3) / Tables(9)
Table 1 Accumulated temperature parameters of winter wheat in different zones(unit:℃·d)
| 生育阶段 | Ⅰ区 | Ⅱ区 | Ⅲ区 | Ⅳ区 | Ⅴ区 |
| 播种至出苗 | 1170 | 1180 | 1100 | 1150 | 1250 |
| 出苗至开花 | 600 | 620 | 610 | 600 | 610 |
| 开花至成熟 | 110 | 120 | 120 | 130 | 120 |
DownLoad: CSV
Table 2 The proportion of changes of parameters to be analyzed around the default value
| 参数 | 定义 | 最小比例 | 最大比例 |
| AM00 | 发育期为0时CO2最大同化速率 | 0.7 | 1.5 |
| AM10 | 发育期为1时CO2最大同化速率 | 0.7 | 1.5 |
| AM13 | 发育期为1.3时CO2最大同化速率 | 0.7 | 1.5 |
| AM20 | 发育期为2时CO2最大同化速率 | 0.7 | 1.5 |
| SL00 | 发育期为0时比叶面积 | 0.7 | 1.5 |
| SL05 | 发育期为0.5时比叶面积 | 0.7 | 1.5 |
| SL20 | 发育期为2时比叶面积 | 0.7 | 1.5 |
| FL | 总物质分配到叶片的比例 | 0.5 | 2.0 |
| FO | 总物质分配到储存器官的比例 | 0.8 | 1.2 |
| FR | 总物质分配到根的比例 | 0.5 | 2.0 |
| SP | 35℃时叶片的生命周期 | 0.7 | 1.5 |
| TB | 出苗最低温度 | 0.5 | 1.5 |
| TD | 初始总干物质重量 | 0.9 | 1.3 |
| TE | 出苗最高有效温度 | 0.9 | 1.3 |
| TM00 | 日平均温度为0℃时CO2最大同化速率减小因子 | 0.7 | 1.5 |
| TM10 | 日平均温度为10℃时CO2最大同化速率减小因子 | 0.7 | 1.3 |
| TM15 | 日平均温度为15℃时CO2最大同化速率减小因子 | 0.7 | 1.5 |
| TM25 | 日平均温度为25℃时CO2最大同化速率减小因子 | 0.7 | 1.5 |
| TM35 | 日平均温度为35℃时CO2最大同化速率减小因子 | 0.7 | 1.5 |
| RD | 根的相对死亡速率 | 0.9 | 1.0 |
| RG | 叶面积指数最大日增量 | 0.9 | 1.3 |
DownLoad: CSV
Table 3 Modeling data and verification data used for parameter calibration
| 研究区 | 优化数据 | 验证数据 | |||
| 年份 | 站点 | 年份 | 站点 | ||
| Ⅰ区 | 2013 | 林州 | |||
| 2014 | 汤阴 | ||||
| 2015 | 安阳 | 2018—2019 | 汤阴 | ||
| 2016 | 濮阳 | ||||
| 2017 | 范县 | ||||
| Ⅱ区 | 2013 | 郑州 | |||
| 2014 | 商丘 | ||||
| 2015 | 伊川 | 2018—2019 | 郑州 | ||
| 2016 | 济源 | ||||
| 2017 | 郑州 | ||||
| Ⅲ区 | 2013 | 许昌 | |||
| 2014 | 许昌 | ||||
| 2015 | 黄泛区 | 2018—2019 | 黄泛区 | ||
| 2016 | 驻马店 | ||||
| 2017 | 南阳 | ||||
| Ⅳ区 | 2013 | 信阳 | |||
| 2014 | 正阳 | ||||
| 2015 | 新野 | 2018—2019 | 潢川 | ||
| 2016 | 潢川 | ||||
| 2017 | 固始 | ||||
| Ⅴ区 | 2013 | 卢氏 | |||
| 2014 | 三门峡 | ||||
| 2015 | 三门峡 | 2018—2019 | 卢氏 | ||
| 2016 | 卢氏 | ||||
| 2017 | 卢氏 | ||||
DownLoad: CSV
Table 4 The posteriori distribution of sensitive parameters in Zone Ⅰ of Henan Province
| 参数 | 平均值 | 中值 | 最大似然值 | 均方根误差 | 95%置信区间 |
| AM00 | 1.369 | 1.414 | 1.470 | 0.00396 | [1.361, 1.377] |
| AM10 | 1.351 | 1.374 | 1.426 | 0.00301 | [1.345, 1.357] |
| AM13 | 0.729 | 0.722 | 0.704 | 0.00070 | [0.728, 0.731] |
| SL00 | 1.443 | 1.455 | 1.500 | 0.00130 | [1.440, 1.445] |
| SL05 | 0.774 | 0.770 | 0.707 | 0.00127 | [0.771, 0.776] |
| FL | 1.904 | 1.932 | 1.994 | 0.00220 | [1.900, 1.909] |
| FO | 0.857 | 0.856 | 0.860 | 0.00023 | [0.856, 0.857] |
| FR | 1.423 | 1.429 | 1.487 | 0.00131 | [1.421, 1.426] |
| SP | 0.831 | 0.829 | 0.826 | 0.00026 | [0.831, 0.832] |
DownLoad: CSV
Table 5 The posteriori distribution of sensitive parameters in Zone Ⅱ of Henan Province
| 参数 | 平均值 | 中值 | 最大似然值 | 均方根误差 | 95%置信区间 |
| AM00 | 0.761 | 0.750 | 0.704 | 0.00176 | [0.757, 0.764] |
| AM10 | 1.397 | 1.410 | 1.412 | 0.00274 | [1.392, 1.403] |
| AM13 | 0.793 | 0.785 | 0.760 | 0.00235 | [0.788, 0.798] |
| SL00 | 1.350 | 1.361 | 1.458 | 0.00385 | [1.342, 1.357] |
| SL05 | 0.772 | 0.759 | 0.737 | 0.00195 | [0.768, 0.775] |
| FL | 1.823 | 1.848 | 1.973 | 0.00496 | [1.813, 1.833] |
| FO | 0.921 | 0.920 | 0.901 | 0.00055 | [0.919, 0.922] |
| FR | 0.946 | 0.964 | 1.112 | 0.00573 | [0.934, 0.957] |
| SP | 0.822 | 0.824 | 0.824 | 0.00034 | [0.822, 0.823] |
DownLoad: CSV
Table 6 The posteriori distribution of sensitive parameters in Zone Ⅲ of Henan Province
| 参数 | 平均值 | 中值 | 最大似然值 | 均方根误差 | 95%置信区间 |
| AM00 | 0.715 | 0.711 | 0.702 | 0.00040 | [0.714, 0.716] |
| AM10 | 0.891 | 0.872 | 0.869 | 0.00319 | [0.885, 0.897] |
| AM13 | 0.738 | 0.730 | 0.700 | 0.00089 | [0.737, 0.740] |
| SL00 | 1.352 | 1.376 | 1.498 | 0.00296 | [1.346, 1.358] |
| SL05 | 1.082 | 1.067 | 1.144 | 0.00383 | [1.075, 1.090] |
| FL | 1.326 | 1.334 | 1.215 | 0.00426 | [1.317, 1.334] |
| FO | 0.809 | 0.807 | 0.802 | 0.00023 | [0.809, 0.810] |
| FR | 0.790 | 0.787 | 0.794 | 0.00397 | [0.782, 0.798] |
| SP | 0.932 | 0.938 | 0.940 | 0.00042 | [0.932, 0.933] |
DownLoad: CSV
Table 7 The posteriori distribution of sensitive parameters in Zone Ⅳ of Henan Province
| 参数 | 平均值 | 中值 | 最大似然值 | 均方根误差 | 95%置信区间 |
| AM00 | 1.446 | 1.460 | 1.496 | 0.00094 | [1.444, 1.447] |
| AM10 | 1.118 | 1.127 | 0.744 | 0.00472 | [1.109, 1.128] |
| AM13 | 1.418 | 1.441 | 1.497 | 0.00151 | [1.415, 1.421] |
| SL00 | 1.174 | 1.188 | 0.918 | 0.00304 | [1.168, 1.180] |
| SL05 | 0.799 | 0.777 | 0.711 | 0.00164 | [0.796, 0.802] |
| FL | 1.090 | 1.076 | 1.297 | 0.00250 | [1.085, 1.095] |
| FO | 1.033 | 1.021 | 1.124 | 0.00076 | [1.031, 1.034] |
| FR | 0.625 | 0.595 | 0.602 | 0.00198 | [0.621, 0.629] |
| SP | 0.834 | 0.829 | 0.828 | 0.00027 | [0.833, 0.834] |
DownLoad: CSV
Table 8 The posteriori distribution of sensitive parameters in Zone Ⅴ of Henan Province
| 参数 | 平均值 | 中值 | 最大似然值 | 均方根误差 | 95%置信区间 |
| AM00 | 1.082 | 1.070 | 1.333 | 0.00562 | [1.071, 1.093] |
| AM10 | 0.732 | 0.724 | 0.705 | 0.00068 | [0.730, 0.732] |
| AM13 | 0.728 | 0.721 | 0.708 | 0.00057 | [0.727, 0.729] |
| SL00 | 1.481 | 1.484 | 1.492 | 0.00036 | [1.480, 1.481] |
| SL05 | 0.718 | 0.715 | 0.708 | 0.00026 | [0.717, 0.718] |
| FL | 1.880 | 1.885 | 1.792 | 0.00203 | [1.876, 1.884] |
| FO | 0.937 | 0.935 | 0.915 | 0.00046 | [0.936, 0.938] |
| FR | 0.532 | 0.527 | 0.502 | 0.00059 | [0.531, 0.533] |
| SP | 0.738 | 0.741 | 0.748 | 0.00030 | [0.738, 0.739] |
DownLoad: CSV
Table 9 The posteriori distribution of sensitive parameters for the whole Henan Province
| 参数 | 平均值 | 中值 | 最大似然值 | 均方根误差 | 95%置信区间 |
| AM00 | 0.758 | 0.747 | 0.756 | 0.00170 | [0.755, 0.761] |
| AM10 | 0.724 | 0.717 | 0.709 | 0.00072 | [0.722, 0.725] |
| AM13 | 0.714 | 0.711 | 0.702 | 0.00044 | [0.714, 0.715] |
| SL00 | 1.483 | 1.485 | 1.499 | 0.00048 | [1.482, 1.484] |
| SL05 | 0.712 | 0.709 | 0.701 | 0.00032 | [0.711, 0.712] |
| FL | 1.855 | 1.853 | 1.856 | 0.00178 | [1.851, 1.858] |
| FO | 0.901 | 0.899 | 0.892 | 0.00046 | [0.900, 0.902] |
| FR | 0.553 | 0.544 | 0.538 | 0.00149 | [0.550, 0.556] |
| SP | 0.896 | 0.896 | 0.906 | 0.00015 | [0.895, 0.896] |
DownLoad: CSV