| Citation: |
Wang Hong, Li Ying, Wen Yongren. Observational characteristics of a hybrid severe convective event in the Sichuan-Tibet Region. J Appl Meteor Sci, 2021, 32(5): 567-579. DOI: 10.11898/1001-7313.20210505.

|
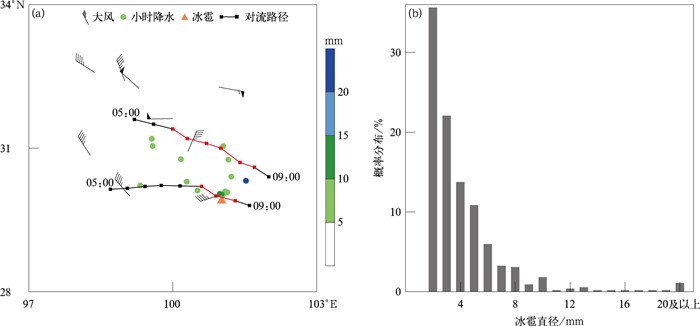
Fig 1. Moving paths of strong convection centers(the time interval is 30 min, the black and red lines denote the reflectivity factor ranging from 35-60 dBZ and more than 60 dBZ) from 0500 UTC to 0900 UTC on 8 Sep 2016(a) and probability distribution of hail diameter in the Qinghai-Tibet Region during 2010-2017(b)
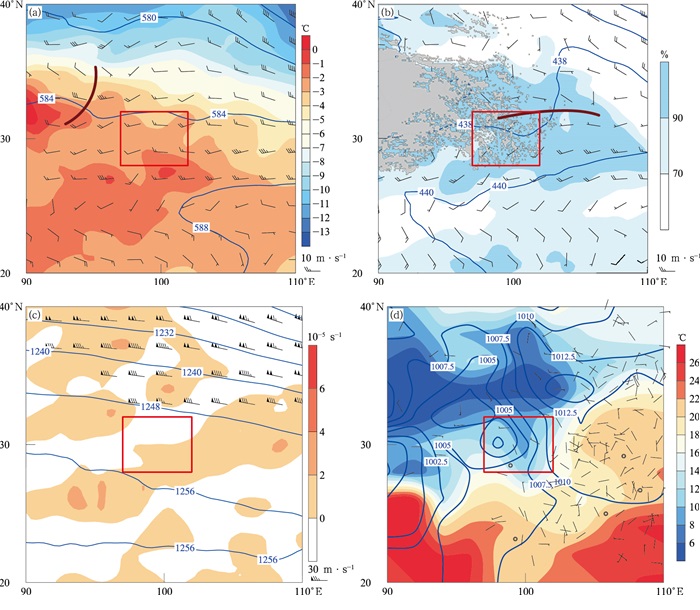
Fig 2. Geopotential height(the contour, unit:dagpm) and wind at 0000 UTC on 8 Sep 2016
(the red rectangle denotes convection area)
(a)500 hPa(the shaded denotes temperature, the brown curve denotes trough), (b)600 hPa(the shaded denotes relative humidity, the brown curve denotes shear line, the grey denotes terrain), (c)200 hPa(the barb denotes upper level jet stream with wind velocity no less than 30 m·s-1, the shaded denotes divergence), (d)surface(the contour denotes sea-level pressure, unit:hPa;the shaded denotes temperature)
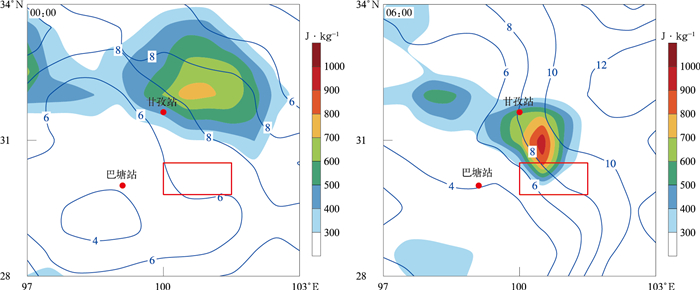
Fig 3. Environmental convective available potential energy(the shaded) and 500-700 hPa vertical wind shear(the blue contour, unit:m·s-1) on 8 Sep 2016
(the red rectangle indicates mature supercell area)
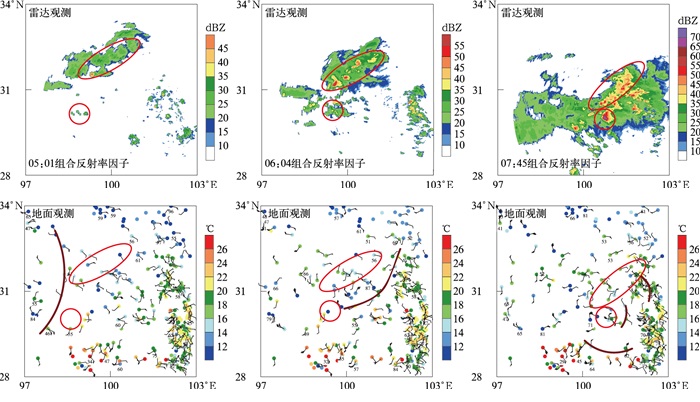
Fig 4. Radar and surface observations at Ganzi on 8 Sep 2016
(the dot denotes surface temperature, the number denotes relative humidity(unit:%), the brown curve denotes surface convergence lines, the red ellipse denotes convection positions)
Fig 5. Observation at 0.5°elevation angle by Ganzi radar on 8 Sep 2016
(a)reflectivity factors(the white ellipse denotes hook echo, the white arrow indicates inflow gap), (b)vertical cross-section along line AB in Fig. 5a(the white ellipse denotes echo overhang), (c)reflectivity factors(the white ellipse denotes mesocyclone), (d)vertical cross-section along line AB in Fig. 5c(the white arrow denotes storm inflow direction)
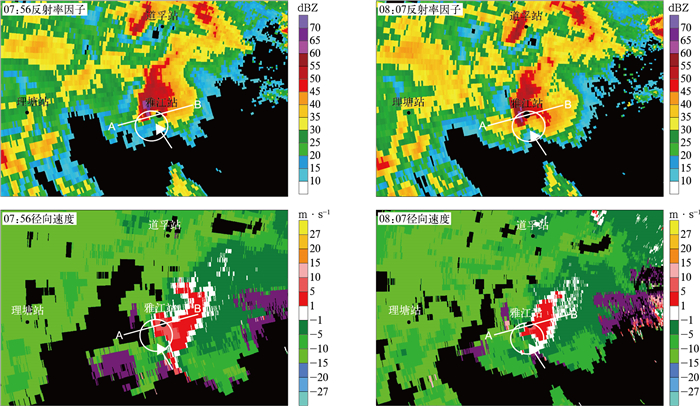
Fig 6. Observation at 0.5°elevation angle by Ganzi radar on 8 Sep 2016
(the white circle denotes mesocyclone, the white arrow denotes supercell inflow direction)
Fig 7. Vertical cross-section along line AB in Fig. 6 by Ganzi radar on 8 Sep 2016
(the red dot denotes Yajiang Station, the white arrow denotes low-level air flow direction)
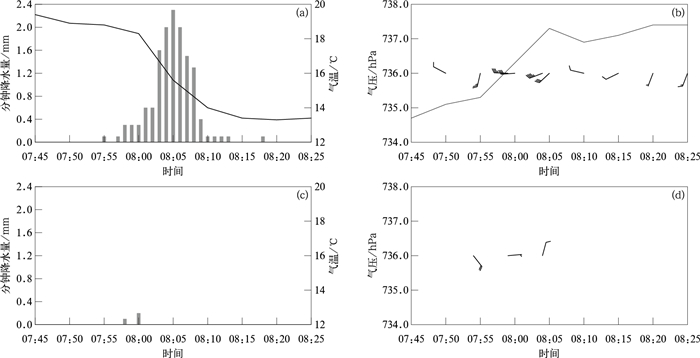
Fig 8. Surface meteorological elements evolution from 0745 UTC to 0825 UTC on 8 Sep 2016
(a)precipitation(the column) and temperature(the curve) at Yajiang station, (b)pressure(the curve) and wind(the barb)at Yajiang Station, (c)precipitation(the column) at auto weather station 838181, (d)hourly extreme wind(the barb) at auto weather station 838181
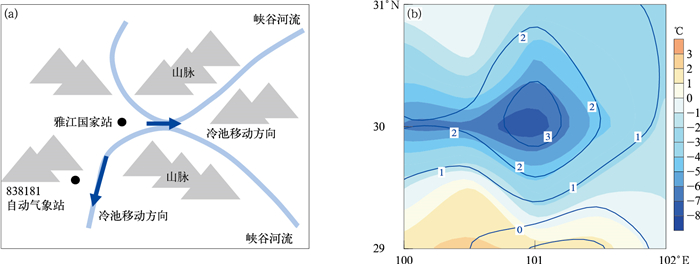
Fig 9. Topographical sketch map around the stations(a) and 3 h pressure change(the blue contour, unit:hPa) and 24 h temperature change(the shaded) on surface at 0900 UTC 8 Sep 2016(b)
| [1] |
段亚鹏, 王东海, 刘英."东方之星"翻沉事件强对流天气分析及数值模拟.应用气象学报, 2017, 28(6):666-677. DOI: 10.11898/1001-7313.20170603
Duan Y P, Wang D H, Liu Y. Radar analysis and numerical simulation of strong convective weather for "Oriental Star" depression. Journal of Applied Meteorological Science, 2017, 28(6): 666-677. DOI: 10.11898/1001-7313.20170603
|
| [2] |
宋连春. 中国气象灾害年鉴. 北京: 气象出版社, 2017.
Song L C. China Meteorological Disaster Yearbook. Beijing: China Meteorological Press, 2017.
|
| [3] |
俞小鼎, 张爱民, 郑媛媛, 等. 一次系列下击暴流事件的多普勒天气雷达分析. 应用气象学报, 2006, 17(4): 385-393. DOI: 10.3969/j.issn.1001-7313.2006.04.001
Yu X D, Zhang A M, Zheng Y Y, et al. Doppler radar analysis on a series of downburst events. Journal of Applied Meteorological Science, 2006, 17(4): 385-393. DOI: 10.3969/j.issn.1001-7313.2006.04.001
|
| [4] |
Wakimoto R M. The life cycle of thunderstorm gust fronts as viewed with Doppler radar and rawinsonde data. Monthly Weather Review, 1982, 110(8): 1060-1082. DOI: 10.1175/1520-0493(1982)110<1060:TLCOTG>2.0.CO;2
|
| [5] |
张琳娜, 冉令坤, 李娜, 等. 雷暴大风过程中对流层中低层动量通量和动能通量输送特征研究. 大气科学, 2018, 42(1): 178-191. https://www.cnki.com.cn/Article/CJFDTOTAL-DQXK201801013.htm
Zhang L N, Ran L K, Li N, et al. Analysis of momentum flux and kinetic energy flux transport in the middle and lower troposphere during a thunderstorm event. Chinese Journal of Atmospheric Sciences, 2018, 42(1): 178-191. https://www.cnki.com.cn/Article/CJFDTOTAL-DQXK201801013.htm
|
| [6] |
李国翠, 郭卫红, 王丽荣, 等. 阵风锋在短时大风预报中的应用. 气象, 2006, 32(8): 36-41. DOI: 10.3969/j.issn.1000-0526.2006.08.006
Li G C, Guo W H, Wang L R, et al. Application of gust front to damage wind forecasting. Meteorological Monthly, 2006, 32(8): 36-41. DOI: 10.3969/j.issn.1000-0526.2006.08.006
|
| [7] |
吴芳芳, 王慧, 韦莹莹, 等. 一次强雷暴阵风锋和下击暴流的多普勒雷达特征. 气象, 2009, 35(1): 55-64. https://www.cnki.com.cn/Article/CJFDTOTAL-QXXX200901010.htm
Wu F F, Wang H, Wei Y Y, et al. Analysis of a strong gust front and downburst with Doppler weather radar data. Meteorological Monthly, 2009, 35(1): 55-64. https://www.cnki.com.cn/Article/CJFDTOTAL-QXXX200901010.htm
|
| [8] |
Bluestein H B. Severe Convective Storms and Tornadoes: Observations and Dynamics. Praxis/Springer, 2013: 120-153. http://link.springer.com/978-3-642-05381-8
|
| [9] |
郑永光, 周康辉, 盛杰, 等. 强对流天气监测预报预警技术进展. 应用气象学报, 2015, 26(6): 641-657. DOI: 10.11898/1001-7313.20150601
Zheng Y G, Zhou K H, Sheng J, et al. Advances in techniques of monitoring, forecasting and warning of severe convective weather. Journal of Applied Meteorological Science, 2015, 26(6): 641-657. DOI: 10.11898/1001-7313.20150601
|
| [10] |
Meng Z Y, Yan D C, Zhang Y J. General features of squall lines in East China. Monthly Weather Review, 2013, 141(5): 1629-1647. DOI: 10.1175/MWR-D-12-00208.1
|
| [11] |
Fujita T T. Tornadoes and downbursts in the context of generalized planetary scales. Journal of Atmospheric Sciences, 1981, 38(8): 1511-1534. DOI: 10.1175/1520-0469(1981)038<1511:TADITC>2.0.CO;2
|
| [12] |
王福侠, 俞小鼎, 裴宇杰, 等. 河北省雷暴大风的雷达回波特征及预报关键点. 应用气象学报, 2016, 27(3): 342-351. DOI: 10.11898/1001-7313.20160309
Wang F X, Yu X D, Pei Y J, et al. Radar echo characteristics of thunderstorm gales and forecast key points in Hebei Province. Journal of Applied Meteorological Science, 2016, 27(3): 342-351. DOI: 10.11898/1001-7313.20160309
|
| [13] |
Schoen J M, Ashley W S. A climatology of fatal convective wind events by storm type. Weather and Forecasting, 2011, 26(1): 109-121. DOI: 10.1175/2010WAF2222428.1
|
| [14] |
Klimowski B A, Hjelmfelt M R, Bunkers M J. Radar observations of the early evolution of bow echoes. Weather and Forecasting, 2004, 19(4): 727-734. DOI: 10.1175/1520-0434(2004)019<0727:ROOTEE>2.0.CO;2
|
| [15] |
French A J, Parker M D. Numerical simulations of bow echo formation following a squall line-supercell merger. Monthly Weather Review, 2014, 142(12): 4791-4822. DOI: 10.1175/MWR-D-13-00356.1
|
| [16] |
French A J, Parker M D. Observations of mergers between squall lines and isolated supercell thunderstorms. Weather and Forecasting, 2012, 27(2): 255-278. DOI: 10.1175/WAF-D-11-00058.1
|
| [17] |
Schmidt J M, Cotton W R. A high plains squall line associated with severe surface winds. Journal of Atmospheric Sciences, 1989, 46(3): 281-302. DOI: 10.1175/1520-0469(1989)046<0281:AHPSLA>2.0.CO;2
|
| [18] |
王秀明, 俞小鼎, 朱禾. NCEP再分析资料在强对流环境分析中的应用. 应用气象学报, 2012, 23(2): 139-146. DOI: 10.3969/j.issn.1001-7313.2012.02.002
Wang X M, Yu X D, Zhu H. The applicability of NCEP reanalysis data to severe convection environment analysis. Journal of Applied Meteorological Science, 2012, 23(2): 139-146. DOI: 10.3969/j.issn.1001-7313.2012.02.002
|
| [19] |
马淑萍, 王秀明, 俞小鼎. 极端雷暴大风的环境参量特征. 应用气象学报, 2019, 30(3): 292-301. DOI: 10.11898/1001-7313.20190304
Ma S P, Wang X M, Yu X D. Environmental parameter characteristics of severe wind with extreme thunderstorm. Journal of Applied Meteorological Science, 2019, 30(3): 292-301. DOI: 10.11898/1001-7313.20190304
|
| [20] |
王秀明, 周小刚, 俞小鼎. 雷暴大风环境特征及其对风暴结构影响的对比研究. 气象学报, 2013, 71(5): 839-852. https://www.cnki.com.cn/Article/CJFDTOTAL-QXXB201305004.htm
Wang X M, Zhou X G, Yu X D. Comparative study of environmental characteristics of a windstorm and their impacts on storm structures. Acta Meteorologica Sinica, 2013, 71(5): 839-852. https://www.cnki.com.cn/Article/CJFDTOTAL-QXXB201305004.htm
|
| [21] |
陈淑琴, 章丽娜, 俞小鼎, 等. 浙北沿海连续3次飑线演变过程的环境条件. 应用气象学报, 2017, 28(3): 357-368. DOI: 10.11898/1001-7313.20170309
Chen S Q, Zhang L N, Yu X D, et al. Environmental conditions of three squall lines in the north part of Zhejiang Province. Journal of Applied Meteorological Science, 2017, 28(3): 357-368. DOI: 10.11898/1001-7313.20170309
|
| [22] |
高晓梅, 俞小鼎, 王令军, 等. 山东半岛两次海风锋引起的强对流天气对比. 应用气象学报, 2018, 29(2): 245-256. DOI: 10.11898/1001-7313.20180210
Gao X M, Yu X D, Wang L J, et al. Comparative analysis of two strong convections triggered by sea-breeze front in Shandong Peninsula. Journal of Applied Meteorological Science, 2018, 29(2): 245-256. DOI: 10.11898/1001-7313.20180210
|
| [23] |
孙继松, 戴建华, 何立富, 等. 强对流天气预报的基本原理与技术方法. 北京: 气象出版社, 2014.
Sun J S, Dai J H, He L F, et al. The Principles and Techniques of Severe Convective Weather Forecasting. Beijing: China Meteorological Press, 2014.
|
| [24] |
张鸿发, 郭三刚, 张义军, 等. 青藏高原强对流雷暴云分布特征. 高原气象, 2003, 22(6): 558-564. DOI: 10.3321/j.issn:1000-0534.2003.06.005
Zhang H F, Guo S G, Zhang Y J. Distribution characteristic of severe convective thunderstorm cloud over Qinghai-Xizang Plateau. Plateau Meteorology, 2003, 22(6): 558-564. DOI: 10.3321/j.issn:1000-0534.2003.06.005
|
| [25] |
朱平, 俞小鼎. 青藏高原东北部一次罕见强对流天气的中小尺度系统特征分析. 高原气象, 2019, 38(1): 1-13. https://www.cnki.com.cn/Article/CJFDTOTAL-GYQX201901001.htm
Zhu P, Yu X D. Analysis of meso-small scale system characteristics of a rare severe convective weather in the northeast part of Qinghai-Tibetan Plateau. Plateau Meteorology, 2019, 38(1): 1-13. https://www.cnki.com.cn/Article/CJFDTOTAL-GYQX201901001.htm
|
| [26] |
Li J. Hourly station-based precipitation characteristics over the Tibetan Plateau. International Journal of Climatology, 2017, 38(1): 1560-1570. http://smartsearch.nstl.gov.cn/paper_detail.html?id=05dc5bcf4691c9ac999865bbe0a71ac7
|
| [27] |
王彬雁, 赵琳娜, 许晖, 等. 四川雨季小时降水的概率分布特征及其降水分区. 暴雨灾害, 2018, 37(2): 115-123. DOI: 10.3969/j.issn.1004-9045.2018.02.003
Wang B Y, Zhao L N, Xu H, et al. Probability distribution and partition of hourly rainfall during the rainy season over Sichuan Province. Torrential Rain and Disasters, 2018, 37(2): 115-123. DOI: 10.3969/j.issn.1004-9045.2018.02.003
|
| [28] |
Li X F, Zhang Q H, Zou T J, et al. Climatology of hail frequency and size in China, 1980-2015. Journal of Applied Meteorology and Climatology, 2018, 57(4): 875-887. DOI: 10.1175/JAMC-D-17-0208.1
|
| [29] |
王黉, 李英, 宋丽莉, 等. 川藏地区雷暴大风活动特征和环境因子对比. 应用气象学报, 2020, 31(4): 435-446. DOI: 10.11898/1001-7313.20200406
Wang H, Li Y, Song L L, et al. Comparison of characteristics and environmental factors of thunderstorm gales over the Sichuan-Tibet Region. Journal of Applied Meteorological Science, 2020, 31(4): 435-446. DOI: 10.11898/1001-7313.20200406
|
| [30] |
Atkins N T, Wakimoto R M. Wet microburst activity over the southeastern United States: Implications for forecasting. Weather and Forecasting, 1991, 6(4): 470-482. DOI: 10.1175/1520-0434(1991)006<0470:WMAOTS>2.0.CO;2
|
| [31] |
Rickenbach T M, Rutledge S A. Convection in TOGA COARE: Horizontal scale, morphology, and rainfall production. Journal of Atmospheric Sciences, 1998, 55(17): 2715-2729. DOI: 10.1175/1520-0469(1998)055<2715:CITCHS>2.0.CO;2
|
| [32] |
Moller A R, Doswell Ⅲ C A, Foster M P, et al. The operational recognition of supercell thunderstorm environments and storm structures. Weather and Forecasting, 1994, 9(3): 327-347. DOI: 10.1175/1520-0434(1994)009<0327:TOROST>2.0.CO;2
|
| [33] |
Bluestein H B, Parks C R. A synoptic and photographic climatology of low-precipitation severe thunderstorms in the southern plains. Monthly Weather Review, 1983, 111(10): 2034-2046. DOI: 10.1175/1520-0493(1983)111<2034:ASAPCO>2.0.CO;2
|
| [34] |
Rasmussen E N, Straka J M. Variations in supercell morphology. Part Ⅰ: Observations of the role of upper-level storm-relative flow. Monthly Weather Review, 1998, 126(9): 2406-2421. DOI: 10.1175/1520-0493(1998)126<2406:VISMPI>2.0.CO;2
|
| [35] |
Roberts R D, Wilson J W. A proposed microburst nowcasting procedure using single-Doppler radar. Journal of Applied Meteorology and Climatology, 1989, 28(4): 285-303. DOI: 10.1175/1520-0450(1989)028<0285:APMNPU>2.0.CO;2
|
| [36] |
Doswell C A, Burgess D W. Tornadoes and Tornadic Storms: A Review of Conceptual Models. The Tornado: Its Structure, Dynamics, Prediction, and Hazards. Geophysical Monograph, American Geophysical Union, 1993: 161-172. DOI: 10.1029/GM079
|
| [37] |
Funk T W, Darmofal K E, Kirkpatrick J D, et al. Storm reflectivity and mesocyclone evolution associated with the 15 April 1994 squall line over Kentucky and Southern Indiana. Weather and Forecasting, 1999, 14(6): 976-993. DOI: 10.1175/1520-0434(1999)014<0976:SRAMEA>2.0.CO;2
|
| [38] |
Markowski P M, Richardson Y P. Mesoscale Meteorology in Midlatitudes. Chichester: Wiley-Blackwell, 2010: 245-260.
|
 DownLoad: