| 观测区 | 地形平均高度/km | 飞行观测垂直范围/km | 人类活动特征 | 地表特征 | 夏秋季气流特征 |
| 格尔木地区(A区) | 2.9 | 2.8~8.5 | 盐湖、城镇、交通 | 盐碱、沙漠等 | 西或西北干冷空气 |
| 长江源区(B区) | 5.0 | 7.0~9.0 | 无人区、交通 | 草场、覆雪或岩石 | 西南或西风气流 |
| 三江共源区(C区) | 4.7 | 7.0~9.0 | 城镇、放牧、交通 | 草场、湿地、湖泊 | 西南暖湿气流 |
| 黄河上游河曲地区(D区) | 3.7 | 7.0~9.0 | 城镇、放牧、交通 | 草场、山脉、湿地 | 西南或偏南暖湿气流 |
| Citation: | Ma Xueqian, Guo Xueliang, Liu Na, et al. Aircraft measurements on properties of aerosols over the central and eastern Qinghai-Tibet Plateau. J Appl Meteor Sci, 2021, 32(6): 706-719. DOI: 10.11898/1001-7313.20210606.

|
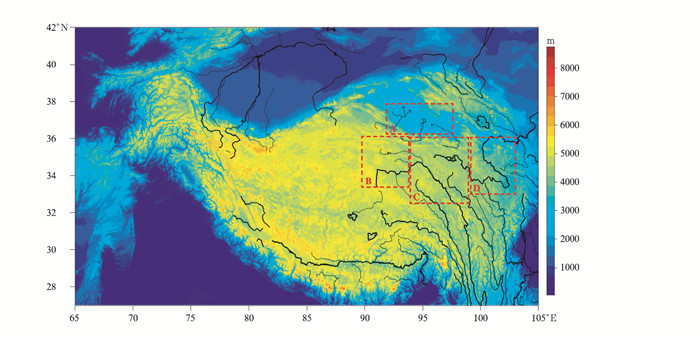
Fig. 1 Test field and its flight measurement area in the central and eastern of Qinghai-Tibet Plateau
(black solid lines denote rivers or lakes, virtual boxs denote test fields or flight measurement areas, the shaded denotes the terrain elevation)
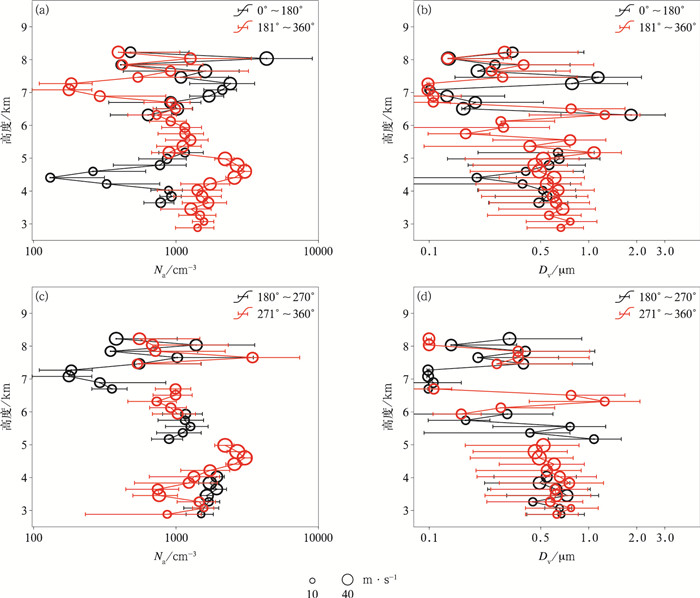
Fig. 2 Vertical distribution and deviation of aerosol mean concentration and volume diameter with height under different wind directions and speeds at Golmud(the circle size represents the wind speed, the longitudinal line segment with different colors represents the variation of average number concentration or volume diameter within the wind direction with height, the transverse line segment represents the deviation of number concentration or volume diameter)(a)vertical distribution and deviation of aerosol mean concentration in prevailing east wind (0°~180°) or west wind (181°~360°), (b)vertical distribution and deviation of aerosol mean volume diameter in prevailing east wind (0°~180°) or west wind (181°~360°), (c)vertical distribution and deviation of aerosol mean concentration in southwest wind (181°~270°) or northwest wind (271°~360°), (d)vertical distribution and deviation of aerosol mean volume diameter in southwest wind (181°~270°) or northwest wind (271°~360°)
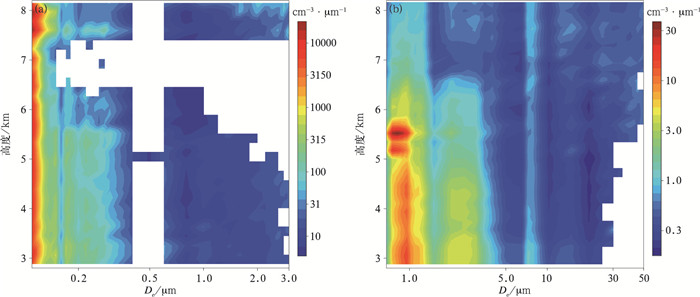
Fig. 3 Vertical distribution characteristics of aerosol mean spectrum at Golmud (a)0.1-3.0 μm measured by PCASP-100X, (b)0.6-50 μm measured by CAS forward scattering
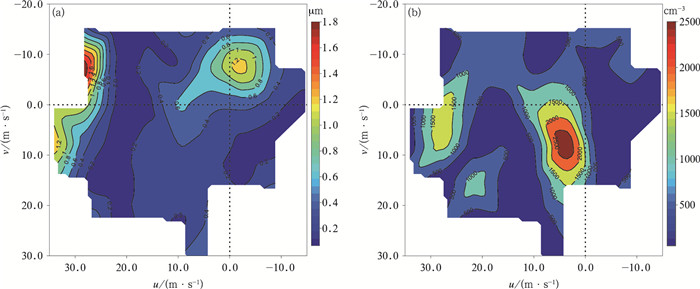
Fig. 4 Distribution of aerosol mean effective diameter(De)(a) and mean number concentration(Na)(b) under different wind directions and speeds at Golmud
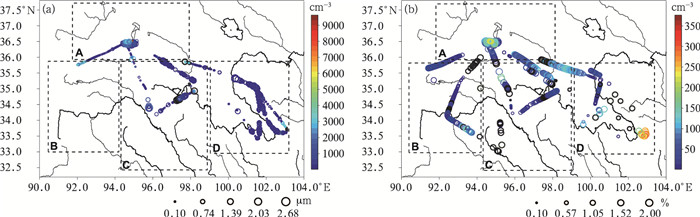
Fig. 5 Aerosol number concentration distribution with different effective diameter(a) and CCN number concentration distribution measured under different supersaturation conditions(b) on the flight lines of the test field
(the circle size in Fig. 5a is the effective diameter of aerosol, the color code denotes aerosol number concentration;the circle size in Fig. 5b denotes supersaturation, the color code denotes CCN number concentration)
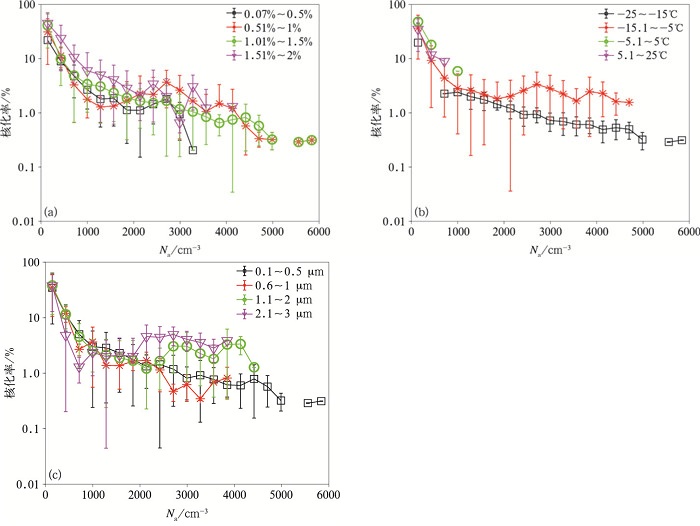
Fig. 6 Relationship between aerosol number concentration and nucleation rate under different supersaturation states(a), different temperature layer(b) and different effective diameter(c)
Table 1 Characteristics of four measurement areas in the central and eastern Qinghai-Tibet Plateau
| 观测区 | 地形平均高度/km | 飞行观测垂直范围/km | 人类活动特征 | 地表特征 | 夏秋季气流特征 |
| 格尔木地区(A区) | 2.9 | 2.8~8.5 | 盐湖、城镇、交通 | 盐碱、沙漠等 | 西或西北干冷空气 |
| 长江源区(B区) | 5.0 | 7.0~9.0 | 无人区、交通 | 草场、覆雪或岩石 | 西南或西风气流 |
| 三江共源区(C区) | 4.7 | 7.0~9.0 | 城镇、放牧、交通 | 草场、湿地、湖泊 | 西南暖湿气流 |
| 黄河上游河曲地区(D区) | 3.7 | 7.0~9.0 | 城镇、放牧、交通 | 草场、山脉、湿地 | 西南或偏南暖湿气流 |
 DownLoad: Download CSV
Table 2 Overview of aircraft measurement experiments and weather conditions
| 观测日期 | 观测时段 | 观测区 | 天气系统 | Renold数 | 垂直观测范围/km | 垂直观测温度范围/℃ | 零度层位置/km |
| 2011-07-27 | 11:50—16:52 | A, C | 高压 | 5180~7781 | 4.4~8.4 | -16~2 | 4.8 |
| 2011-08-02 | 10:33—13:54 | A, D | 低涡 | 5179~5814 | 7.5~8.0 | -18~-12 | |
| 2011-08-15 | 11:34—17:17 | A, B, C | 槽底 | 5357~5940 | 2.8~8.5 | -13~18 | 4.9 |
| 2011-08-20 | 12:29—19:22 | A, B, C | 西风 | 5097~5874 | 2.8~8.3 | -16~23 | 5.1 |
| 2011-09-16 | 09:33—16:55 | A, D | 槽后 | 5180~7174 | 3.4~7.9 | -20~9 | 4.7 |
| 2011-09-19 | 10:47—13:25 | A, B | 槽底 | 4707~8201 | 4.7~8.2 | -18~1 | 4.8 |
| 2013-09-01 | 11:15—17:08 | A, C | 槽后 | 4556~5595 | 2.8~8.3 | -18~22 | 4.9 |
| 2013-09-04 | 10:11—18:35 | A, C, D | 槽底 | 4558~5470 | 4.2~8.2 | -21~1 | 4.4 |
| 2013-09-06 | 10:40—19:32 | A, C, D | 低涡 | 4640~5354 | 2.8~8.2 | -23~14 | 4.6 |
| 2013-09-23 | 09:58—16:19 | A, C, D | 槽底 | 4582~5518 | 2.8~8.2 | -28~12 | 4.2 |
| 2013-09-25 | 10:41—17:30 | A, C, D | 槽底 | 4950~5460 | 2.8~8.2 | -24~16 | 4.6 |
DownLoad: Download CSV
Table 3 Statistical characteristics of aerosol and CCN in each flight measurement field over the central and eastern Qinghai-Tibet Plateau
| 观测区 | Na/cm-3 | De/μm | Nccn/cm-3 | 核化率/% | |||
| 0.07%~0.3% | 0.3%~0.8% | 0.8%~2.0% | |||||
| 格尔木地区 | 不高于6 km | 634 | 0.37 | 138 | 146 | 304 | 21~47 |
| 高于6 km | 2226 | 0.11 | 86 | 182 | 50 | 2~8 | |
| 长江源区 | 1453 | 0.107 | 82 | 102 | 35 | 2~7 | |
| 三江共源区 | 695 | 0.369 | 59 | 10 | 93 | 1~13 | |
| 黄河上游河曲地区 | 467 | 0.237 | 20 | 48 | 79 | 4~16 | |
| 青藏高原中东部 | 1488 | 0.232 | 47 | 128 | 147 | 3~10 | |
DownLoad: Download CSV
| [1] |
Haywood J, Boucher O.Estimates of the direct and indirect radiative forcing due to tropospheric aerosols:A review. Reviews of Geophysics, 2000, 38(4):513-543. doi: 10.1029/1999RG000078
|
| [2] |
Hanna E. Radiative Forcing of Climate Change: Expanding the Concept and Addressing Uncertainties. Washington DC: National Academies Press, 2005.
|
| [3] |
Qu W Z, Liu Y C, Huang F, et al. The space-time propagation patterns of the stratospheric volcanic aerosols and the preliminary analysisi of their climate effect. J Appl Meteor Sci, 2010, 21(5): 627-631. http://qikan.camscma.cn/article/id/20100513
|
| [4] |
Song L M, Liu Y, Zhu B, et al. Direct effects of tropospheric aerosols on stratospheric climate. J Appl Meteor Sci, 2014, 25(1): 83-94. http://qikan.camscma.cn/article/id/20140109
|
| [5] |
Bates T S, Coffman D J, Covert D S, et al. Regional marine boundary layer aerosol size distributions in the Indian, Atlantic, and Pacific Oceans: A comparison of INDOEX measurements with ACE-1, ACE-2, and Aerosols99. J Geophys Res Atmos, 2002, 107(19): INX225-1-INX225-15. http://saga.pmel.noaa.gov/sites/default/files/atoms/files/bates_etal_2002.pdf
|
| [6] |
Lu G X, Guo X L. Distribution and origin of aerosol and its transform relationship with CCN derived from the spring multi-aircraft measurements of Beijing Cloud Experimenr(BCE). Chin Sci Bull, 2012, 57(15): 1334-1344. https://www.cnki.com.cn/Article/CJFDTOTAL-KXTB201215008.htm
|
| [7] |
Wang W J, Guo X L, Li H Y, et al. Aerosol characteristic beneath the clouds base on airborne observation in early summer over Sichuan Basin. Journal of Arid Meteorology, 2018, 36(2): 167-175.
|
| [8] |
Guo L J, Guo X L, Fang C G, et al. Observation analysis on characteristics of formation, evolution and transition of a long-lasting severe fog and haze episode in North China. Science China(Earth Sciences), 2015, 45(4): 427-443. https://www.cnki.com.cn/Article/CJFDTOTAL-JDXK201504005.htm
|
| [9] |
Sun Y L. Vertical structures of physical and chemical properties of urban boundary layer and formation mechanisms of atmospheric pollution. Chin Sci Bull, 2018, 63(14): 1374-1389.
|
| [10] |
Feng Q J, Niu S J, Li P R, et al. Aircraft measurement of the scattering Properties of aerosol in Shanxi Province in summer. Climatic and Environmental Research, 2019, 24(4): 482-492. https://www.cnki.com.cn/Article/CJFDTOTAL-QHYH201904007.htm
|
| [11] |
Huang J Y, Zhao D L, Chen B J, et al. Aircraft observation of aerosol properties in Beijing. China Environmental Science, 2021, 41(5): 2073-2080. doi: 10.3969/j.issn.1000-6923.2021.05.010
|
| [12] |
Ma X L, Gao X N, Liu Y, et al. Simulations of aerosol influences on the East Asian winter monsoon. J Appl Meteor Sci, 2018, 29(3): 333-343. doi: 10.11898/1001-7313.20180307
|
| [13] |
Li D P, Cheng X H, Sun Z A, et al. Radiative effects of aerosols in different area of Beijing. J Appl Meteor Sci, 2018, 29(5): 609-618. doi: 10.11898/1001-7313.20180509
|
| [14] |
Zhang L Y, Yan P, Mao J T, et al. Observational study on aerosol scattering phase function at Raoyang of Hebei, China. J Appl Meteor Sci, 2017, 28(4): 436-446. doi: 10.11898/1001-7313.20170405
|
| [15] |
Jiao J, Jia X F, Yan P, et al. Chemical characteristics of PM10 at background stations of central and eastern China in 2016-2017. J Appl Meteor Sci, 2021, 32(1): 65-77. doi: 10.11898/1001-7313.20210106
|
| [16] |
Lu C S, Xue Y Q, Zhu L, et al. Evaluation of aerosol indirect effect based on aircraft observations of stratocumulus. Trans Atmos Sci, 2021, 44(2): 279-289.
|
| [17] |
Peng Y Y, Liu Y, Miao Y C. A numerical study on impacts of greenhouse gases on Asian summer monsoon. J Appl Meteor Sci, 2021, 32(2): 245-256. doi: 10.11898/1001-7313.20210209
|
| [18] |
Yang Y M, Zhou Y Q, Cai Z X. A case study of aircraft observation of aerosol vertical distribution and activation characteristics. Meteor Mon, 2020, 46(9): 1199-1209. https://www.cnki.com.cn/Article/CJFDTOTAL-QXXX202009007.htm
|
| [19] |
Yao T, Thompson L G, Mosbrugger V, et al. Third pole environment(TPE). Environ Dev, 2012, 3: 52-64. doi: 10.1016/j.envdev.2012.04.002
|
| [20] |
Chen D L, Xu B Q, Yao T D, et al. Assessment of past, present and future environmental changes on the Tibetan Plateau. Chin Sci Bull, 2015, 60(32): 3025-3035.
|
| [21] |
Sun H L, Zheng D, Yao T D, et al. Protection and construction of the national ecological security shelter zone on Tibetan Plateau. Acta Geogr Sinica, 2012, 67(1): 3-12. https://www.cnki.com.cn/Article/CJFDTOTAL-DLXB201201003.htm
|
| [22] |
Chen X, Kuang W H. Analysis of the characteristics of ecosystem changes on the Qinghai-Tibet plateau from 1990 to 2015. Journal of Southwest Minzu University(Nat Sci Ed), 2019, 45(3): 233-242. https://www.cnki.com.cn/Article/CJFDTOTAL-XNMZ201903003.htm
|
| [23] |
Li X R. Characteristics of temperature and precipitation change on the Tibet Plateau under the background of global warming. Advances in Geosciences, 2019, 9(11): 1042-1049.
|
| [24] |
Li Y, Hasbagan Ganjurjav, Hu G Z, et al. Effects of warming on carbon exchange in an alpine steppe in the Tibetan Plateau. Acta Ecologica Sinica, 2019, 39(6): 2004-2012.
|
| [25] |
Li R, Ji G L. Aerosol Features over northern Tibetan Plateau. Plateau Meteorology, 2004, 23(4): 501-505. doi: 10.3321/j.issn:1000-0534.2004.04.013
|
| [26] |
Yin X F, Kang S C, Zhang Q G, et al. Study of air pollutants in the inland Tibetan Plateau(Nam Co Station). Chinese Journal of Nature, 2020, 42(5): 373-378. doi: 10.3969/j.issn.0253-9608.2020.05.003
|
| [27] |
Wu H, Xu X F, Yang X Y, et al. Three-dimensional distribution and transport characteristics of dust over Tibetan Plateau and surrounding areas. Acta Scientiae Circumstantiae, 2020, 40(11): 273-283.
|
| [28] |
Yu G M, Xu J Z, Ren J W. The progress of aerosol research in the Tibetan Plateau. Journal of Glaciology and Geocryology, 2012, 34(3): 609-617.
|
| [29] |
Tang X Y, Luo L, Jin Z C. Development of study on atmospheric aerosol in Tibetan Plateau. Plateau and Mountain Meteorology Research, 2012, 32(2): 95-99. doi: 10.3969/j.issn.1674-2184.2012.02.019
|
| [30] |
Kang S C, Cong Z Y, Wang X P, et al. The transboundary transport of air pollutants and their environmental impacts on Tibetan Plateau. Chin Sci Bull, 2019, 64(27): 2876-2884. https://www.cnki.com.cn/Article/CJFDTOTAL-KXTB201927013.htm
|
| [31] |
Xu B Q, Cao J J, James H S, et al. Black soot and the survival of Tibetan glaciers. Proceedings of the National Academy of Sciences, 2009, 106(52): 22114-22118. doi: 10.1073/pnas.0910444106
|
| [32] |
Liu J, Song X, Fu G, et al. Precipitation isotope characteristics and climatic controls at a continental and an island site in Northeast Asia. Climate Research, 2011, 49(1): 29-44. doi: 10.3354/cr01013
|
| [33] |
Gao L, Zhang L Y, Li J, et al. Retrieval of atmospheric aerosol optical depth over land from AVHRR. J Appl Meteor Sci, 2014, 25(1): 42-51. http://qikan.camscma.cn/article/id/20140105
|
| [34] |
Duan J, Lou X F, Chen Y, et al. Aircraft measurement of aerosol vertical distributions and its activation efficiency over the Pearl River Delta. J Appl Meteor Sci, 2019, 30(6): 677-689. doi: 10.11898/1001-7313.20190604
|
| [35] |
Jin J L, Yan P, Ma Z Q, et al. Characteristics of PM2.5 in Beijing and surrounding areas from January to March in 2013. J Appl Meteor Sci, 2014, 25(6): 690-700. http://qikan.camscma.cn/article/id/20140605
|
| [36] |
Xu X B. Observational study advances of haze and photochemical pollution in China. J Appl Meteor Sci, 2016, 27(5): 604-619. doi: 10.11898/1001-7313.20160509
|
| [37] |
Zhou R J, Chen Y J, Bi Y, et al. Aerosol distribution over the Qinghai-Tibetan Plateau and its relationship with ozone. Plateau Meteorology, 2008, 27(3): 500-508. https://www.cnki.com.cn/Article/CJFDTOTAL-GYQX200803004.htm
|
| [38] |
Li W L, Yu S M. The spatial and temporal distribution of aerosols over the Tibetan Plateau and the numerical simulation of their radiative forcing and climatic effects. Chinese Science(Geosciences), 2001, 31(Suppl Ⅰ): 300-307. https://www.cnki.com.cn/Article/CJFDTOTAL-JDXK2001S1045.htm
|
| [39] |
Chen S H, Fu S, Zhuang L. Temporal and spatial distribution characteristics of atmospheric aerosols in the Tibetan Plateau. Environmental Protection and Technology, 2016, 22(5): 26-29. doi: 10.3969/j.issn.1674-0254.2016.05.007
|
| [40] |
Lüthi Z, Škerlak B, Kim S, et al. Atmospheric brown clouds reach the Tibetan Plateau by crossing the Himalayas. Atmos Chem Phys, 2015(15): 1-15. http://publications.iass-potsdam.de/pubman/item/escidoc:948894:11/component/escidoc:1174888/948894_supplement.pdf
|
| [41] |
Yang D Z, Yu X L, Fang X M, et al. A study of aerosol at regional backgroud station and baseline station. J Appl Meteor Sci, 1996, 7(4): 396-405. http://qikan.camscma.cn/article/id/19960462
|
| [42] |
Liu H Y, Zhang X Y, Shen Z B. The chemical composition and concentration of atomspheric aerosol at Wudaoliang and its seasonal variation. Plateau Meteorology, 1997, 16(2): 11-18. https://www.cnki.com.cn/Article/CJFDTOTAL-GYQX702.001.htm
|
| [43] |
Lee H N, Tositti L, Zheng X, et al. Analyses and comparisons of variations of 7Be, 210Pb, and 7Be/210Pb with ozone observations at two Global Atmosphere Watch stations from high mountains. John Wiley & Sons, Ltd, 2007, 112(D5): D05303. doi: 10.1029/2006JD007421/full
|
| [44] |
Yang L Y, Wang M X, Lu G T, et al. The observation and research for the continental aerosol background characteristic in the northern part of the Qinghai-Tibetan Plateau. Plateau Meteorology, 1994, 13(2): 135-143. https://www.cnki.com.cn/Article/CJFDTOTAL-GYQX402.003.htm
|
| [45] |
Ma X Q, He J A. Location analysis of cloud and precipitation physical observation equipment installed on propeller aircraft. Qinghai Meteorology, 2011, 1(3): 80-85.
|
| [46] |
Baumgardner D. An Analysis and comparison of five water droplet measuring instruments. Journal of Applied Meteorology, 2010, 22(5): 891-910.
|
| [47] |
Rangno A L, Hobbs P V. Microstructures and precipitation development in cumulus and small cumulonimbus clouds over the warm pool of the tropical Pacifific Ocean. Q J R Meteorol Soc, 2010, 131(606): 639-673. http://www.onacademic.com/detail/journal_1000034849616510_8817.html
|
| [48] |
Zhang Q, Quan J, Tie X, et al. Impact of aerosol particles on cloud formation: Aircraft measurements in China. Atmospheric Environment, 2011, 45(3): 665-672. doi: 10.1016/j.atmosenv.2010.10.025
|

Figures(6) / Tables(3)
