Zhou Qing, Li Bai, Zhang Yong, et al. Identification on cloud macroscopic physical characteristics based upon multi-source observations in Beijing. J Appl Meteor Sci, 2023, 34(2): 206-219. DOI:  10.11898/1001-7313.20230207.
Citation: Zhou Qing, Li Bai, Zhang Yong, et al. Identification on cloud macroscopic physical characteristics based upon multi-source observations in Beijing. J Appl Meteor Sci, 2023, 34(2): 206-219. DOI:  10.11898/1001-7313.20230207.

Identification on Cloud Macroscopic Physical Characteristics Based upon Multi-source Observations in Beijing

DOI: 10.11898/1001-7313.20230207
  • Received Date: 2022-08-04
  • Rev Recd Date: 2023-01-11
  • Publish Date: 2023-03-31
  • The knowledge of accurate cloud heights (including cloud base height and cloud top height) information and its variation is of great importance to elucidating synoptic variation and improving climate model and prediction precision. Utilizing the theory of variation continuity and first-order discontinuity of meteorological element in frontal zone, cloud front zone is defined as transitional zone between the cloud cluster and its adjacent area in vertical direction in order to solve the problem of cloud heights uncertainties observed by different equipments. According to the humidity, scattering and turbulence properties of cloud, using observation from L-band sounding, Ka-band millimeter wave cloud radar (MMCR) and the wind profiler, the variation characteristics of temperature, humidity, radar reflectivity and signal noise ratio (SNR) as well as their differences from the ambient atmosphere are studied. In addition, the differences between convective clouds and stratified clouds are studied in terms of the characteristics of element gradient variation inside and outside clouds. Finally, the identification for cloud front zone is verified by case study and the reasonable scope and identification criterion for cloud base height and cloud top height are concluded. The results show that the first-order and second-order derivative of temperature, humidity, and radar reflectivity are discontinuous in cloud front zone (they are not equal inside and outside the cloud front region), and the vertical gradient of SNR retrieved by wind profiler is also instable, which shows that the cloud boundary range with better spatial consistency can be obtained by different devices, based on the frontal theory. In addition, there are two indicators that can be utilized to distinguish the stratiform clouds from convective clouds. The first is the difference between the vertical gradient of temperature and humidity in clouds and that in ambient atmosphere, which is larger in convective clouds than that in stratiform clouds. The second is the fluctuation amplitude of the second-order derivative of reflectivity in clouds, which is also larger in convective clouds than that in stratiform clouds. The concept of cloud front zone can be used to comprehensively identify the common range of cloud height detected by different devices, indicating that there are consistent variation characteristics in a certain area near the cloud front zone for different devices. The similarity of cloud vertical structures retrieved by multi-source equipment observation are elucidated through the characteristics of cloud front zone, which is worth applying for collaborative observation of different devices.
  • Fig. 1  MMCR-observed radar reflectivity from 0000 BT to 2359 BT(a) and from 1800 BT to 2100 BT(b) on 28 Aug 2017

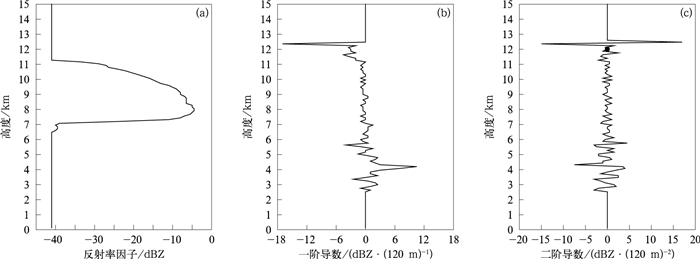
    Fig. 2  Profiles of MMCR-observed reflectivity(a) and its first-order derivative(b), second-order derivative(c) at 1940 BT 28 Aug 2017

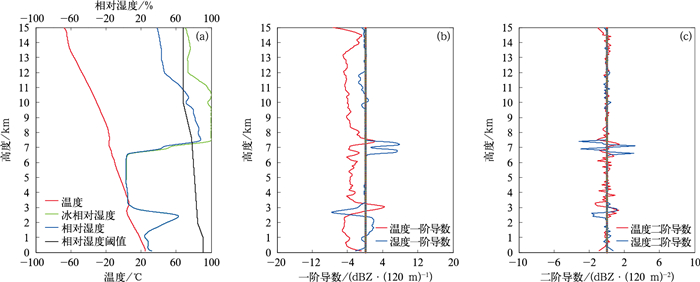
    Fig. 3  Profiles of radiosonde-observed temperature, relative humidity, relative humidity below 0℃, judgment entry cloud relative humidity threshold(a) and temperature, relative humidity first-order derivative(b), second-order derivative(c) at 2000 BT 28 Aug 2017

    Fig. 4  SNR(a) and its first-order derivative(b) from 0000 BT to 2359 BT, with SNR(c) and its first-order derivative(d) from 1800 BT to 2100 BT observed by WPR on 28 Aug 2017

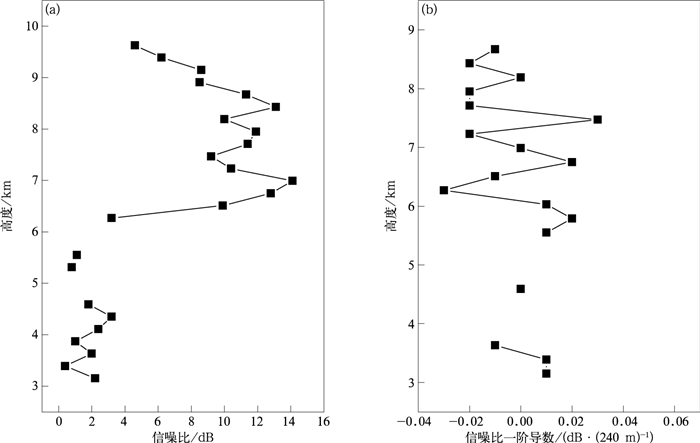
    Fig. 5  Profiles of WPR-observed SNR(a) and its first-order derivative(b) at 1940 BT 28 Aug 2017

    Fig. 6  The same as in Fig. 1,but on 30 Jun 2018

    Fig. 7  The same as in Fig. 2,but at 1930 BT 30 Jun 2018

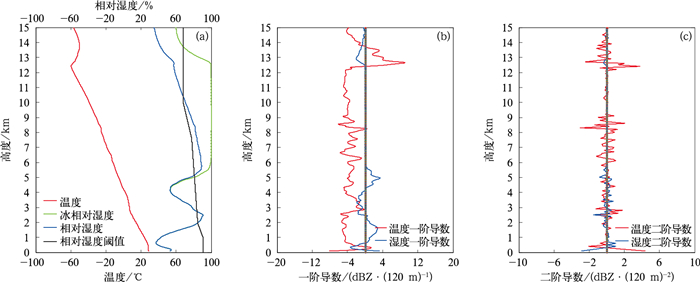
    Fig. 8  The same as in Fig. 3,but at 2000 BT 30 Jun 2018

    Fig. 9  The same as in Fig. 4,but on 30 Jun 2018

    Table  1  Identification criterion for cloud frontal zone on 28 Aug 2017 and 27 Jul 2017

    探测设备 云锋区范围 判识条件
    云底高度 毫米波雷达 7.08~7.32 km(个例1)
    5.76~6.00 km(个例2)
    取极大值,从极大值迅速降为极小值的区域
    探空 7.25~7.34 km(个例1)
    5.80~6.00 km(个例2)
    取极大值,且RH达饱和阈值,且
    风廓线雷达 7.00~7.47 km(个例1)
    4.83~5.07 km(个例2)
    信噪比的一阶导数取极大值
    云顶高度 毫米波雷达 11.28~11.40 km(个例1)
    10.32~11.16 km(个例2)
    取极小值,从极小值迅速增为极大值的区域
    探空 11.18~12.78 km(个例1)
    11.05~11.77 km(个例2)
    RH接近未饱和阈值,且≤0,≥0
    DownLoad: Download CSV

    Table  2  Identification criterion for cloud frontal zone on 30 Jun 2018 and 18 Aug 2017

    探测设备 云锋区范围 判识条件
    云底高度 毫米波雷达 4.20~4.32 km(个例3)
    5.04~5.16 km(个例4)
    取极大值,或从极大值迅速降为极小值的区域
    探空 4.28~5.03 km(个例3)
    4.93~5.12 km(个例4)
    RH达饱和阈值,且≤0,≥0
    云顶高度 毫米波雷达 12.60~12.72 km(个例3)
    9.12~9.84 km(个例4)
    取极小值,或从极小值迅速增为极大值的区域
    探空 12.50~13.50 km(个例3)
    9.70~10.21km(个例4)
    RH低于饱和阈值,且≤0,≥0
    DownLoad: Download CSV
  • [1]
    Cess R D, Potter G L, Zhang M H, et al.Interpretation of snow-climate feedback as produced by 17 general circulation models.Science, 1991, 253(5022):888-892. doi:  10.1126/science.253.5022.888
    [2]
    Zhou C, Zelinka M D, Klein S A. Impact of decadal cloud variations on the Earth' s energy budget. Nature Geoscience, 2016, 9: 871-874. doi:  10.1038/ngeo2828
    [3]
    Stephens G L. Cloud feedbacks in the climate system: A critical review. J Climate, 2005, 18: 237-273. doi:  10.1175/JCLI-3243.1
    [4]
    Zelinka M D, Klein S A, Taylor K E. Contributions of different cloud types to feedbacks and rapid adjustments in CMIP. J Climate, 2013, 26(14): 5007-5027. doi:  10.1175/JCLI-D-12-00555.1
    [5]
    Liu C W, Guo X L, Duan W, et al. Observation and analysis of microphysical characteristics of stratiform clouds with embedded convections in Yunnan. J Appl Meteor Sci, 2022, 33(2): 142-154. doi:  10.11898/1001-7313.20220202
    [6]
    Zhou Q, Zhang Y, Jia S, et al. Climatology of cloud vertical structures from long-term high-resolution radiosonde measurements in Beijing. Atmosphere, 2020, 11(4): 401. doi:  10.3390/atmos11040401
    [7]
    Guo X L, Fu D H, Guo X, et al. Advances in aircraft measurements of clouds and precipitation in China. J Appl Meteor Sci, 2021, 32(6): 641-652. doi:  10.11898/1001-7313.20210601
    [8]
    Liu J, Cui P, Xiao M. The bias analysis of FY-2G cloud fraction in summer and winter. J Appl Meteor Sci, 2017, 28(2): 177-188. doi:  10.11898/1001-7313.20170205
    [9]
    Illingworth A J, Hogan R J, O'Connor E J, et al. Cloudnet-Continuous evaluation of cloud profiles in seven operational models using ground-based observations. Bull Amer Meteor Soc, 2007, 88: 883-898. doi:  10.1175/BAMS-88-6-883
    [10]
    Zhong L Z, Liu L P, Ge R S. Characteristics about the millimeter wavelength radar and its status and prospect in and abroad. Adv Earth Sci, 2009, 24(4): 383-391. doi:  10.3321/j.issn:1001-8166.2009.04.004
    [11]
    Zhang Y, Zhou Q, Lv S, et al. Elucidating cloud vertical structures based on three-year Ka-band cloud radar observations from Beijing, China. Atmos Res, 2019, 222: 88-99. doi:  10.1016/j.atmosres.2019.02.007
    [12]
    Zhou Q, Zhang Y, Li B, et al. Cloud-base and cloud-top heights determined from a ground-based cloud radar in Beijing, China. Atmos Environ, 2019, 201: 381-390. doi:  10.1016/j.atmosenv.2019.01.012
    [13]
    Tao F, Guan L, Zhang X F, et al. Variation and vertical structure of clear-air echo by Ka-band cloud radar. J Appl Meteor Sci, 2020, 31(6): 719-728. doi:  10.11898/1001-7313.20200607
    [14]
    Martucci G, Milroy C, O'Dowd C D. Detection of cloud-base height using Jenoptik CHM15K and Vaisala CL31 ceilometers. J Atmos Oceanic Technol, 2010, 27(2): 305-318. doi:  10.1175/2009JTECHA1326.1
    [15]
    Borg L A, Holz R E, Turner D D. Investigating cloud radar sensitivity to optically thin cirrus using collocated Raman lidar observations. Geophys Res Lett, 2011, 38(38): 387-404.
    [16]
    Gage K S, Green J L, Vanzandt T E. Use of Doppler radar for the measurement of atmospheric turbulence parameters from the intensity of clear-air echoes. Radio Science, 1980, 15: 407-416. doi:  10.1029/RS015i002p00407
    [17]
    Guan L, Dai J H, Tao L, et al. Application of QVP method to winter precipitation observation based on polarimetric radar. J Appl Meteor Sci, 2021, 32(1): 91-101. doi:  10.11898/1001-7313.20210108
    [18]
    Zhang X F, Wang Z C, Mao J J, et al. Experiments on improving temperature and humidity profile retrieval for ground-based microwave radiometer. J Appl Meteor Sci, 2020, 31(4): 385-396. doi:  10.11898/1001-7313.20200401
    [19]
    Zhou Q, Zhang Y, Jin J, et al. Comparison of atmospheric boundary layer height retrieved from radiosonde and groundbased microwave radiometer measurements. IEEE Xplore, 2020. DOI:  10.1109/ICMO49322.2019.9026100.
    [20]
    Naud C, Muller J P, Clothiaux E E. Comparison between active sensor and radiosonde cloud boundaries over the ARM Southern Great Plains site. J Geophys Res Atmos, 2003, 108(D4): 291-302.
    [21]
    Tang Y J, Ma S Q, Yang L, et al. Observation and comparison of cloud-base heights by ground-based milllimeter-wave cloud radar. J Appl Meteor Sci, 2015, 26(6): 680-687. doi:  10.11898/1001-7313.20150604
    [22]
    Zhang Y P, Zhang W X, Lv D R, et al. Cloud top heights measured by METOP-AIASI instrument compared with ground-based cloud radar. Chinese J Atmos Sci, 2014, 38(5): 874-884. https://www.cnki.com.cn/Article/CJFDTOTAL-DQXK201405005.htm
    [23]
    Wang Z, Wang Z H, Cao X Z. Consistency analysis for cloud vertical structure derived from millimeter cloud radar and radiosonde profiles. Acta Meteor Sinica, 2016, 74(5): 815-826. https://www.cnki.com.cn/Article/CJFDTOTAL-QXXB201605012.htm
    [24]
    Zhu Q G, Lin J R, Shou S W, et al. Principles and Methods of Synoptic Science. Beijing: China Meteorological Press, 2012.
    [25]
    Li W, Zhao P T, Guo Q Y, et al. The international radiosonde intercomparison results for China-made GPS radiosonde. J Appl Meteor Sci, 2011, 22(4): 453-462. http://qikan.camscma.cn/article/id/20110408
    [26]
    Li W, Xing Y, Ma S Q. The analysis and comparison between GTS1 radiosonde made in China and RS92 radiosonde of Vaisala company. Meteor Mon, 2009, 35(10): 97-102. https://www.cnki.com.cn/Article/CJFDTOTAL-QXXX200910013.htm
    [27]
    Zhang J, Chen H, Bian J, et al. Development of cloud detection methods using CFH, GTS1, and RS80 radiosondes. Adv Atmos Sci, 2012, 29(2): 236-248.
    [28]
    Cai M, Ou J J, Zhou Y Q, et al. Discriminating cloud area by using L-band sounding data. Chinese J Atmos Sci, 2014, 38 (2): 213-222. https://www.cnki.com.cn/Article/CJFDTOTAL-DQXK201402002.htm
    [29]
    Sun K Y, Ruan Z, Wei M. Preliminary estimation of specific humidity profiles with wind profile radar. J Appl Meteor Sci, 2013, 24(4): 407-415. http://qikan.camscma.cn/article/id/20130403
    [30]
    Mei Y, Li X F, Feng L. The application of wind profiler SNR data of Shanghai Pudong Airport in the detection of cloud base. J Civil Avia Flight Uni China, 2017, 28(6): 13-18. https://www.cnki.com.cn/Article/CJFDTOTAL-MHFX201706003.htm
    [31]
    Cai X D, Ming J, Wang Y. Analysis of dynamic and thermodynamic structural characteristic of the super Typhoon Jangmi (2008) using dropsonde data. Chinese J Geophys, 2019, 62(3): 825-835. https://www.cnki.com.cn/Article/CJFDTOTAL-DQWX201903002.htm
    [32]
    Chen M X, Xiao X, Gao F. Dynamical effect of outflow boundary on localized initiation and rapid enhancement of severe convection over Beijing-Tianjin-Hebei region. Chinese J Atmos Sci, 2017, 41(5): 897-917. https://www.cnki.com.cn/Article/CJFDTOTAL-DQXK201705001.htm
  • 加载中
  • -->

Catalog

    Figures(9)  / Tables(2)

    Article views (801) PDF downloads(102) Cited by()
    • Received : 2022-08-04
    • Accepted : 2023-01-11
    • Published : 2023-03-31

    /

    DownLoad:  Full-Size Img  PowerPoint