Zhao Chunsheng, Fang Yuanyuan, Yang Jie, et al. Distribution of carbon monoxide from MOPITT of 2000—2004 and comparisons with surface measurements in mt. Waliguan station. J Appl Meteor Sci, 2007, 18(1): 36-41.
Citation: Zhao Chunsheng, Fang Yuanyuan, Yang Jie, et al. Distribution of carbon monoxide from MOPITT of 2000—2004 and comparisons with surface measurements in mt. Waliguan station. J Appl Meteor Sci, 2007, 18(1): 36-41.

Distribution of Carbon Monoxide from MOPITT of 2000—2004 and Comparisons with Surface Measurements in Mt. Waliguan Station

  • Received Date: 2005-12-09
  • Rev Recd Date: 2006-10-08
  • Publish Date: 2007-02-28
  • Carbon monoxide (CO) is one of the main pollutants produced by incomplete combustion processes, such as the burning of fossil fuels in urban and industrial areas as well as by biofuel and biomass burning. CO has long been recognized for its critical role in tropospheric chemistry. Coupled with a one to three month lifetime, the wide variety and seasonal variation of sources makes CO an excellent tracer of atmospheric motions. Surface CO measurements which have generally been limited to surface or boundary layer measurements often substantially impacted by local pollution can not provided a global synoptic view of CO on a daily basis. To better understand global CO cycles, observations from the space are necessary. The Measurements of Pollution in the Troposphere (MOPITT) instrument, funded by the Canadian Space Agency and manufactured by COM DEV of Cambridge, Ontario, is launched onboard the NASA Earth Observing System (EOS) Terra satellite in December, 1999. MOPITT offers the first daily, global synoptic observations of CO since March 2000. The MOPITT data set contains CO total column amount, CO mixing ratios at six altitudes (850 hPa, 700 hPa, 500 hPa, 350 hPa, 250 hPa, 150 hPa) and the corresponding location and time along the track. Here Level 2, Version 3 MOPITT CO data are used which includes the latitude and longitude of MOPITT at nadir, the corresponding CO column and six layers of CO mixing ratio. The data are aggregated and interpolated to achieve grid data with a resolution of 1°×1° at 3-day average. Distribution properties and trend of CO from MOPITT of March 2000 to May 2004 are analyzed and comparisons with CMDL/NOAA surface CO measurements in Mt. Waliguan station are made. The results show that there is a large variation for global CO distribution. On the average, CO in Northern hemisphere is higher than that in Southern hemisphere. CO peak centers are located in East Asia, West Europe and North America in Northern hemisphere while in Middle West Africa and tropic regions of South America in Southern hemisphere. There is a significant seasonal variation for CO with a peak concentration in spring time in Northern hemisphere and in Autumn in Southern hemisphere. CO concentrations are high over coast regions of China and Japan all along a year. CO at Sichuan Basin which is located in the east of Qinghai-Tibet Plateau are higher than that of its surrounding regions. Trends analysis of Beijing and Mt. Waliguan suggests that CO concentrations over these two regions increase during 2000—2004. Comparisons with CMDL/NOAA surface CO measurement in Mt. Waliguan shows that the variations of these two datasets agree well and there is a significant correlation between MOPITT CO column and CMDL surface measurements. The increasing trend for CO during 2000—2004 obtained from these two datasets is at magnitude of a few thousandth.
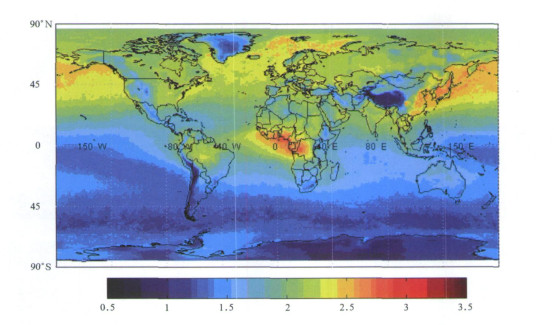
  • Fig. 1  Global CO column average during 2000—2004 (unit: 1018mol/cm2)

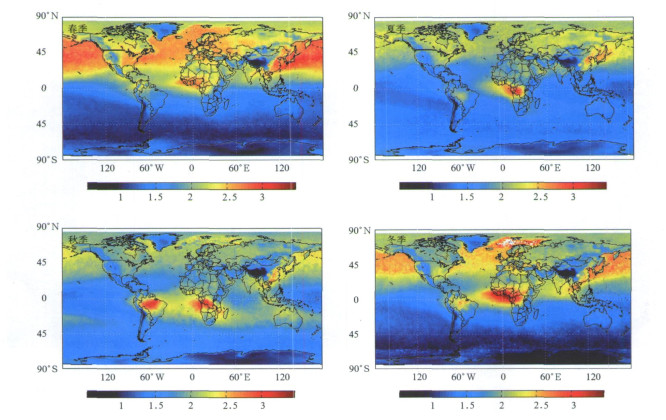
    Fig. 2  Seasonal distribution of global CO column during 2000—2004 (unit: 1018mol/cm2)

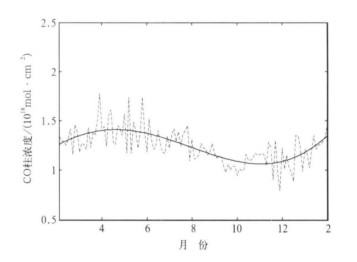
    Fig. 3  Seasonal variation of CO (dashed line) at Mt. Waliguan station during Mar 2000—May 2004

    (the solid line is the polynomial fitting curve of degree 5)

    Fig. 4  Variation and trends of monthly CO column at Beijing and Mt. Waliguan station during Mar 2000—May 2004

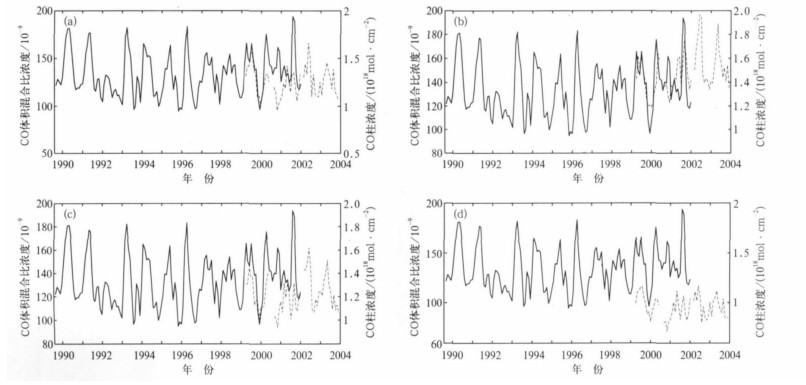
    Fig. 5  Comparison between CMDL CO at Mt. Waliguan station (solid line) and MOPITT monthly CO data (dashed line)

    (a) MOPITT CO column, (b) CO at 850 hPa, (c) CO at 700 hPa, (d) CO at 500 hPa

    Table  1  Statistic of column CO during March 2000—May 2004 at Beijing and Waliguan station (unit: mol/cm2)

  • [1]
    秦瑜, 赵春生.大气化学基础.北京:气象出版社, 2003.
    [2]
    Logan J A, Prather M J, Wofsy S C, et al. Tropospheric chemistry: A global perspective. J Geophys Res, 1981, 86: 7210-7254. doi:  10.1029/JC086iC08p07210
    [3]
    James R D. MOPITT: 12 Years of Planning and 2.5 Years of Operations. IEEE, 2002. http://ieeexplore.ieee.org/document/1025783/?reload=true&arnumber=1025783&filter%3DAND(p_IS_Number:22037)
    [4]
    Benesch W, Migeotte M, Neven L. Investigations of atmospheric CO at the Jungfraujoch. J Opt Soc Am, 1953, 43: 1119-1123. doi:  10.1364/JOSA.43.001119
    [5]
    Edwards D P, Lamarque J F, Attie'J L, et al. Tropospheric ozone over the tropical Atlantic: A satellite perspective. J Geophys Res, 108, D8, 4237, doi:  10.1029/2002JD002927, 2003.
    [6]
    Bremer H, Kar J, Drummond F, et al. Spatial and temporal variation of MOPITT CO in Africa and South America: A comparison with SHADOZ ozone and MODIS aerosol. J Geophys Res, 109, D12304, doi:10.1029/2003JD004234, 2004.
    [7]
    Fang Yuanyuan, Zhao Chunsheng, Li Chengcai. Analysis of the distribution of carbon monoxide from MOPITT over East Asia in 2002. Chinese Journal of Atmospheric Science, 2005, 29(4): 407-416. http://www.sciencedirect.com/science/article/pii/S0045653506012720
    [8]
    Emmons L, Attie J L, Gille J, et al. Seasonal Variation of Asia Outflow from MOPITT CO and MOZART. Geophysical Research Abstracts, 2003, 5, 08020. https://www.researchgate.net/publication/234440713_Seasonal_variation_of_Asian_outflow_from_MOPITT_CO
    [9]
    Zhao C, Peng L, Tie X X, et al. A High CO Episode of Longrange Transport Detected by MOPITT, Water, Air, & Soil Pollution. Jan 2006, Pages 1-10, DOI10.1007/s11270-006-9191-1. http://dx.doi.org/10.1007/s11270-006-9191-1.
    [10]
    Heald C L, Jacob D J, Fiore A M, et al. Asian outflow and transpacific transport of carbon monoxide and ozone pollution: An integrated satellite, aircraft and model perspective. J Geophys Res, 2003, 108 (D24), 4804, doi:  10.1029/2003JD003507.
    [11]
    Wang Jinxue, Merritt N D, John C G, et al. Retrieval of tropospheric carbon monoxide profiles from MOPITT: Algorithm description and retrieval simulation. J Geophys Res, 1999, 56: 219-232. http://cat.inist.fr/?aModele=afficheN&cpsidt=1174810
    [12]
    周凌, 汤洁, Ernst M, 等.中国西部本底大气中CO的连续测量.环境科学, 2001, 22(3): 1-5. http://www.cnki.com.cn/Article/CJFDTOTAL-HJKZ200103000.htm
  • 加载中
  • -->

Catalog

    Figures(5)  / Tables(1)

    Article views (5338) PDF downloads(1201) Cited by()
    • Received : 2005-12-09
    • Accepted : 2006-10-08
    • Published : 2007-02-28

    /

    DownLoad:  Full-Size Img  PowerPoint