Zhang Tengfei, Lu Yabin, Zhang Jie, et al. Contrast analysis of 4 heavy snow events in Yunnan since 2000. J Appl Meteor Sci, 2007, 18(1): 64-72.
Citation: Zhang Tengfei, Lu Yabin, Zhang Jie, et al. Contrast analysis of 4 heavy snow events in Yunnan since 2000. J Appl Meteor Sci, 2007, 18(1): 64-72.

Contrast Analysis of 4 Heavy Snow Events in Yunnan Since 2000

  • Received Date: 2005-06-13
  • Rev Recd Date: 2006-06-29
  • Publish Date: 2007-02-28
  • By using upper air observational data, surface observational data, MICAPS 1°×1° objective analysis data and Kunming Doppler Radar echo data, 4 heavy snow processes in Yunnan since 2000 are contrastively analyzed and diagnosed. The results show that in the 4 heavy snow processes in Yunnan, 2 processes aroused by the transversal trough pattern affect the western area of Ailao Mountain, the snow area is large with the strong intensity, the other 2 processes aroused by the north ridge and south trough pattern mainly affect the middle and the east Yunnan. 3 heavy snow processes accompany the southern trough. Warm and moist airflow in front of the south trough converges with the strong cold air, producing heavy snow. This is the major heavy snow pattern of Yunnan. But only one without south trough in 2005 is very special. Before and during the 4 heavy snow processes, the water vapour flux increases quickly. Most areas in Yunnan are in the big value band of the east—west water vapour flux, which indicates that plenty water vapour transports to Yunnan from the west whether the south trough exists or not. In 3 processes with active south trough, the water vapour comes from the southwest Bengal Bay and this is the main heavy snow pattern in Yunnan. In the heavy snow process without the south trough influencing, the water vapour comes to Yunnan from the west of Arabian sea along the India high pressure. The strong water vapour flux convergence belt and area can better indicate the heavy snow processes of Yunnan. The heavy snow always appears in the area of strong water vapour convergence and closes to the side of strong cold air in the east of the convergence center. Because the updraft and the downdraft in the south and the north coexist, the mesoscale vertical circulation near the front area may establish. When the cold air from the north moves to the south, the θse sharpness area also moves to the south, and then causes the water vapour brought by the south warm moist airflow to condense and the unstable energy to release, providing enough uplift condensation condition for the heavy snow. In the Doppler radar echo intensity field, the sheet cloud echo arouses the heavy snow, the intensity of sheet cloud echo is about 20 to 30 dBz. In the velocity field, the cold and warm advection's alternative change and the stronger southwest jet stream of the upper air in the middle and lower layer of troposphere are the major macro-scale characters of the heavy snow with the south trough in 2004. The partial east jet stream in the lower layer is the major macro-scale character of the heavy snow without the south trough in 2005. So the high and low level jet stream are the key to the heavy snow processes.
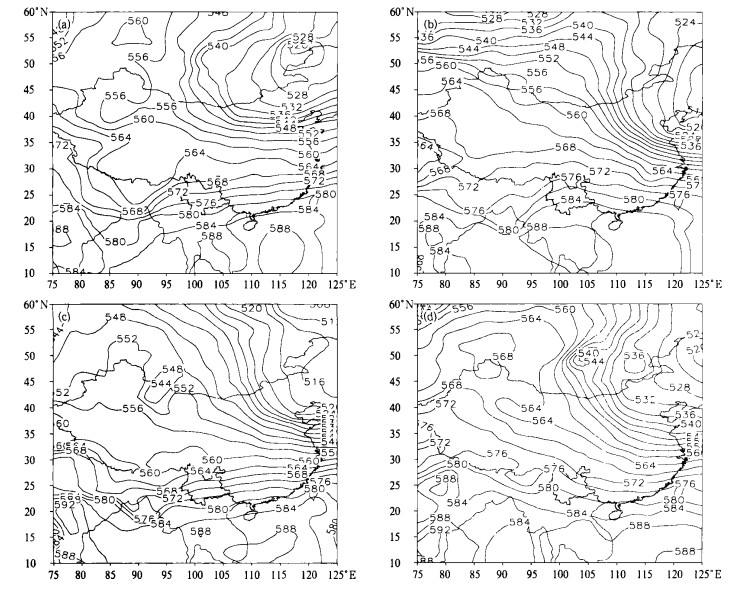
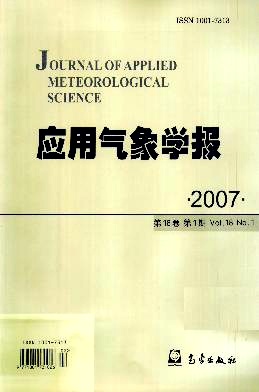
  • Fig. 1  The 500 hPa pattern at 08:00 on (a) Jan 29, 2000, (b) Jan 4, 2003, (c) Feb 6, 2004, (d) Mar 3, 2005 (unit: dagpm)

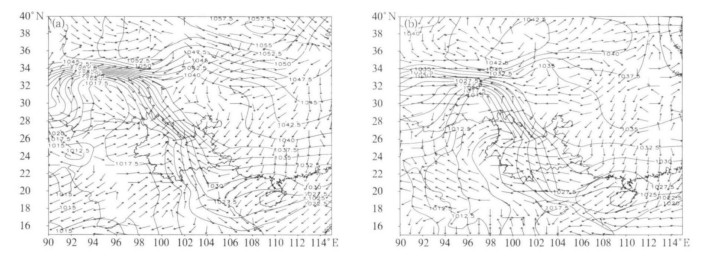
    Fig. 2  The surface wind field and height field (unit: hPa) on (a) Jan 30, 2000 and (b) Feb 7, 2004

    Fig. 3  The moisture flux distribution (unit: g·cm-1·hPa-1·s-1) and transfer direction at 08:00 at (a) 500 hPa on Jan 30, 2000, (b) 700 hPa on Jan 30, 2000, (c) 500 hPa on Mar 4, 2005, (d) 700 hPa on Mar 4, 2005

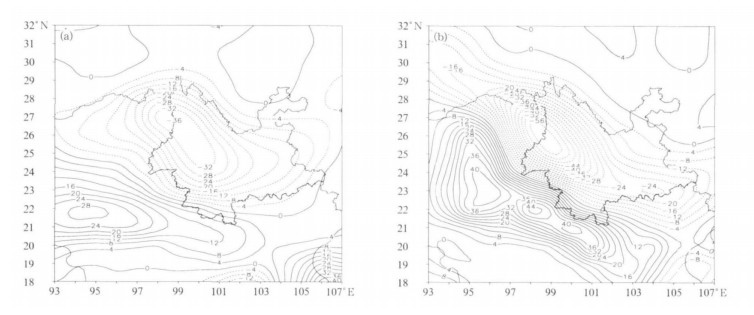
    Fig. 4  700 hPa moisture flux divergence distribution (unit: 10-8g·cm-2·hPa-1·s-1) at 08:00 on Jan 30, 2000 (a), 08:00 on Mar 4, 2005 (b)

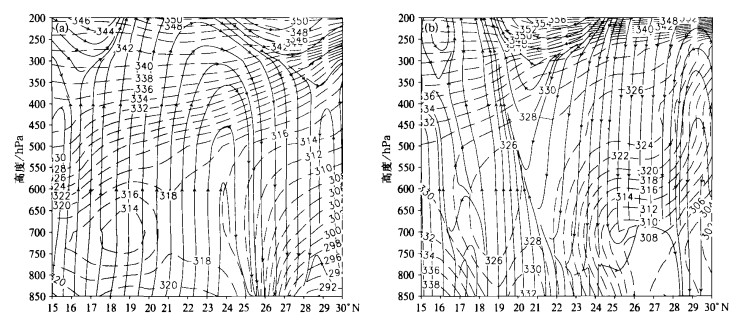
    Fig. 5  The vertical cross-section circulation (stream line) and θse distribution (dashed line, unit: K) across 102°E at 08:00 on Jan 29, 2000 (a), 08:00 on Mar 3, 2005 (b)

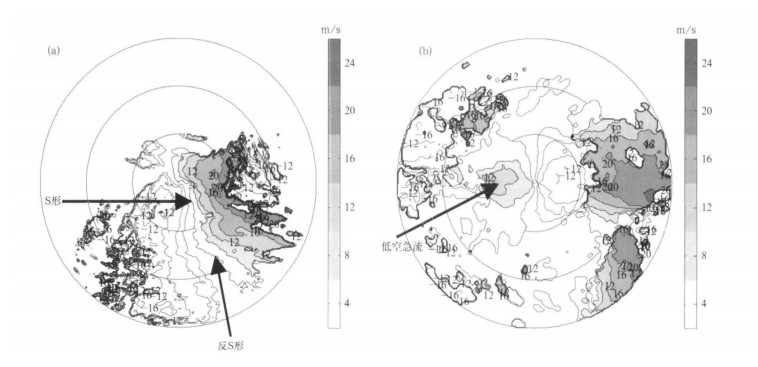
    Fig. 6  The radial velocity field in 50 km (unit: m·s-1, the elevation is 0.5°, shadow fields are positive velocity, solid lines are negative velocity) (a) at 15:39 on Feb 7, 2004 and (b) at 12:33 on Mar 4, 2005

    Table  1  The affected areas of 4 heavy snow processes in Yunnan and the statistic of the intensity

  • [1]
    秦剑, 琚建华, 解明恩.低纬高原天气气候.北京:气象出版社, 1997: 107-117.
    [2]
    段旭, 李英, 孙晓东.昆明准静止锋结构.高原气象, 2002, 21 (2): 205-209. http://www.cnki.com.cn/Article/CJFDTOTAL-GYQX200202013.htm
    [3]
    章淹, 林宗鸿, 陈渭民, 等.暴雨预报.北京:气象出版社.1990: 57-64.
    [4]
    吴国雄, 蔡雅萍, 唐晓菁.湿位涡和倾斜涡度发展.气象学报, 1995, 53 (4): 387-404. http://www.cnki.com.cn/Article/CJFDTOTAL-QXXB504.001.htm
    [5]
    张沛源, 陈荣林.多普勒速度图上的暴雨判据研究.应用气象学报, 1995, 6 (3): 371-374. http://qikan.camscma.cn/jams/ch/reader/view_abstract.aspx?file_no=19950358&flag=1
    [6]
    陈秋萍, 曾光平, 冯宏芳, 等.利用雷达回波资料对夏季对流云降水的初步探讨.应用气象学报, 2002, 14 (3): 387-404. http://qikan.camscma.cn/jams/ch/reader/view_abstract.aspx?file_no=20020344&flag=1
    [7]
    张晰莹, 张礼宝, 袁美英.一次降雪过程的多普勒雷达探测分析.气象科技, 2003, 31 (1): 179-182. http://www.cnki.com.cn/Article/CJFDTOTAL-QXKJ200303010.htm
  • 加载中
  • -->

Catalog

    Figures(6)  / Tables(1)

    Article views (3503) PDF downloads(1440) Cited by()
    • Received : 2005-06-13
    • Accepted : 2006-06-29
    • Published : 2007-02-28

    /

    DownLoad:  Full-Size Img  PowerPoint