| Citation: | Hu Xiuqing, Lu Naimeng, Zhang Peng. Remote sensing and detection of dust storm in China using the thermal bands of geostationary meteorological satellite. J Appl Meteor Sci, 2007, 18(3): 266-275.

|
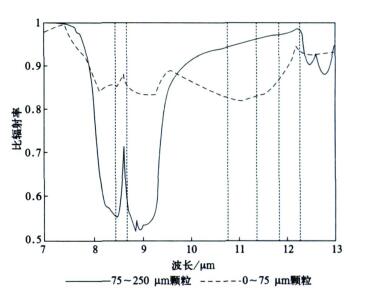
Fig. 1 Thermal infrared emissivity spectrum of pure quartz 75~250 μm and 0~75 μm of particle size[9]
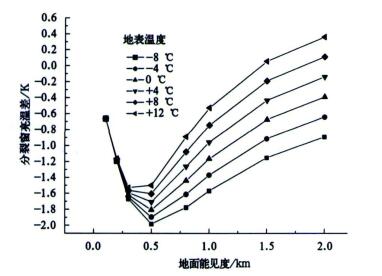
Fig. 2 Brightness temperature difference (BTD) in split window dependence of dust loading in several winter surface temperatures in mid-latitudes
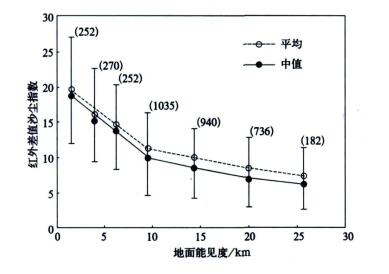
Fig. 3 Climatological relation between IDDI and visibility[6]
(visibility measurements being classified into seven categories defined by the intervals [0, 2.5], [2.5, 5], [5, 7.5], [7.5, 10], [10, 15], [15, 20], [20, 30] km; the number inside bracket denotes the sample number)
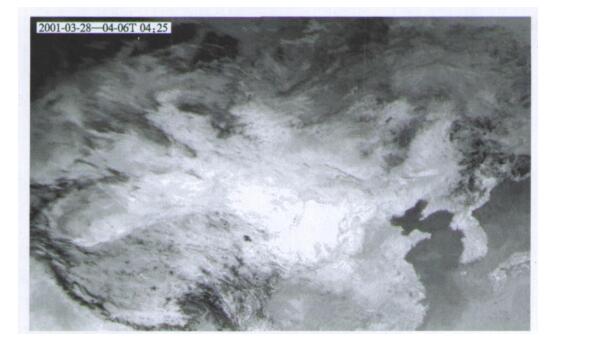
Fig. 4 GMS-5 integrated brightness temperature image of background during ten days
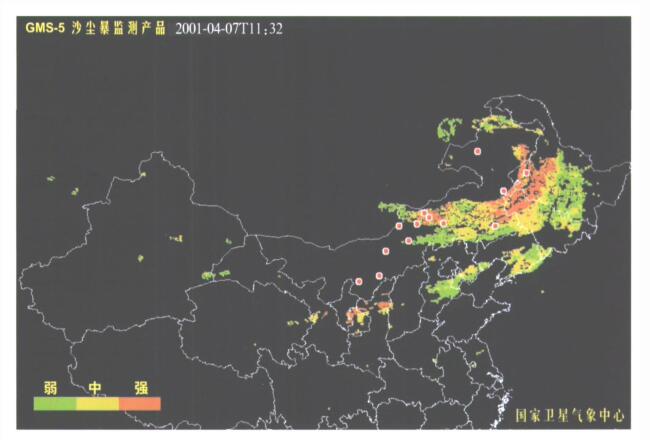
Fig. 5 GSM-5 dust detection grid image
(red points denote the weather station with the report of dust occurrence)
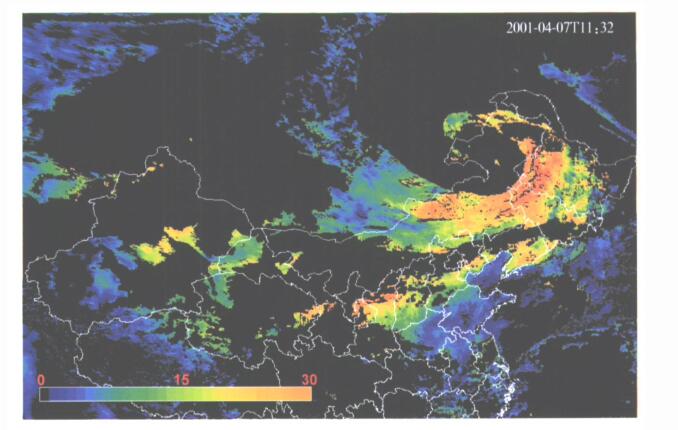
Fig. 6 GSM-5 IDDI image of single observation time
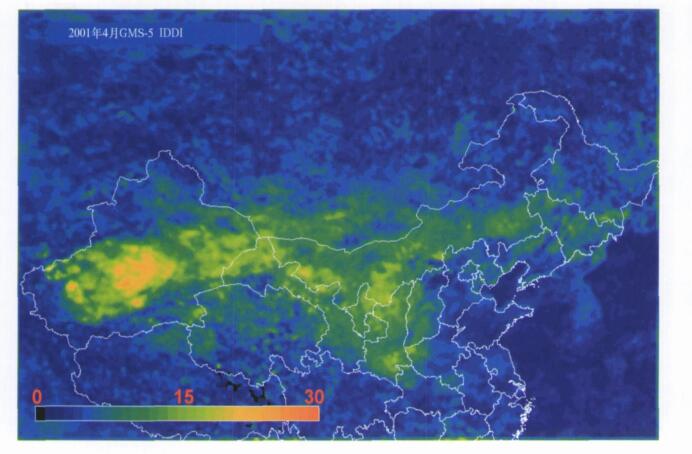
Fig. 7 GSM-5 monthly mean IDDI in North China
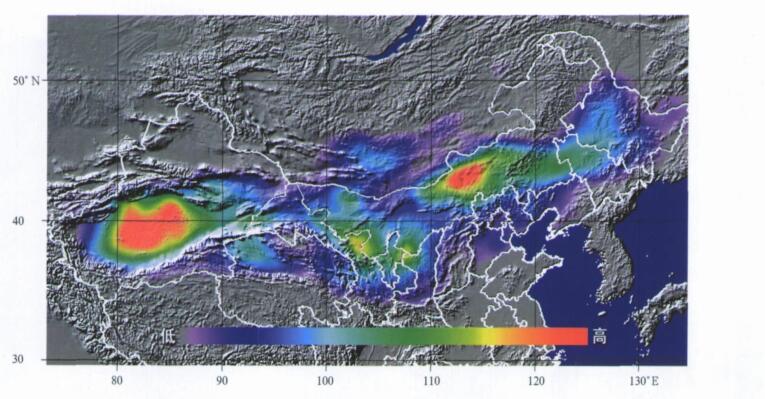
Fig. 8 Frequency of dust occurence in spring of 2001 by GSM-5 detection
(color bar means relative frequency)
| [1] |
石广玉, 赵思雄.沙尘暴研究中的若干科学问题.大气科学, 2003, 27(4):591-606. http://www.cnki.com.cn/Article/CJFDTOTAL-DQXK200304010.htm
|
| [2] |
Stowe L L, Ignatov A M, Singh R R. Development, validation, and potential enhancements to the second-generation operational aerosol product at the national environmental satellite, data, and information service of the National Oceanic and Atmospheric Administration. J Geophys Res, 1997, 102:16923-16934. doi: 10.1029/96JD02132
|
| [3] |
Moulin C, Guillard F, Dulac F, et al. Long term daily monitoring of Saharan dust load over ocean using Meteosat ISCCP-B2 data, part Ⅰ:Methodology and preliminary results for 1983-1994 in the Mediterranean. J Geophys Res, 1997, 102:16947-16958. doi: 10.1029/96JD02620
|
| [4] |
Kaufman Y J, Karnieli A, Tanre D. Detection of dust over deserts using satellite data in the solar wavelengths. IEEE Trans Geosci Remote Sensing, 2000, 38:525-531. doi: 10.1109/36.823947
|
| [5] |
Herman J R, Bhartia P K, Torres O, et al. Global distribution of UV-absorbing aerosols from Nimbus 7/TOMS data. J Geophys Res, 1997, 102:16911-16922. doi: 10.1029/96JD03680
|
| [6] |
Legrand M, Plana-Fattori A, N'doume. Satellite detection of dust using the IR imagery of Meteosat Ⅰ:Infrared difference dust index. J Geophys Res, 2001, 106(D16):18251-18274. doi: 10.1029/2000JD900749
|
| [7] |
Brooks N.Dust-climate Interactions in the Sahel-Sahara Zone of Northern Africa, with Particular Reference to Late Twentieth Century Sahelian Drought.Climatic Research Unit, University of East Anglia, Norwich UK, 2000.
|
| [8] |
Ackerman S A. Remote sensing aerosols using satellite infrared observations. J Geophys Res, 1997, 102:17069-17079. doi: 10.1029/96JD03066
|
| [9] |
Wald A, Kaufman Y J, Tanre D, et al. Daytime and nighttime detection of mineral dust over desert using infrared spectral contrast. J Geophys Res, 1998, 103:32307-32313. doi: 10.1029/98JD01454
|
| [10] |
Ackerman S A. Using the radiative temperature difference at 3.7 and 11 μm to track dust outbreaks. Remote Sensing Environment, 1989, 27:129-133. doi: 10.1016/0034-4257(89)90012-6
|
| [11] |
方宗义, 朱福康, 江吉喜, 等.中国沙尘暴研究.北京:气象出版社, 1997:82-87.
|
| [12] |
方宗义, 张运刚, 郑新江, 等.用气象卫星遥感监测沙尘的方法和初步研究.第四纪研究, 2001, 21(1):48-55. http://www.cnki.com.cn/Article/CJFDTOTAL-DSJJ200101006.htm
|
| [13] |
郑新江, 陆文杰, 罗敬宁.气象卫星多通道信息监测沙尘暴的研究.遥感学报, 2001, 5(4):300-306. http://www.cnki.com.cn/Article/CJFDTOTAL-YGXB200104009.htm
|
| [14] |
罗敬宁, 范一大, 史培军, 等.多源遥感数据沙尘暴强度监测的信息可比方法.自然灾害学报, 2003, 12(2):28-34. http://www.cnki.com.cn/Article/CJFDTOTAL-ZRZH200302005.htm
|
| [15] |
胡秀清, 卢乃锰, 邱红, 等.利用静止气象卫星监测沙尘暴.气候与环境研究, 2003, 8(1):101-106. http://www.cnki.com.cn/Article/CJFDTOTAL-QHYH200301011.htm
|
| [16] |
胡秀清. 中国北方沙尘暴的静止气象卫星遥感监测研究. 北京: 北京师范大学地理学与遥感科学学院, 2004.
|
| [17] |
Hu Xiuqing, Lu Naimeng, Zhang Peng, et al. China Dust Storm Monitoring Using Meteorological Satellite. The 24th Asia Conference on Remote Sensing & 2003 International Symposium on Remote Sensing. Busan, Korea, 2003:707-709.
|
| [18] |
周自江, 王锡稳, 牛若芸.近47年中国沙尘暴气候特征研究.应用气象学报, 2002, 13 (2):193-200. http://qikan.camscma.cn/jams/ch/reader/view_abstract.aspx?file_no=20020225&flag=1
|
| [19] |
杨东贞, 王超, 温玉璞, 等.1990年春季两次沙尘暴特征分析.应用气象学报, 1995, 6(1):18-26. http://qikan.camscma.cn/jams/ch/reader/view_abstract.aspx?file_no=19950103&flag=1
|

Figures(8)

 DownLoad: