Zhang Rongyan, Zhang Xiuzhi, Yang Xiaosheng, et al. Wind characteristics study in surface layer of typhoon Morakot (0908). J Appl Meteor Sci, 2012, 23(2): 184-194.
Citation: Zhang Rongyan, Zhang Xiuzhi, Yang Xiaosheng, et al. Wind characteristics study in surface layer of typhoon Morakot (0908). J Appl Meteor Sci, 2012, 23(2): 184-194.

Wind Characteristics Study in Surface Layer of Typhoon Morakot (0908)

  • Received Date: 2011-04-18
  • Rev Recd Date: 2012-01-09
  • Publish Date: 2012-04-30
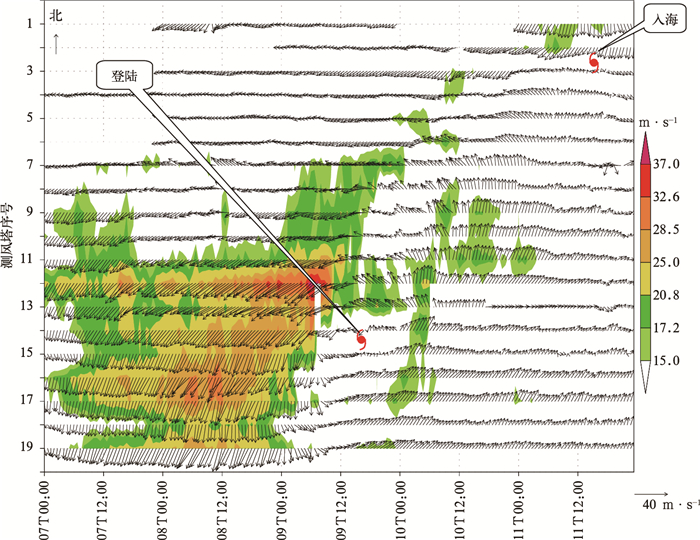
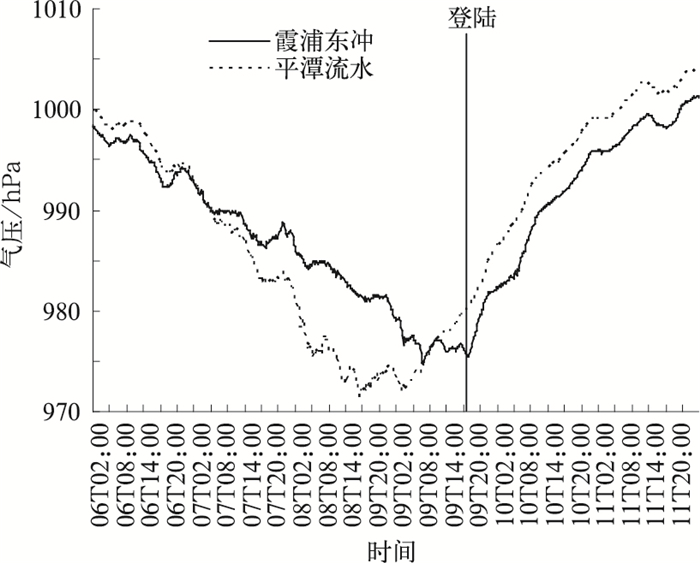
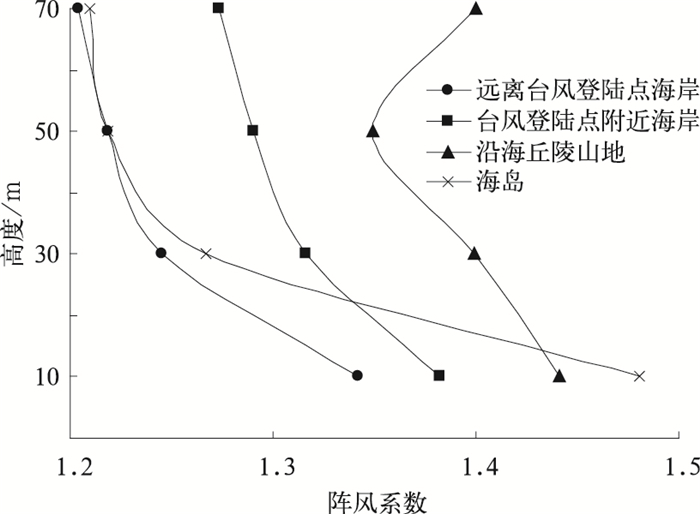
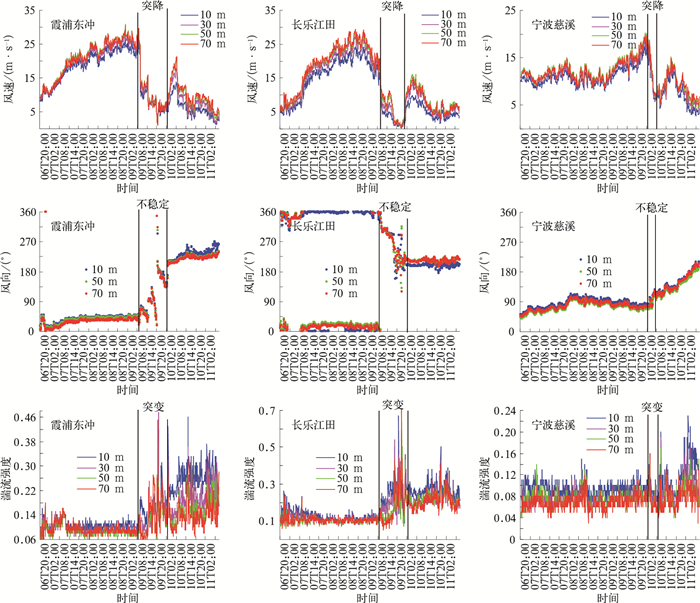
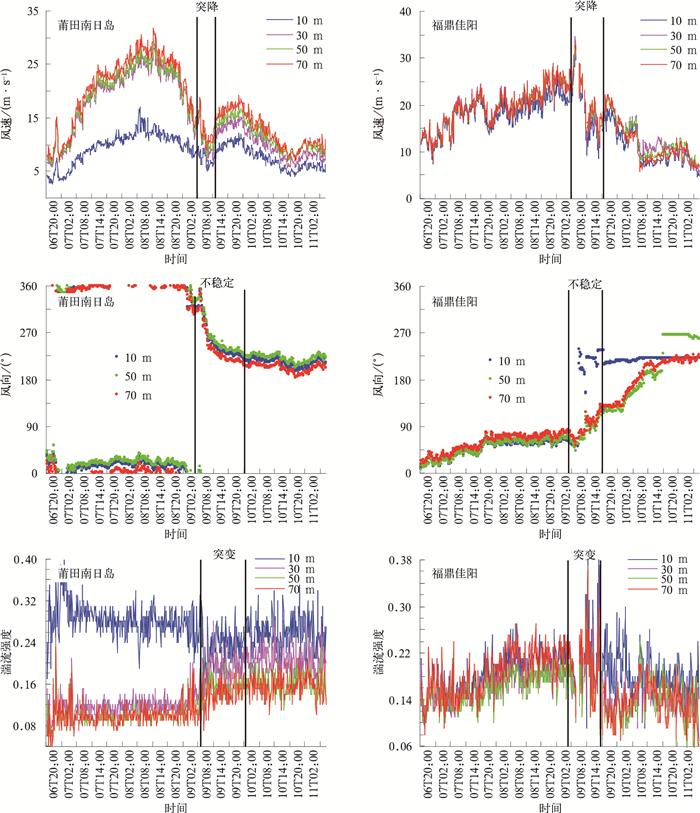
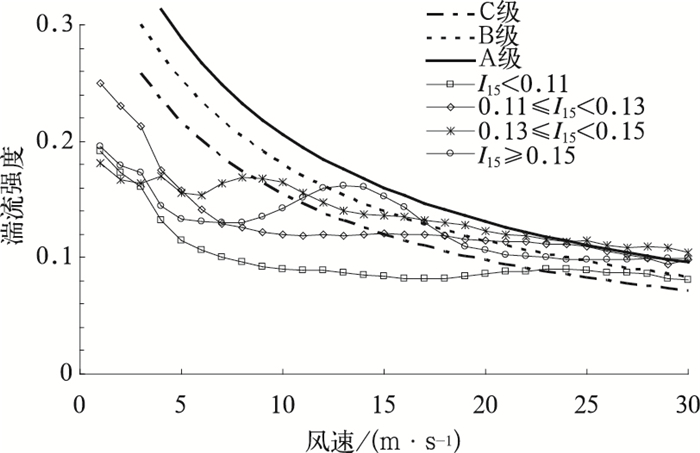
  • The observations from 33 anemometer tower within Typhoon Morakot (0908) affected area are analyzed. As the typhoon moves closer, the wind asymmetry becomes more apparent. Morakot has a counterclockwise shift of wind direction on the left flank, and a clockwise shift of wind direction on the other flank. Near the landing area, the wind reaches maximum and the direction is northerly before landing. When landing, the wind slows down, its direction rapidly changes and air pressure drops rapidly. Southerly gale appears when landing and northerly gale appears to the north of the location where it enters the sea.In the place far away from Morakot, wind direction is steady and the turbulence intensity changes are correspondingly stable. Its value is decided by sub-layer attribute, complex surface conditions lead to strong turbulence intensity.Near the landing area, the wind direction, the wind speed and the turbulence intensity may all changes suddenly. In the mountainous region, turbulence intensity change is most complex. Influenced by Morakot, the turbulence intensity curves do not look like the IEC standard curve which reduces stably along with the wind speed increasing. The turbulence intensity reaches a peak with wind speed of 7—17 m·s-1when I15achieves Level A, B or above. No matter southerlies or northerlies, each layer turbulence intensity difference tends to reduces with wind speed. Given the same wind speed and height, the turbulence intensity of southerly gale is bigger than that of the northerly gale. Turbulence intensity decreases first then increases with wind speed increasing at Morakot landing area northern flank, finally surpassing IEC the standard Level A curve. But to the south of landing location, turbulence intensity along with the wind speed changes much smaller than the north side and increases along with the wind speed, showing the standard Level A curve tendency. On the north side turbulence intensity is bigger than the south side and at each height the turbulence intensity difference reduces remarkably compared to south side. It indicates that the north side vertical direction the perturbation is stronger.Morakot gust coefficient is between 1.2 and 1.7. The average gust coefficient changes with height and regional terrain, and it also becomes larger when the typhoon center draws near. In general cases, the gust coefficient reduces with height. But over complex terrain especially the knoll mountainous region it reduces with height below 50 meters, and increases with height above 50 meters.
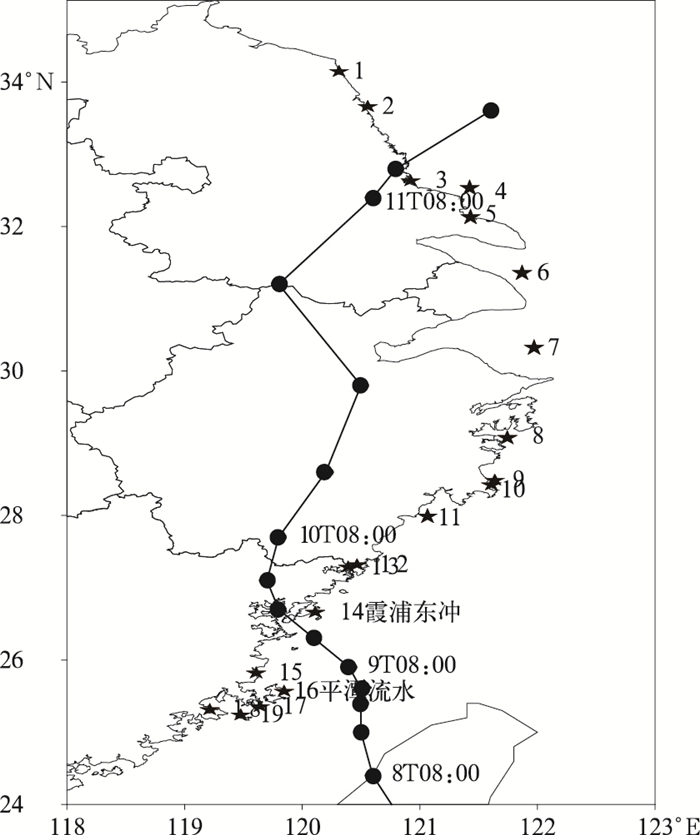
  • Fig. 1  Satellite cloud images on 8 Aug (a) and 9 Aug (b) in 2009

    Fig. 2  Observed wind fields by anemometer towers at 10-m height (purple dot) and weather stations (black circle) on 8 Aug (a), 9 Aug (b), 10 Aug (c) and 11 Aug (d) in 2009

    Fig. 3  Typhoon Morakot wind speed evolvement at 50-m height of anemometer towers in Aug 2009

    Fig. 4  Anemometer towers around track of Typhoon Morakot

    Fig. 5  The air pressure evolvement nearby Typhoon Morakot landing sites

    Fig. 6  Typhoon Morakot mean gust coefficient evolvement with height

    Fig. 7  The turbulence intensity, wind speed and wind direction of different anemometer towers located around Typhoon Morakot landing area

    Fig. 8  The turbulence intensity, wind speed and wind direction of anemometer towers at different terrain

    Fig. 9  Mean turbulence intensity of Typhoon Morakot along with wind speed at 50-m height

    Table  1  The information of anemometer towers near the track of Typhoon Morakot

    序号 地点 海拔/m 环境
    1 江苏盐城市滨海二罾 2 沿海沙滩
    2 江苏盐城市射阳东沙港 1 沿海沙滩
    3 江苏海安北凌垦区 2 沿海围垦区
    4 江苏如东县洋口港太阳人工岛 8 浅滩
    5 江苏通州市三余镇滨海工业区 1 滩涂
    6 上海崇明横沙岛 1 海岛
    7 浙江岱山大鱼山岛 60 海岛
    8 浙江宁海满山岛 28 海岛
    9 浙江台州市路桥区白果山 36 海岛
    10 浙江温岭 8 滩涂
    11 浙江洞头大门岛 347 海岛
    12 福建福鼎佳阳 776 丘陵山地
    13 浙江苍南鹤顶山 778 丘陵山地
    14 福建霞浦东冲 10 沿海沙滩
    15 福建长乐江田 7 沿海沙滩
    16 福建平潭流水 5 沿海沙滩
    17 福建福清东瀚 108 沿海小山
    18 福建莆田后温 5 沿海围垦区
    19 福建莆田南日 5 海岛沙滩荒地
    DownLoad: Download CSV
  • [1]
    贺德馨.风工程与工业空气动力学.近代空气动力学丛书.北京:国防工业出版社, 2006.
    [2]
    陈飞, 班欣, 祁欣, 等.连云港沿海地区及近海风能资源评估.气象科学, 2008, 28(增刊):101-106. http://www.cnki.com.cn/Article/CJFDTOTAL-QXKX2008S1018.htm
    [3]
    胡非, 洪钟祥, 雷孝恩.大气边界层和大气环境研究进展.大气科学, 2003, 27(4):712-728. http://www.cnki.com.cn/Article/CJFDTOTAL-DQXK200304017.htm
    [4]
    张宏升, 李富余, 陈家宜.不同下垫面湍流统计特征研究.高原气象, 2004, 23(5):598-604. http://www.cnki.com.cn/Article/CJFDTOTAL-GYQX200405004.htm
    [5]
    杨胜朋, 吕世华, 陈玉春, 等.山地复杂下垫面湍流特征观测分析.高原气象, 2008, 27(2):272-278. http://www.cnki.com.cn/Article/CJFDTOTAL-GYQX200802005.htm
    [6]
    全利红, 胡非, 王迎春.强天气过程中近地层风速的非线性动力学特征.气候与环境研究, 2007, 12(3):287-295. http://www.cnki.com.cn/Article/CJFDTOTAL-QHYH200703008.htm
    [7]
    程雪玲, 曾庆存, 胡非, 等.大气边界层强风的阵性和相干结构.气候与环境研究, 2007, 12(3):227-243. http://cpfd.cnki.com.cn/Article/CPFDTOTAL-AGLU201610001059.htm
    [8]
    赵德山, 王立治, 洪钟祥.冷锋过境时的边界层阵风结构分析.大气科学, 1982, 6(3):324-332. http://www.cnki.com.cn/Article/CJFDTOTAL-DQXK198203011.htm
    [9]
    宋丽莉, 吴战平, 秦鹏, 等.复杂地形近地层强风特性分析.气象学报, 2009, 67(3):452-460. doi:  10.11676/qxxb2009.045
    [10]
    李亚春, 武金岗, 谢志清, 等.不同强风样本湍流特性参数的计算分析.应用气象学报, 2008, 19(1):28-34. doi:  10.11898/1001-7313.20080105
    [11]
    邵德民, 端义宏, 张维. 上海地区大风风速剖面特性的观测和分析//中国土木工程学会. 第十一届全国结构风工程学术会议论文集. 2004: 87-90.
    [12]
    张光智, 徐祥德, 王继志, 等.采用外场观测试验资料对登陆台风"黄蜂"的风场及湍流特征的观测研究.应用气象学报, 2004, 15(增刊):110-115. http://kns.cnki.net/KCMS/detail/detail.aspx?filename=yyqx2004s1015&dbname=CJFD&dbcode=CJFQ
    [13]
    宋丽莉, 毛慧琴, 汤海燕, 等.广东沿海近地层大风特性的观测分析.热带气象学报, 2004, 20(6):731-736. http://www.cnki.com.cn/Article/CJFDTOTAL-RDQX20040600D.htm
    [14]
    宋丽莉, 毛慧琴, 黄浩辉, 等.登陆台风近地面层湍流特征观测分析.气象学报, 2005, 63(6):915-921. doi:  10.11676/qxxb2005.087
    [15]
    王承凯. 风场湍流强度的计算及其对风电机组选型的影响//中国电机工程学会. 2008年中国电机工程学会年会论文集. 2009: PN4-02.
    [16]
    Kogaki Tetsuya, Matsumiya Hikaru, Abe Hiroyuki, et al. Wind characteristics and wind models for wind turbine design in Japan.Journal of Environment and Engineering, 2009, 4(3):466-478. http://ci.nii.ac.jp/naid/110006402874
    [17]
    雷小途, 陈联寿.西北太平洋热带气旋活动的纬度分布特征.应用气象学报, 2002, 13(2):218-227. http://qikan.camscma.cn/jams/ch/reader/view_abstract.aspx?file_no=20020228&flag=1
    [18]
    郭丽霞, 陈联寿, 李英.登陆热带气旋入黄渤海强度变化的环境场特征.应用气象学报, 2010, 21(5):570-579. doi:  10.11898/1001-7313.20100506
    [19]
    胡邦辉, 谭言科, 王举.热带气旋海面最大风速半径的计算.应用气象学报, 2004, 15(4):427-435. http://qikan.camscma.cn/jams/ch/reader/view_abstract.aspx?file_no=20040452&flag=1
    [20]
    王建平, 李秀荣.GB18451.1—2001/IEC 61400-1:1999风力风电机组安全要求.北京:中国标准出版社, 2001.
    [21]
    International Electro-technical Commission (IEC). IEC 61400-1 Ed.3, Wind turbines-part 1: Design requirements, 2005.
  • 加载中
  • -->

Catalog

    Figures(9)  / Tables(1)

    Article views (3987) PDF downloads(1915) Cited by()
    • Received : 2011-04-18
    • Accepted : 2012-01-09
    • Published : 2012-04-30

    /

    DownLoad:  Full-Size Img  PowerPoint