Gong Zhiqiang, Wang Xiaojuan, Cui Donglin, et al. The identification and changing characteristics of regional low temperature extreme events. J Appl Meteor Sci, 2012, 23(2): 195-204.
Citation: Gong Zhiqiang, Wang Xiaojuan, Cui Donglin, et al. The identification and changing characteristics of regional low temperature extreme events. J Appl Meteor Sci, 2012, 23(2): 195-204.

The Identification and Changing Characteristics of Regional Low Temperature Extreme Events

  • Received Date: 2011-06-11
  • Rev Recd Date: 2012-01-31
  • Publish Date: 2012-04-30
  • When an extreme low temperature event occurs, it generally impacts a certain area and lasts for some time, which means that it is a regional extreme event. How to identify a regional extreme low temperature is the basis for studies in this area. An objective identification technique for regional low temperature extreme events (OITRLTE) is developed. This technique consists of four parts: Defining the threshold value of extreme low temperature for single station; identifying abnormality belts; distinguishing temporal continuous process of the event; an integrated index system. The index is specially developed based on the features of regional events, which includes 5 single indices: Extreme intensity, accumulated intensity, accumulated area, maximum impacted area and duration, as well as an integrated index. Case studies show that OITREE is skillful in identifying regional low temperature extreme events (RLTEs). It can objectively and automatically capture daily impacted areas of a regional event for its duration, and reasonably putting them in a "string" to shape an entire regional event. Then based on the winter daily minimum temperature from 1960 to 2009, spatial distribution and temporal changes of RLTEs is also investigated. Results show that probability distribution of lowest temperature and latitude of geometrical center of RLTEs both obey the two-peak distribution, and the center of RLTEs mainly locates at two belts of 32°N and 42°N. The annual accumulative value of the frequency, intensity and max covering area of RLTEs is decreasing, and during the end of 1980s this trend changes and the trend becomes stationary after 1990s. These characteristics might be caused by the RLTEs with long duration and wide space range that accounted for top 10% of all events. Considering the good correlation between RLTE indexes, economic loss and the number of stricken people on cold disasters, an integration index is defined based on RLTE indexes. The weighted coefficients of the first-grade integrated index are defined based on the correlation between the yearly cumulative value of first-grade index, the corresponding yearly index of economic losses and the number of stricken people on cold disasters. So, in this way the weight coefficients denote the correlation between regional low temperature extreme events and corresponding disaster losses to some extent.
  • Fig. 1  Information combination of temporal possible events and low temperature belts

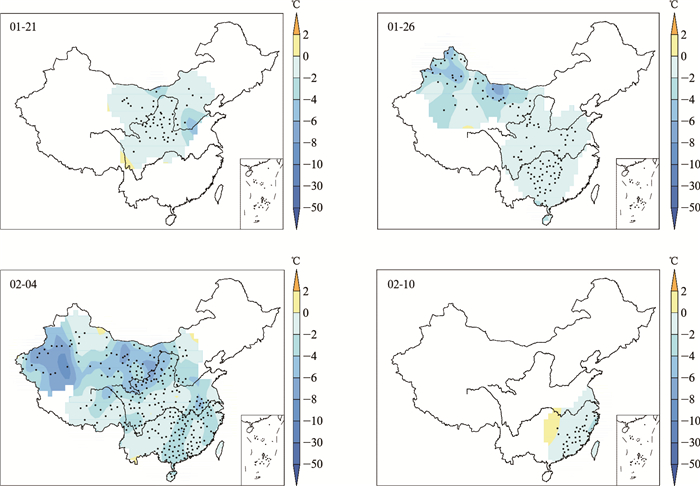
    Fig. 2  Daily station distribution of regional extreme low temperature event located at Northwest—South China from 21 Jan 2008

    (black point denotes the station of regional extreme low temperature events; shaded area denotes the daily difference between minimum temperature and threshold value of extreme low temperature, Ld)

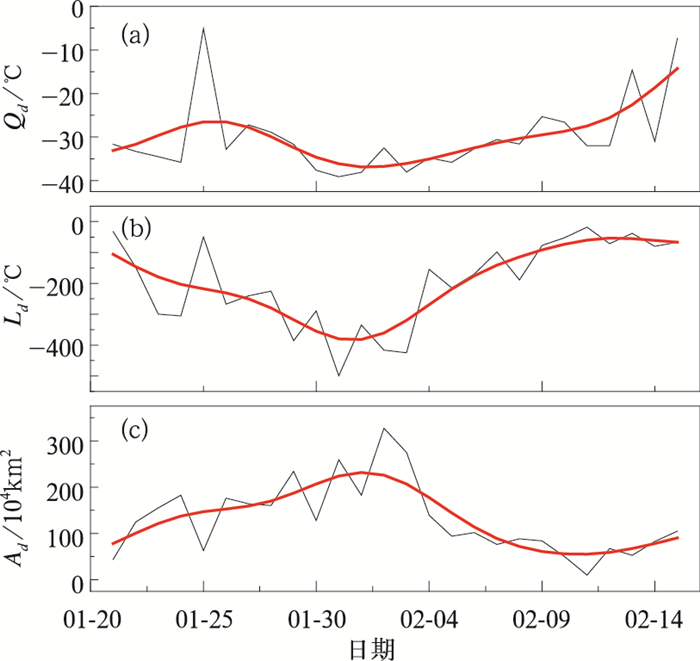
    Fig. 3  Daily change of index of regional low temperature extreme events located at Nouthwest—South China from 21 Jan 2008 to 16 Feb 2008

    (red line denotes 5-point moving smooth)

    Fig. 4  Station distribution of regional low temperature extreme events which started from 21 Jan 2008(a) and 30 Dec 2010(b), respectively (black point denotes the station of regional extreme low temperature events, and shaded area denotes the process accumulative anomalies between the minimum temperature and the threshold value of extreme low temperature, L)

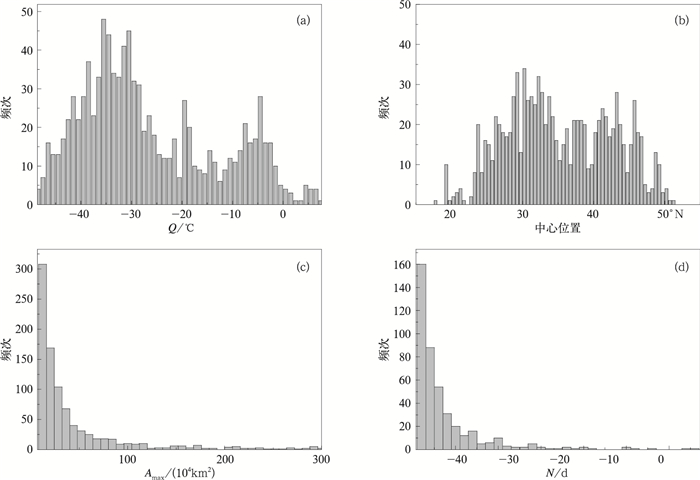
    Fig. 5  Probability distribution of main indexes of regional low temperature extreme events

    (a)Q, (b) location of geometrical center, (c)Amax, (d)N

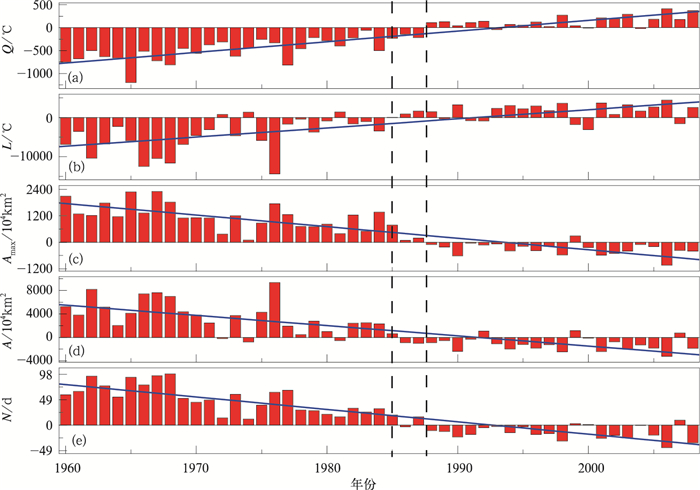
    Fig. 6  Annual change of main indexes of regional low temperature extreme events during 1960—2008 (a)Q, (b)L, (c)Amax, (d)A, (e)N

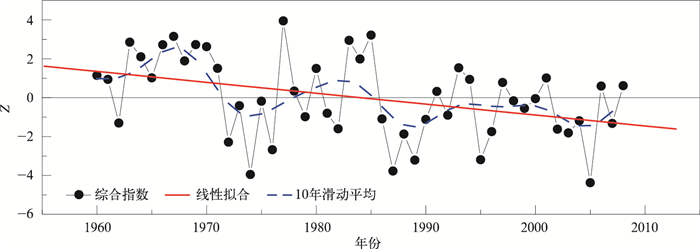
    Fig. 7  Annual change of integration index

    Table  1  Information of two regional low temperature extreme events

    实况开始时间结束时间极端
    强度/℃
    累积
    强度/℃
    累积覆盖
    面积/(104km2)
    持续
    天数/d
    中心位置
    2008年1月21日开始的西北—
    华南型区域性极端低温事件
    2008-01-212008-02-15-39.1-127524.07929.82632.98°N,
    106.02°E
    2010年12月31日开始的
    全国型区域性极端低温事件
    2010-12-302011-02-02-49.6-120463.09454.83535.38°N,
    109.30°E
    DownLoad: Download CSV

    Table  2  Correlation coefficients between annual accumulative values of different regional low temperature extreme event index and economic loss with the number of stricken people on cold disasters

    统计量QLANAmax
    经济损失的相关系数-0.57-0.540.500.610.65
    受灾人数的相关系数-0.47-0.350.250.580.43
    平均相关系数-0.52-0.450.380.600.54
    权重系数-0.21-0.180.150.240.22
    综合指数的相关系数-0.69-0.820.850.910.81
    DownLoad: Download CSV
  • [1]
    Karl T R, Kukla G, Razuvayev V N, et al. Global warming: Evidence for asymmetric diurnal temperature change. Geophy Rev Lett, 1991, 18: 2253-2256. doi:  10.1029/91GL02900
    [2]
    Klysik K, Fortuniak K. Temporal and spatial characteristics of the urban heat island of Lodz, Poland. Atmos Environ, 1999, 33: 3885-3895. doi:  10.1016/S1352-2310(99)00131-4
    [3]
    Easterling D R, Evans J L, Groisman P, et al. Observed variability and trends in extreme climate events: A brief review. Bull Amer Meteor Soc, 2000, 81(3): 417-425. doi:  10.1175/1520-0477(2000)081<0417:OVATIE>2.3.CO;2
    [4]
    Katz R W, Browns B G. Extreme events in a changing climate: Variability is more important than average. Climatic Change, 1992, 21: 289-302. doi:  10.1007/BF00139728
    [5]
    张勇, 曹丽娟, 许吟隆, 等.未来我国极端温度事件变化情景分析.应用气象学报, 2008, 19(6): 656-660. http://qikan.camscma.cn/jams/ch/reader/view_abstract.aspx?file_no=20080603&flag=1
    [6]
    封国林, 董文杰, 龚志强, 等.观测数据的时空非线性分布理论和方法.北京:气象出版社, 2006: 1-227.
    [7]
    封国林, 龚志强, 支蓉, 等.气候变化检测技与诊断技术的若干新进展.气象学报, 2009, 66(6): 892-905. http://www.cnki.com.cn/Article/CJFDTOTAL-QXXB200806006.htm
    [8]
    翟盘茂, 潘晓华.中国北方近50年温度和降水极端事件变化研究.地理学报, 2003, 58(增刊): 1-10. http://www.cnki.com.cn/Article/CJFDTOTAL-DLXB2003S1000.htm
    [9]
    李庆祥, 黄嘉佑.对我国极端高温事件阈值的探讨.应用气象学报, 2011, 22(2): 138-143. http://qikan.camscma.cn/jams/ch/reader/view_abstract.aspx?file_no=20110202&flag=1
    [10]
    任国玉, 封国林, 严中伟.中国极端气候变化观测研究回顾与展望.气候与环境研究, 2010, 15(4): 337-353. http://www.cnki.com.cn/Article/CJFDTOTAL-QHYH201004003.htm
    [11]
    Zhang D Q, Hou W, Feng G L, et al. The Relationship Between Spatial Extent and Duration of Severe Droughts in China over the Last 50 Years. 2010 Second IITA Conference on Geoscience and Remote Sensing, 2010, 2: 345-348.
    [12]
    Zhang Z J, Qian W H. Databases on regional extreme low temperature events in China. Adv Atmos Sci, 2011, 28(2): 338-351. doi:  10.1007/s00376-010-0048-6
    [13]
    杨萍, 封国林, 刘伟东, 等.空间点过程理论在极端气候事件中的应用研究.应用气象学报, 2010, 21(3): 352-359. http://qikan.camscma.cn/jams/ch/reader/view_abstract.aspx?file_no=20100311&flag=1
    [14]
    任福民, Gleason B, Easterling D.一种识别热带气旋降水的数值方法.热带气象学报, 2001, 17(3): 308-313. http://www.cnki.com.cn/Article/CJFDTOTAL-RDQX200103014.htm
    [15]
    任福民, 崔冬林, 王艳皎, 等. 客观识别区域持续性极端事件的探索研究//中国气象局气候研究开放实验室2009年度学术年会论文. 北京: 气象出版社, 2009: 52-54.
    [16]
    Bonsal B R, Zhang X B, Vincent L A. Characteristics of daily and extreme temperature over Canada. J Climate, 2001, 5(14): 1959-1976. http://www.nrcresearchpress.com/servlet/linkout?suffix=refg41/ref41&dbid=16&doi=10.1139%2Fer-2013-0042&key=10.1175%2F1520-0442(2001)014<1959%3ACODAET>2.0.CO%3B2
    [17]
    韩荣青, 陈丽娟, 李维京, 等. 2—5月我国低温连阴雨和南方冷害时空特征.应用气象学报, 2009, 20(3): 312-320. http://qikan.camscma.cn/jams/ch/reader/view_abstract.aspx?file_no=20090307&flag=1
    [18]
    Bak P, Tang C, Wiesenfel K J. How nature works: The science of self-organized criticality. J Appl Meteorol, 1990, 29: 1167-1170. doi:  10.1175/1520-0450(1990)029<1167:FRARDO>2.0.CO;2
    [19]
    Frich P, Alexander L V, Della-Marta P, et al. Observed coherent changes in climatic extremes during the second half of the twentieth century. Climate Res, 2002, 19: 193-212. doi:  10.3354/cr019193
    [20]
    Gutenberg B, Richer C F. Frequency of earthquakes in California. Nature, 1945, 156: 371-371. http://adsabs.harvard.edu/abs/1945Natur.156..371.
    [21]
    Zhi Rong, Feng G L, Gong Z Q, et al. Spatio-temporal correlation analysis of global temperature dataset based on the correlation matrix theory. Acta Meteor Sinica, 2010, 24(2): 150-162. https://www.researchgate.net/publication/287698480_Spatio-Temporal_Correlation_Analysis_of_Global_Temperature_Based_on_the_Correlation_Matrix_Theory
    [22]
    龚志强, 支蓉, 封国林, 等.中国近530年干湿变化及其持续性特征研究.气象学报, 2009, 67(2): 307-320. doi:  10.11676/qxxb2009.031
    [23]
    龚志强, 周磊, 支蓉, 等. 1-30 d尺度温度关联网动力学统计性质研究.物理学报, 2008, 57(8): 5351-5360. doi:  10.7498/aps.57.5351
    [24]
    龚志强, 王晓娟, 封国林, 等.中国近58年温度极端事件的区域特征及其与气候突变的联系.物理学报, 2009, 58(6): 741-752. http://www.cnki.com.cn/Article/CJFDTOTAL-WLXB200906115.htm
    [25]
    周自江, 王颖.中国近46年冬季气温序列变化的研究.南京气象学院学报, 2000, 23(1): 106-112. http://www.cnki.com.cn/Article/CJFDTOTAL-NJQX200001016.htm
    [26]
    钱忠华, 封国林, 龚志强.中国夏冬两季最概然温度分布及其增温趋势减缓.物理学报, 2010, 59(10):7490-7499. http://www.cnki.com.cn/Article/CJFDTOTAL-WLXB201010122.htm
    [27]
    陈少勇, 郭忠祥, 高蓉, 等.我国东部季风区冬季气温的气候变暖特征.应用气象学报, 2009, 20(4): 478-485. http://qikan.camscma.cn/jams/ch/reader/view_abstract.aspx?file_no=200904013&flag=1
    [28]
    王晓娟, 龚志强, 周磊, 等.温度关联网络稳定性分析Ⅰ——极端事件的影响.物理学报, 2009, 58(9):6651-6658. doi:  10.7498/aps.58.6651
  • 加载中
  • -->

Catalog

    Figures(7)  / Tables(2)

    Article views (4675) PDF downloads(1895) Cited by()
    • Received : 2011-06-11
    • Accepted : 2012-01-31
    • Published : 2012-04-30

    /

    DownLoad:  Full-Size Img  PowerPoint