
| 层次 | 第1次 | 第2次 | ||
| 飞机探测 | 数值模拟 | 飞机探测 | 数值模拟 | |
| 0℃层 | 3075~3102 m | 3100 m附近 | 2981~3130 m | 3100 m附近 |
| -5℃层 | 4234~4337 m | 4300 m附近 | 4503~4565 m | 4500 m附近 |
| -10℃层 | 5600~5633 m | 5600 m附近 | 5750~5782 m | 5600 m附近 |
| Citation: | Li Junxia, Li Peiren, Tao Yue, et al. Numerical simulation and flight observation of stratiform precipitation clouds in spring of Shanxi Province. J Appl Meteor Sci, 2014, 25(1): 22-32.

|
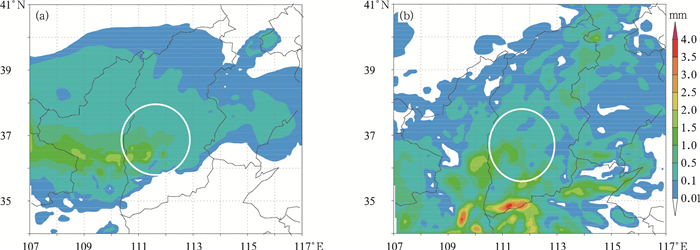
Fig. 1 Vertical integrated water distribution at 0900 BT (a) and 2000 BT (b) on 20 April 2010
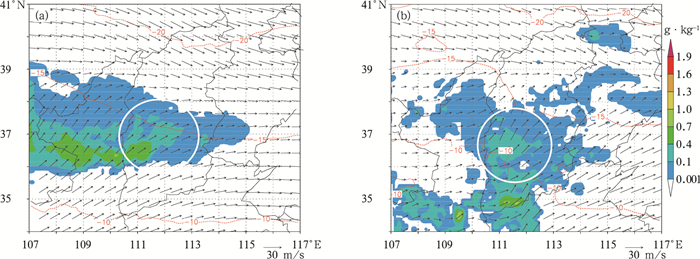
Fig. 2 500 hPa cloud water distribution (shaded) at 0900 BT (a) and 2000 BT (b) on 20 April 2010
(red isoline denotes temperature, unit:℃)
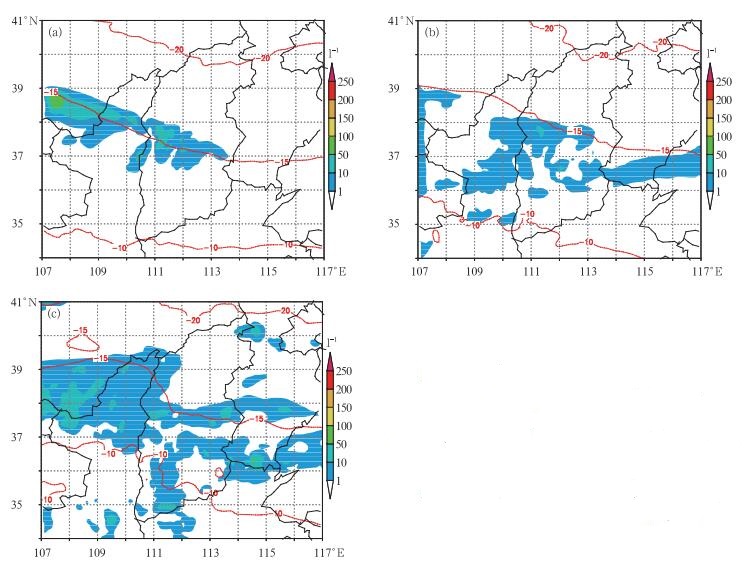
Fig. 3 The number concentration distribution (shaded) of 500 hPa ice crystals at 0900 BT (a), 1200 BT (b) and 2000 BT (c) on 20 April 2010
(red isoline denotes temperature, unit:℃)

Fig. 4 Vertical distribution of hydrometeors over Fenyang Station of Shanxi Province at 1200 BT (a), 1500 BT (b), 1600 BT (c), 1800 BT (d) on 20 April 2010
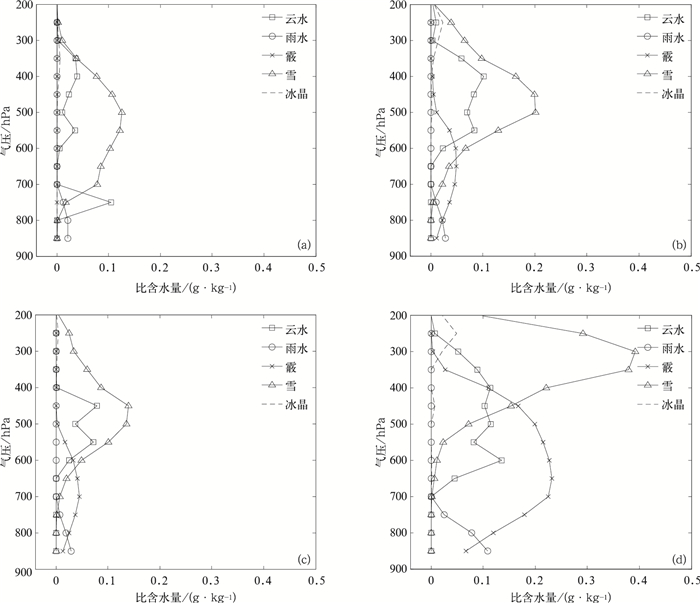
Fig. 5 Vertical distribution of hydrometeors of Wenshui Station at 1200 BT (a), 1500 BT (b), 1700 BT (c), 2100 BT (d) on 20 April 2010

Fig. 6 Cloud particle images of CIP (a) and raindrop particle images of PIP (b) during the first flight on 20 April 2010
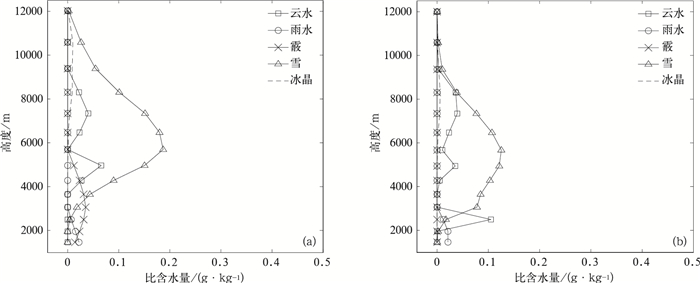
Fig. 7 Simulated vertical distribution of the hydrometeors at 1100 BT over Fenyang Station (a) and 1200 BT over Wenshui Station (b) on 20 April 2010
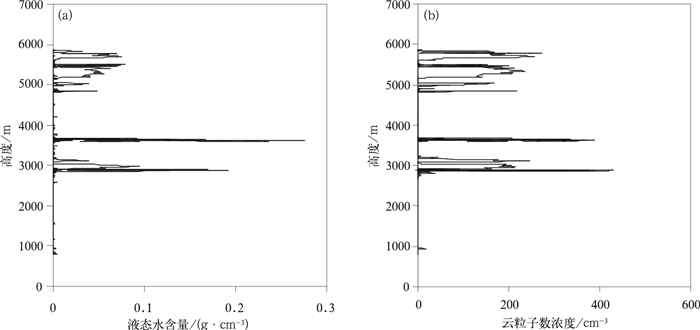
Fig. 8 Vertical distribution of the CDP-LWC (a) and the number concentration of cloud particles (b) during the first flight on 20 April 2010
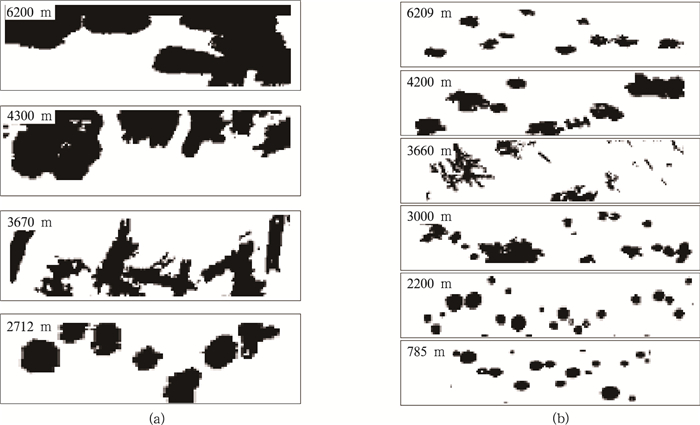
Fig. 9 Cloud particle images of CIP (a) and raindrop particle images of PIP (b) during the second flight on 20 April 2010
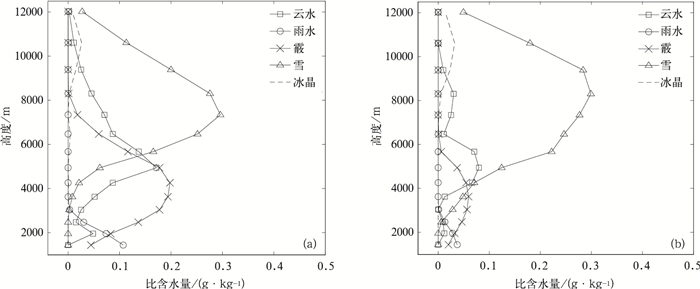
Fig. 10 Simulated vertical distribution of hydrometeors over Fenyang Station at 1600 BT (a) and 1700 BT (b) on 20 April 2010
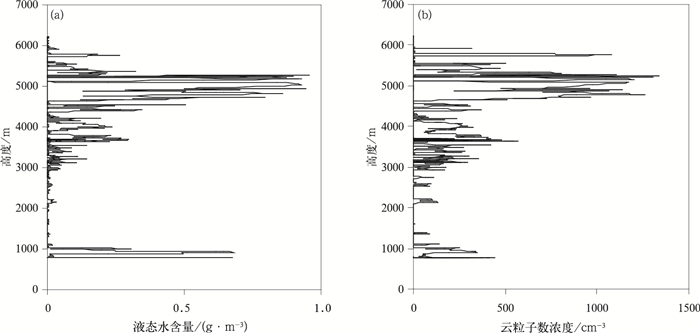
Fig. 11 Vertical distribution of the CDP-LWC (a) and the number concentration of cloud particles (b) during the second flight on 20 April 2010
Table 1 The temperature and height contrast references of the two-flight detections and numerical simulation on 20 April 2010
| 层次 | 第1次 | 第2次 | ||
| 飞机探测 | 数值模拟 | 飞机探测 | 数值模拟 | |
| 0℃层 | 3075~3102 m | 3100 m附近 | 2981~3130 m | 3100 m附近 |
| -5℃层 | 4234~4337 m | 4300 m附近 | 4503~4565 m | 4500 m附近 |
| -10℃层 | 5600~5633 m | 5600 m附近 | 5750~5782 m | 5600 m附近 |
 DownLoad: Download CSV
| [1] |
顾震潮.云雾降水物理基础.北京:科学出版社, 1980.
|
| [2] |
胡志晋.层状云人工增雨机制、条件和方法的探讨.应用气象学报, 2001, 12(增刊):10-13. http://www.cnki.com.cn/Article/CJFDTOTAL-YYQX2001S1001.htm
|
| [3] |
洪延超, 周非非."催化供给"云降水形成机理的数值模拟研究.大气科学, 2005, 29(6):885-896. http://www.cnki.com.cn/Article/CJFDTOTAL-DQXK200506004.htm
|
| [4] |
史月琴, 楼小凤, 邓雪娇, 等.华南冷锋云系的中尺度和微物理特征模拟分析.大气科学, 2008, 32(5):1019-1036. http://www.cnki.com.cn/Article/CJFDTOTAL-DQXK200805002.htm
|
| [5] |
孙晶, 楼小凤, 胡志晋, 等.CAMS复杂云微物理方案与GRAPES模式耦合的数值试验.应用气象学报, 2008, 19(3):315-325. doi: 10.11898/1001-7313.20080307
|
| [6] |
胡志晋.关于空中水资源和人工增雨潜力的估算问题.人工影响天气, 1999, 12:53-55.
|
| [7] |
洪延超, 周非非.层状云系人工增雨潜力评估研究.大气科学, 2006, 30(5):913-926. http://www.cnki.com.cn/Article/CJFDTOTAL-DQXK200605019.htm
|
| [8] |
陈秋萍, 曾光平, 冯宏芳, 等.对流云总降水量和降水效率估测.应用气象学报, 2005, 16(2):260-263. doi: 10.11898/1001-7313.20050232
|
| [9] |
陈万奎, 严采蘩.冰相雨胚转化水汽密度差的实验研究.应用气象学报, 2001, 12(增刊):23-29. http://www.cnki.com.cn/Article/CJFDTOTAL-YYQX2001S1003.htm
|
| [10] |
陈文选, 王俊, 刘文, 等.一次冷涡过程降水的微物理机制分析.应用气象学报, 1999, 10(2):190-198. http://qikan.camscma.cn/jams/ch/reader/view_abstract.aspx?file_no=19990258&flag=1
|
| [11] |
汪学林, 秦元明, 吴宪君, 等.层状云中对流泡特征及其在降水场中的作用.应用气象学报, 2001, 12(增刊):146-150. http://www.cnki.com.cn/Article/CJFDTOTAL-YYQX2001S1018.htm
|
| [12] |
雷恒池, 魏重, 沈志来, 等.微波辐射计探测降雨前水汽和云液水.应用气象学报, 2001, 12(增刊):73-79. http://www.cnki.com.cn/Article/CJFDTOTAL-YYQX2001S1009.htm
|
| [13] |
李宏宇, 马建立, 马永林, 等.北京2008年奥运会开幕日云、降水特征及人工影响天气作业分析.气候与环境研究, 2011, 16(2):175-187. http://www.cnki.com.cn/Article/CJFDTOTAL-QHYH201102008.htm
|
| [14] |
陶玥, 洪延超.霰粒子下落速度对云系及降水发展影响的数值研究.气象学报, 2009, 67(3):370-381. doi: 10.11676/qxxb2009.036
|
| [15] |
何观芳, 胡志晋.不同云底温度雹云成雹机制及其引晶催化的数值研究.气象学报, 1998, 56(1):31-45. doi: 10.11676/qxxb1998.003
|
| [16] |
李宏宇, 王华, 洪延超.锋面云系降水中的增雨潜力数值研究.大气科学, 2006, 30(2):341-350. http://www.cnki.com.cn/Article/CJFDTOTAL-DQXK200602015.htm
|
| [17] |
胡志晋, 楼小凤, 刘奇俊, 等. 显式云与降水模式//CAMS大气数值预报模式系统研究. 北京: 气象出版社, 2004.
|
| [18] |
孙晶, 楼小凤, 胡志晋, 等.梅雨暴雨对流系统的中小尺度结构特征个例模拟分析.大气科学, 2007, 31(1):1-18. http://cpfd.cnki.com.cn/Article/CPFDTOTAL-ZGQX200510001293.htm
|

Figures(11) / Tables(1)
