| 时段 | 气温 | 地表温度 | 板温 | |||
| 平均值 | 标准差 | 平均值 | 标准差 | 平均值 | 标准差 | |
| 春季 | 13.82 | 8.98 | 21.10 | 13.99 | 20.40 | 12.50 |
| 夏季 | 27.44 | 4.52 | 33.54 | 10.51 | 33.68 | 9.64 |
| 秋季 | 14.34 | 8.21 | 16.55 | 10.43 | 22.55 | 13.12 |
| 冬季 | -0.83 | 5.51 | 2.72 | 8.07 | 6.96 | 10.42 |
| 全年 | 14.65 | 12.22 | 19.74 | 15.67 | 21.73 | 14.84 |
| Citation: | Pan Jinjun, Shen Yanbo, Bian Zeqiang, et al. Effects of meteorological elements on solar cell temperature. J Appl Meteor Sci, 2014, 25(2): 150-157.

|
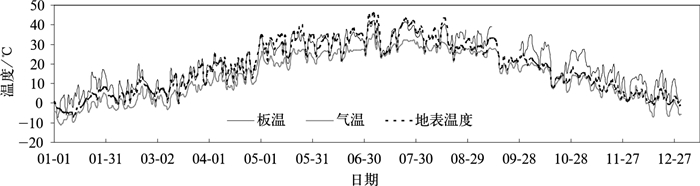
Fig. 1 Variation of daytime average solar cell temperature, air temperature and ground temperature in 2010 at experiment station

Fig. 2 Diurnal variation of solar cell temperature, air temperature and ground temperature of typical days in 2010 at experiment station

Fig. 3 Correlation of the difference between solar cell temperature and air temperature to solar irradiance (a) slope solar irradiance, (b) horizontal solar irradiance
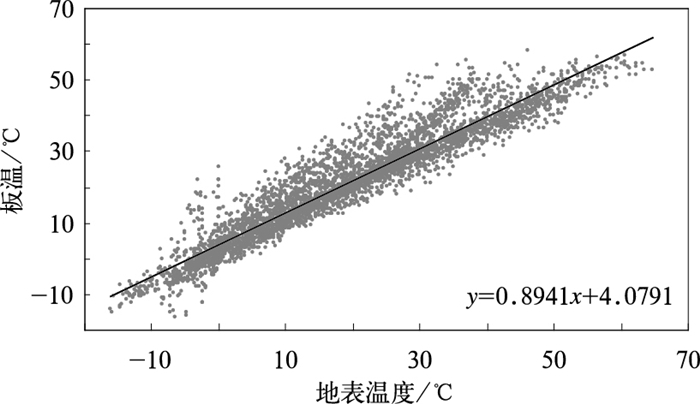
Fig. 4 Correlation between solar cell temperature and ground temperature
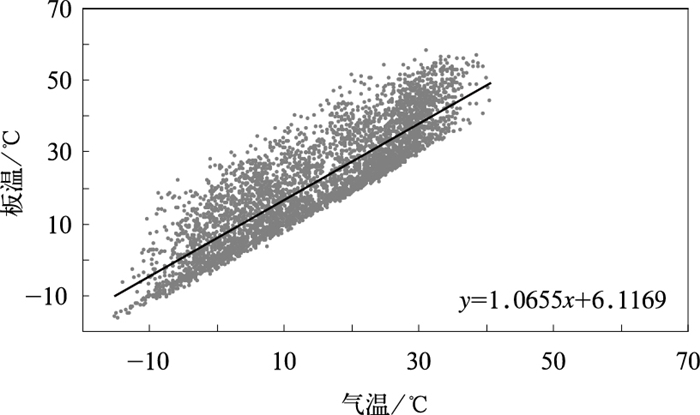
Fig. 5 Correlation between solar cell temperature and air temperature

Fig. 6 Correlation of the difference between solar cell temperature and air temperature to horizontal solar irradiance, when air temperature higher than 35℃
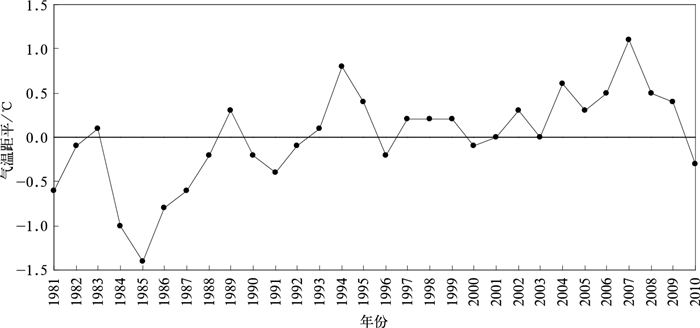
Fig. 7 Variation of air temperature anomaly at Beijing Weather Observatory during 1981—2010
Table 1 Statistics of daytime solar cell temperature, air temperature and ground temperature in 2010 at experiment station (unit:℃)
| 时段 | 气温 | 地表温度 | 板温 | |||
| 平均值 | 标准差 | 平均值 | 标准差 | 平均值 | 标准差 | |
| 春季 | 13.82 | 8.98 | 21.10 | 13.99 | 20.40 | 12.50 |
| 夏季 | 27.44 | 4.52 | 33.54 | 10.51 | 33.68 | 9.64 |
| 秋季 | 14.34 | 8.21 | 16.55 | 10.43 | 22.55 | 13.12 |
| 冬季 | -0.83 | 5.51 | 2.72 | 8.07 | 6.96 | 10.42 |
| 全年 | 14.65 | 12.22 | 19.74 | 15.67 | 21.73 | 14.84 |
 DownLoad: Download CSV
Table 2 Weather conditions of typical daytime in 2010 at experiment station
| 日期 | 天气状况 | 平均总云量/% | 14:00能见度/km | 平均风速/(m·s-1) |
| 01-08 | 阴天、有雾霾 | 100 | 12 | 0.9 |
| 04-08 | 多云 | 90 | 20 | 3.8 |
| 07-08 | 晴间多云 | 53 | 30 | 1.4 |
| 10-08 | 晴间多云、有雾霾 | 43 | 8 | 2.1 |
DownLoad: Download CSV
Table 3 Comparison of calculated Tcell with observed Tcell in Aug, Sep and Oct of 2009 with their correlation coefficients
| 板温 | 8月 | 9月 | 10月 | 相关系数 | ||||||
| 平均值/℃ | 最低值/℃ | 最高值/℃ | 平均值/℃ | 最低值/℃ | 最高值/℃ | 平均值/℃ | 最低值/℃ | 最高值/℃ | ||
| 实测值 | 33.7 | 13.5 | 57.8 | 28.6 | 10.5 | 54.5 | 25.8 | 3.6 | 50.1 | |
| 式 (6) 推算 | 34.9 | 22.4 | 45.1 | 30.0 | 18.4 | 38.0 | 24.9 | 10.7 | 36.6 | 0.858 |
| 式 (5) 推算 | 30.6 | 16.5 | 42.2 | 28.3 | 11.6 | 48.5 | 24.9 | 5.7 | 42.3 | 0.958 |
| 式 (4) 推算 | 34.0 | 16.1 | 55.2 | 28.4 | 12.2 | 46.9 | 24.2 | 5.3 | 43.9 | 0.968 |
| 式 (3) 推算 | 33.3 | 15.8 | 56.4 | 28.5 | 11.8 | 51.1 | 26.0 | 5.3 | 50.1 | 0.974 |
DownLoad: Download CSV
Table 4 Statistic of hourly real-time solar cell temperature at daytime in 2010 of experiment station
| 平均值 | 最高值 | 最低值 | 白天时数 | 大于25℃时数 | 大于25℃的平均温度 |
| 21.73℃ | 58.27℃ | -16.32℃ | 4222 h | 1787 h | 35.77℃ |
DownLoad: Download CSV
| [1] |
杨金焕.太阳能光伏发电应用技术.北京:电子工业出版社, 2009.
|
| [2] |
Wenham S R, Green M A, Watt M E, 等. 应用光伏学. 狄大卫, 高兆利, 韩见殊, 等译. 上海: 上海交通大学出版社, 2008.
|
| [3] |
Roger A M, Jerry V. 光伏系统工程: 第3版. 王一波, 廖华, 伍春生, 译. 北京: 机械工业出版社, 2012.
|
| [4] |
杨萍, 刘伟东, 王启光, 等.近40年我国极端温度变化趋势和季节特征.应用气象学报, 2010, 21(1):29-36. doi: 10.11898/1001-7313.20100104
|
| [5] |
于淑秋.近50年我国日平均温度的气候变化.应用气象学报, 2005, 16(6):787-793. doi: 10.11898/1001-7313.20050603
|
| [6] |
周国华, 王盘兴, 罗小莉, 等.基于160站资料的我国表面气温异常特征.应用气象学报, 2011, 22(3):283-291. doi: 10.11898/1001-7313.20110304
|
| [7] |
周云, 钱忠华, 何文平, 等.我国夏季高温极值的概率分布特征及其演变.应用气象学报, 2011, 22(2):145-151. doi: 10.11898/1001-7313.20110203
|
| [8] |
董立新, 杨虎, 张鹏, 等.FY-3A陆表温度反演及高温天气过程动态监测.应用气象学报, 2012, 23(2):214-222. doi: 10.11898/1001-7313.20120210
|
| [9] |
中国气象局.地面气象观测规范.北京:气象出版社, 2003.
|
| [10] |
李维京, 李怡, 陈丽娟, 等.我国冬季气温与影响因子关系的年代际变化.应用气象学报, 2013, 24(4):385-396. doi: 10.11898/1001-7313.20130401
|
| [11] |
Ross R G Jnr, Smokler M I.Flat-Plate Solar Array Project-Final Report, Vol.Ⅵ: Engineering Sciences and Reliability.JPL Pub No.86-31, 1986.
|
| [12] |
李耀宁, 李艳, 李珊珊.地温观测常见问题及报表数据处理方法.气象科技, 2011(3): 348-351. http://www.cnki.com.cn/Article/CJFDTOTAL-QXKJ201103016.htm
|
| [13] |
张慧智, 史学正, 于东升, 等.中国土壤温度的空间插值方法比较.地理研究, 2008, 27(6):1299-1307. http://www.cnki.com.cn/Article/CJFDTOTAL-DLYJ200806009.htm
|
| [14] |
邵全琴, 孙朝阳, 刘纪远, 等.中国城市扩展对气温观测的影响及其高估程度.地理学报, 2009, 64(11):1292-1302. doi: 10.3321/j.issn:0375-5444.2009.11.002
|
| [15] |
马柱国, 符淙斌, 任小波, 等.中国北方年极端温度的变化趋势与区域增暖的联系.地理学报, 2003, 58(增刊):11-20. http://www.cnki.com.cn/Article/CJFDTOTAL-DLXB2003S1001.htm
|

Figures(7) / Tables(4)
