| 位置 | 中部 | 北部 | 东部 | 南部 | 西部 | ||
| 那曲县 | 安多县 | 索县 | 比如县 | 嘉黎县 | 班戈县 | 申扎县 | |
| 年平均雷暴日数/d | 78 | 72 | 82 | 45 | 53 | 67 | 65 |
| Citation: | Yang Mei, Danzeng Gelie, Dawa Zeren, et al. The trend and distribution of thunderstorm activity and influencing factors in Nagqu prefecture. J Appl Meteor Sci, 2014, 25(6): 751-760.

|
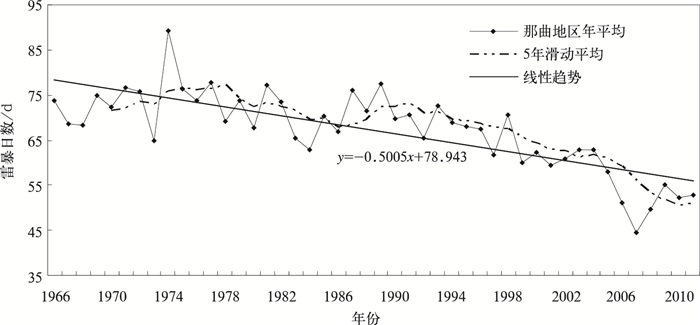
Fig. 1 Changes of the number of annual mean thunderstorm days in Nagqu Prefecture from 1966 to 2011
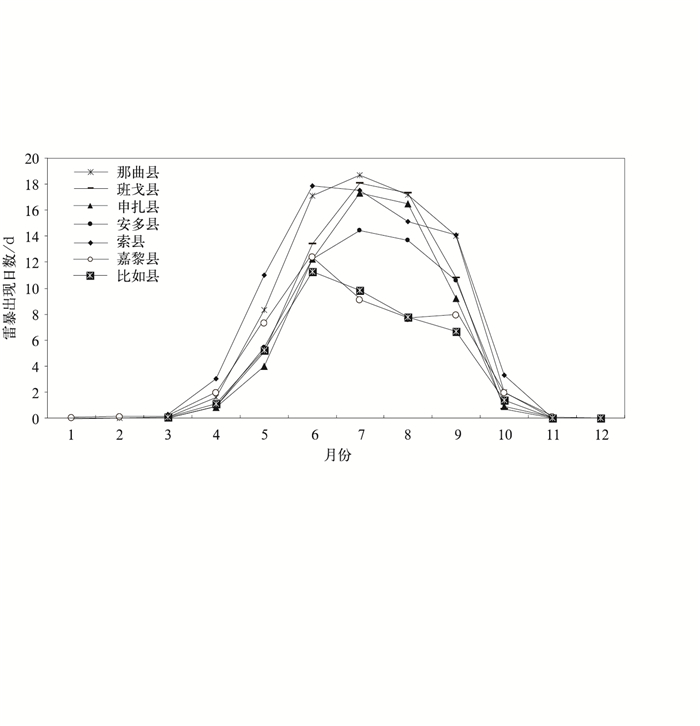
Fig. 2 The number of mean thunderstorm days in Nagqu Prefecture
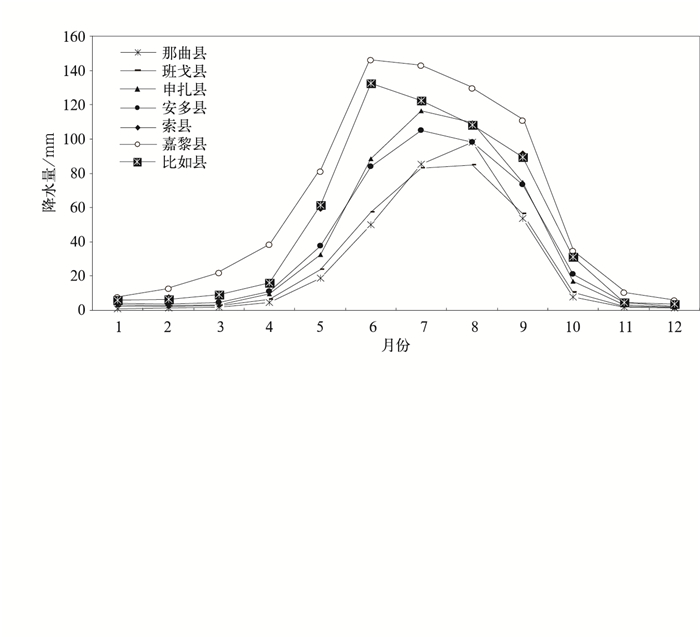
Fig. 3 The mean monthly precipitation in Nagqu Prefecture
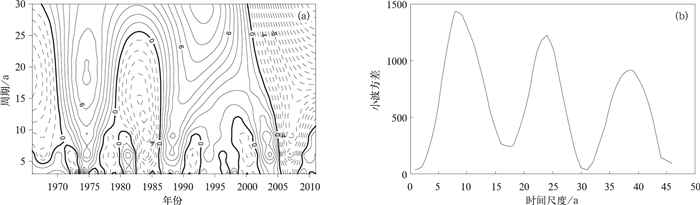
Fig. 4 A wavelet analysis (a) and a wavelet variance analysis (b) of the number of mean annual thunderstorm days in Nagqu Prefecture

Fig. 5 Annual changes in the number of thunderstorm days in Nagqu Prefecture during May-September from 1966 to 2011
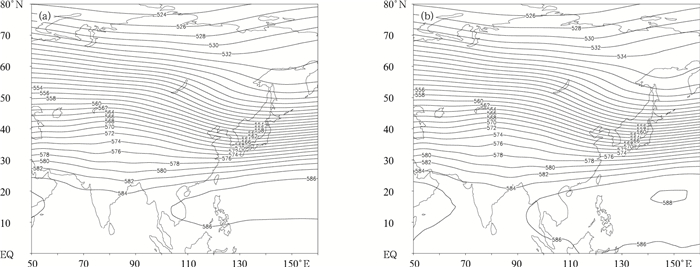
Fig. 6 500 hPa mean height field
(unit:dagpm) (a)1966-1998, (b)1999-2011
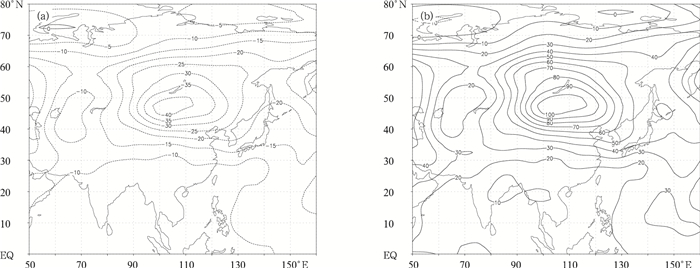
Fig. 7 500 hPa anomalies in mean height fields
(unit:dagpm) (a)1966-1998, (b)1999-2011

Fig. 8 100 hPa anomalies in mean height fields
(unit:dagpm) (a)1966—1998, (b)1999—2011
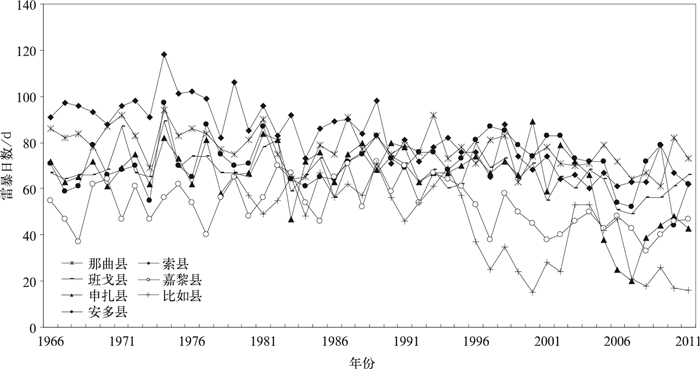
Fig. 9 The number of mean thunderstorm days in Nagqu Prefecture from 1966 to 2011
Table 1 The mean number of thunderstorm days for Nagqu Prefecture from 1966 to 2011
| 位置 | 中部 | 北部 | 东部 | 南部 | 西部 | ||
| 那曲县 | 安多县 | 索县 | 比如县 | 嘉黎县 | 班戈县 | 申扎县 | |
| 年平均雷暴日数/d | 78 | 72 | 82 | 45 | 53 | 67 | 65 |
 DownLoad: Download CSV
Table 2 Statistics on the monthly starting and ending dates of thunderstorm events in Nagqu Prefecture from 1966 to 2011
| 月份 | 那曲县 | 安多县 | 索县 | 比如县 | 嘉黎县 | 班戈县 | 申扎县 | |||||||
| 初日 | 终日 | 初日 | 终日 | 初日 | 终日 | 初日 | 终日 | 初日 | 终日 | 初日 | 终日 | 初日 | 终日 | |
| 1 | 1 | |||||||||||||
| 2 | 1 | 3 | ||||||||||||
| 3 | 3 | 2 | 13 | 4 | 5 | 2 | ||||||||
| 4 | 27 | 25 | 28 | 20 | 31 | 23 | 26 | |||||||
| 5 | 15 | 19 | 5 | 8 | 6 | 21 | 20 | |||||||
| 9 | 8 | 12 | 3 | 8 | 6 | 26 | 22 | |||||||
| 10 | 36 | 33 | 41 | 23 | 33 | 19 | 22 | |||||||
| 11 | 2 | 2 | 1 | 7 | 1 | 1 | ||||||||
| 12 | 1 | 1 | ||||||||||||
DownLoad: Download CSV
| [1] |
张鸿发, 郭三刚, 张义军, 等.青藏高原强对流分布特征.高原气象, 2003, 22(6):558-564. http://www.cnki.com.cn/Article/CJFDTOTAL-GYQX200306005.htm
|
| [2] |
张翠华, 言穆弘, 董万胜, 等.青藏高原雷暴天气层结特征分析.高原气象, 2005, 24(5):741-747. http://www.cnki.com.cn/Article/CJFDTOTAL-GYQX200505012.htm
|
| [3] |
尤为, 臧增亮, 潘晓滨, 等.夏季青藏高原雷暴天气及其天气学特征的统计分析.高原气象, 2012, 31(6):1523-1529. http://www.cnki.com.cn/Article/CJFDTOTAL-GYQX201206007.htm
|
| [4] |
秦宏德.青藏高原那曲地区强对流天气的大气静力能量垂直分布.高原气象, 1983, 2(1):61-65. http://www.cnki.com.cn/Article/CJFDTOTAL-GYQX198301005.htm
|
| [5] |
卓嘎, 徐祥德.青藏高原对流云团东移发展的不稳定特征.应用气象学报, 2002, 13(4):447-456. http://qikan.camscma.cn/jams/ch/reader/view_abstract.aspx?file_no=20020460&flag=1
|
| [6] |
徐祥德, 陈联寿.青藏高原大气科学试验研究进展.应用气象学报, 2006, 17(6):756-772. doi: 10.11898/1001-7313.20060613
|
| [7] |
蔡学湛.青藏高原雪盖与东亚季风异常对华南前汛期降水的影响.应用气象学报, 2001, 12(3):358-366. http://qikan.camscma.cn/jams/ch/reader/view_abstract.aspx?file_no=20010347&flag=1
|
| [8] |
章基嘉, 朱抱真, 朱福康, 等.青藏高原气象学进展.北京:科学出版社, 1988.
|
| [9] |
程向阳, 谢五三, 刘岩, 等.安徽省近五十年雷暴的时空变化特征及影响因素.长江流域资源与环境, 2012, 21(1):117-121. http://www.cnki.com.cn/Article/CJFDTOTAL-AHSZ201001014.htm
|
| [10] |
刘雪松, 马玉才, 拉巴, 等.那曲地区牧业气候区划.北京:气象出版社, 2003.
|
| [11] |
陈辉, 施能, 王永波.北半球500hPa高度场趋势变化与突变.热带气象学报, 2000, 16(3):272-281. http://www.cnki.com.cn/Article/CJFDTOTAL-RDQX200003009.htm
|
| [12] |
任景轩, 朱克云, 张杰, 等.近30年西藏地区雷暴变化特征.气象科技, 2011, 39(3):289-293. http://www.cnki.com.cn/Article/CJFDTOTAL-XZKJ201409023.htm
|
| [13] |
假拉, 杜军, 边巴扎西, 等.西藏气象灾害区划研究.北京:气象出版社, 2008.
|
| [14] |
任崇, 温亚丽.夏季风时期湛江市雷暴日数的变化特征及大气环流条件分析.广东气象, 2012, 34(1):32-34. http://www.cnki.com.cn/Article/CJFDTOTAL-GDCX201201010.htm
|
| [15] |
张美平, 敖淑珍, 刘翔, 等.广州白云国际机场近46年来雷暴气候的统计特征.应用气象学报, 2004, 15(1):66-73. http://qikan.camscma.cn/jams/ch/reader/view_abstract.aspx?file_no=20040109&flag=1
|
| [16] |
王其洋.那曲地区降水分析.西藏科技, 2006(4):52-54. http://www.cnki.com.cn/Article/CJFDTOTAL-XZKJ200604016.htm
|
| [17] |
杜军, 周顺武.西藏近40年气温变化的气候特征分析.应用气象学报, 2000, 11(2):221-227. http://qikan.camscma.cn/jams/ch/reader/view_abstract.aspx?file_no=20000232&flag=1
|

Figures(9) / Tables(2)
