
 设为首页
设为首页 加入收藏
加入收藏

Comparison of Two Damaging Wind Events Caused by Strong Downbursts
-
摘要: 利用多普勒天气雷达、常规探空和地面观测数据、1 min降水量和5 min间隔加密自动气象站观测数据, 对比分析了2017年6月2日和8月6日山东两次强下击暴流风暴(简称6·2超级单体和8·6强单体)雷达特征及地面致灾大风的成因。研究表明:两次致灾大风过程在强天气尺度和有利中尺度环境下分别形成超级单体和强单体风暴并触发系列下击暴流, 最强下击暴流发生时垂直积分液态水含量先跃增后骤降, 6·2超级单体伴随中气旋顶和底高度的剧烈下沉。两次强下击暴流触地前均出现强反射率因子核的快速下降、底层高径向速度和强辐散、中层径向辐合和高空强辐散特征。6·2超级单体旋转特性强、中气旋深厚, 低层伴随弧形入流缺口和勾状回波。8·6强单体中低层辐合特征显著, 风暴前端低层伴有由雷暴出流和前侧入流形成的辐合带。两次强下击暴流引起地面致灾大风的过程中负浮力效应基本相当, 6·2超级单体冷池密度流效应更明显, 8·6强单体动量下传效应更显著。潍坊南孙站位于风暴移动方向正前侧, 前侧辐散气流与同向快速移动的风暴叠加, 是导致37 m·s-1极端大风的重要原因。Abstract: Multi-source observations are used to comprehensively analyze the Doppler weather radar characteristics of strong storms and the formation mechanisms of surface damaging wind induced by two strong downbursts, occurred in Shandong on 2 June 2017 and 6 August 2017. It's found that two damaging wind events occurs under strong synoptic scale weather system forcing and favorable meso-scale environmental conditions, the relatively isolated supercell storm on 2 June (6·2 supercell) and strong single storm on 6 August (8·6 strong single storm) fiercely develop into series of downbursts, which leads to the occurrence of large-scale damaging winds. As two strong downbursts induced by 6·2 supercell storm and 8·6 strong single storm evolves, the vertically integrated liquid water content radar parameter first rises and then quickly plunges down. During 6·2 supercell storm, a powerful downburst descends sharply, causing the mesocyclone's top and bottom to shoal and its thickness to decrease. The occurrence of two strong downbursts are accompanied by obvious radar characteristics including reflective factor core rapid decline, high value area of radial velocity at low elevation, strong divergence at bottom, remarkable mid altitude radial convergence and severe divergence at upper-level. 6·2 supercell storm is characterized by intense rotation. Its mesocyclone lasts for a long time and extends deeply both upwards and downwards. Additionally, there are arc-shaped inflow notches and hook echoes at low levels of 6·2 supercell storm. 8·6 strong single storm is characterized by significant low-level convergence. Besides, there is a convergence zone at or near the surface formed by the outflow of the strong downburst and the inflow in front of 8·6 strong single storm. Among all the formation mechanisms of two damaging winds induced by two strong downbursts, the negative buoyancy effect of two storms is basically equivalent, but the cold pool outflow effect is more evident for 6·2 supercell storm, and the downward transport momentum effect is more significant for 8·6 strong single storm. The Nansun Station of Weifang locating right ahead of 8·6 strong single storm's approaching direction, therefore the front divergence flow from the strong downbursts is preferable superimposed on the fast moving homodromous storm, indicating the speed of the front divergence flow better superimposes on the speed of the storm itself, which is crucial for the occurrence of 37.0 m·s-1 extreme wind.
-
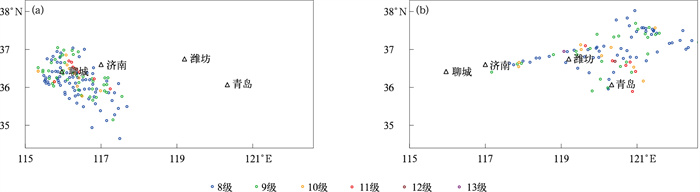
图 1 2017年6月2日17:00—3日02:00(a)和2017年8月6日18:00—7日02:00(b) 山东8级(不小于17.2 m·s-1) 以上大风分布
Fig. 1 Distributions for the wind speed no less than 8 degree (no less than 17.2 m·s-1) in Shandong from 1700 BT 2 Jun to 0200 BT 3 Jun(a) and from 1800 BT 6 Aug to 0200 BT 7 Aug(b) in 2017

图 2 2017年6月2日济南雷达17:00(a), 17:53(b), 18:39(c), 20:01(d)和8月6日潍坊雷达17:01(e), 18:00(f), 18:58(g), 19:40(h)组合反射率因子
Fig. 2 Composite reflectivity of Jinan Radar at 1700 BT(a), 1753 BT(b), 1839 BT(c), 2001 BT(d) on 2 Jun 2017 and that of Weifang Radar at 1701 BT(e), 1800 BT(f), 1858 BT(g), 1940 BT(h) on 6 Aug 2017
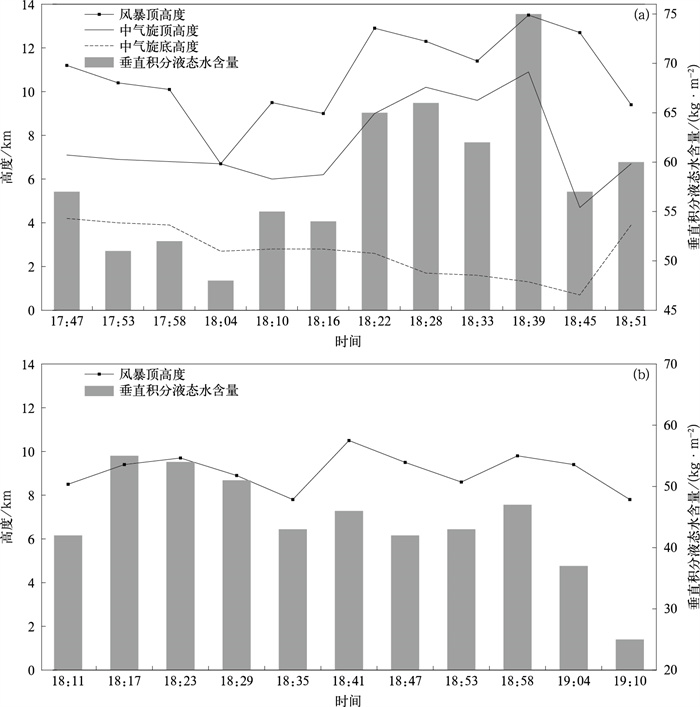
图 3 6·2超级单体风暴(a)和8·6强单体风暴(b)结构演变
Fig. 3 Evolution of 6·2 supercell storm(a) and 8·6 strong single storm(b) structures
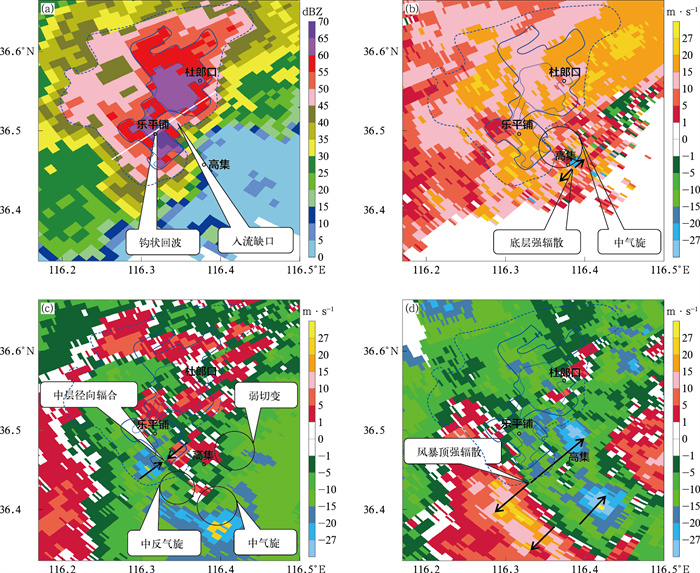
图 4 2017年6月2日18:45济南雷达2.4°仰角反射率因子(a)和0.5°仰角(b)、6.0°仰角(c)、9.0°仰角(d)径向速度(蓝色虚线、实线、点线分别为45、55 dBZ和60 dBZ等值线)
Fig. 4 Reflectivity at 2.4° elevation(a) and radial velocity at 0.5° elevation(b), 6.0° elevation(c), 9.0° elevation(d) of Jinan Radar at 1845 BT 2 Jun 2017 (the blue dashed line, the blue solid line and the blue dotted line denote 45, 55 dBZ and 60 dBZ isolines of reflectivity, respecitvely)
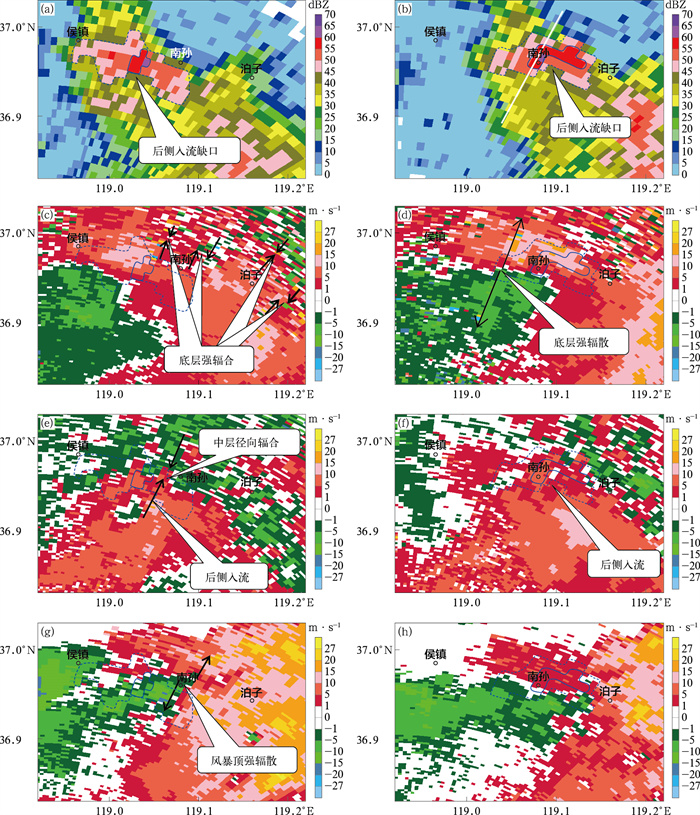
图 5 2017年8月6日18:58和19:04潍坊雷达1.5°仰角反射率因子和0.5°、6.0°以及14.6°仰角径向速度(蓝色虚线、实线分别为45、55 dBZ等值线) (a)18:58 1.5°仰角反射率因子,(b)19:04 1.5°仰角反射率因子, (c)18:58 0.5°仰角径向速度,(d)19:04 0.5°仰角径向速度,(e)18:58 6.0°仰角径向速度, (f)19:04 6.0°仰角径向速度,(g)18:58 14.6°仰角径向速度,(h)19:04 14.6°仰角径向速度
Fig. 5 Reflectivity factor at 1.5° elevation and radial velocity at 0.5°, 6.0°, 14.6°elevation of Weifang Radar at 1858 BT and 1904 BT on 6 Aug 2017 (the blue dashed line and the blue solid line denote 45 dBZ and 55 dBZ isolines of reflectivity factor, respecitvely) (a)1.5° elevation reflectivity factor at 1858 BT, (b)1.5° elevation reflectivity factor at 1904 BT, (c)0.5° elevation radial velocity at 1858 BT,(d)0.5° elevation radial velocity at 1904 BT,(e)6.0° elevation radial velocity at 1858 BT,(f)6.0° elevation radial velocity at 1904 BT, (g)14.6° elevation radial velocity at 1858 BT,(h)14.6° elevation radial velocity at 1904 BT
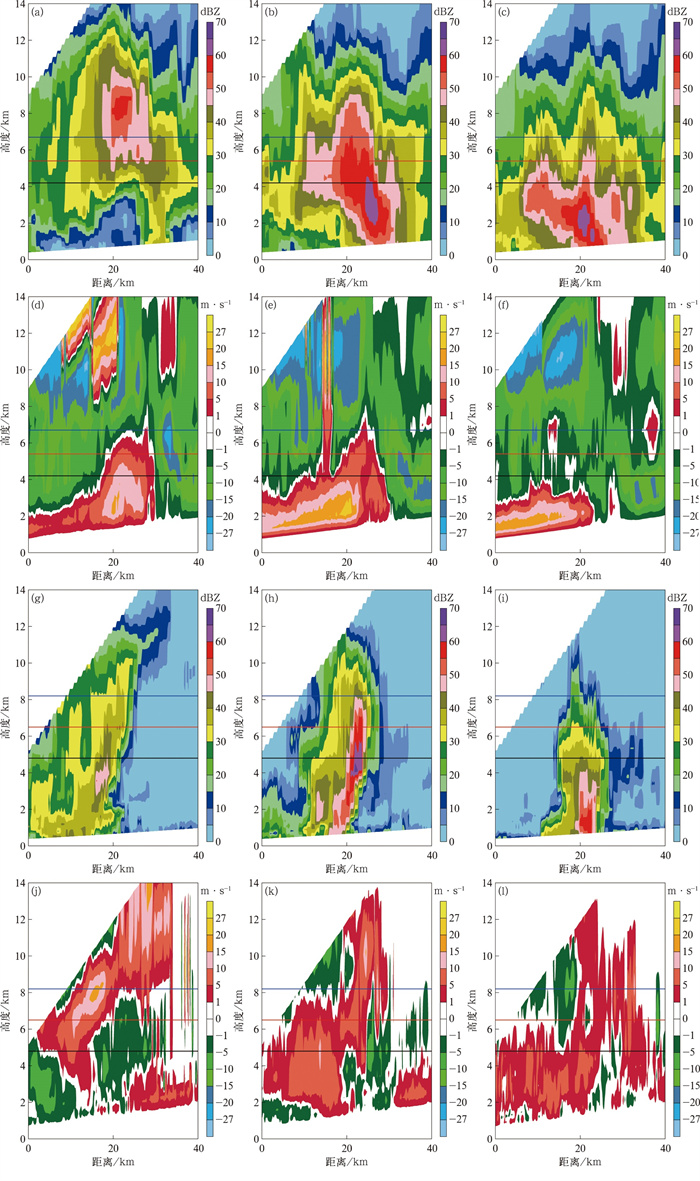
图 6 2017年6月2日济南雷达反射率因子和径向速度沿236.6°和2017年8月6日潍坊雷达反射率因子和径向速度沿24°的垂直剖面(黑色、红色和蓝色水平实线分别为0 ℃层,-10 ℃层和-20 ℃层高度) (a)6月2日18:33济南雷达反射率因子垂直剖面,(b)6月2日18:39济南雷达反射率因子垂直剖面, (c)6月2日18:45济南雷达反射率因子垂直剖面,(d)6月2日18:33济南雷达径向速度垂直剖面, (e)6月2日18:39济南雷达径向速度垂直剖面,(f)6月2日18:45济南雷达径向速度垂直剖面, (g)8月6日18:53潍坊雷达反射率因子垂直剖面,(h)8月6日18:58潍坊雷达反射率因子垂直剖面, (i)8月6日19:04潍坊雷达反射率因子垂直剖面,(j)8月6日18:53潍坊雷达径向速度垂直剖面, (k)8月6日18:58潍坊雷达径向速度垂直剖面,(l)8月6日19:04潍坊雷达径向速度垂直剖面
Fig. 6 Cross-sections of horizontal reflectivity factor and radial velocity along 236.6° radial direction of Jinan Radar on 2 Jun 2017 and along 24° radial direction of Weifang Radar on 6 Aug 2017 (black, red and blue horizontal solid lines denote heights of the 0 ℃ layer, -10 ℃ layer and -20 ℃ layer, respectively) (a)reflectivity factor cross-section of Jinan Radar at 1833 BT 2 Jun,(b)reflectivity factor cross-section of Jinan Radar at 1839 BT 2 Jun,(c)reflectivity factor cross-section of Jinan Radar at 1845 BT 2 Jun,(d)radial velocity cross-sections of Jinan Radar at 1833 BT 2 Jun, (e)radial velocity cross-section of Jinan Radar at 1839 BT 2 Jun,(f)radial velocity cross-section of Jinan Radar at 1845 BT 2 Jun, (g)reflectivity factor cross-section of Weifang Radar at 1853 BT 6 Aug,(h)reflectivity factor cross-section of Weifang Radar at 1858 BT 6 Aug, (i)reflectivity factor cross-section of Weifang Radar at 1904 BT 6 Aug,(j)radial velocity cross-section of Weifang Radar at 1853 BT 6 Aug, (k)radial velocity cross-section of Weifang Radar at 1958 BT 6 Aug,(l)radial velocity cross-section of Weifang Radar at 1904 BT 6 Aug
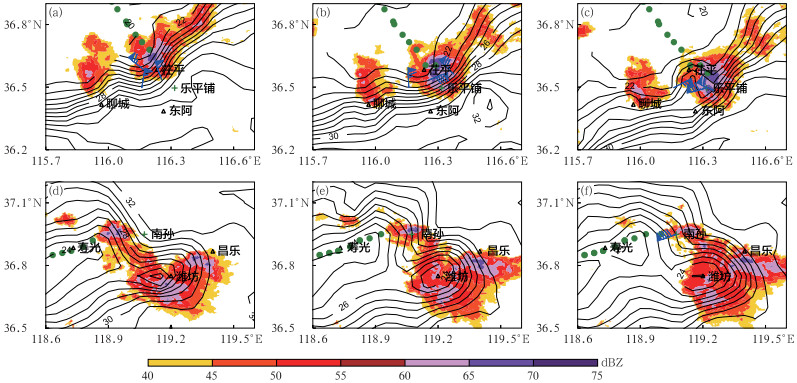
图 7 2017年6月2日18:30(a)、18:40(b)、18:45(c)和8月6日18:50(d)、19:00(e)、19:05(f)气温(等值线,单位:℃) 及其临近时次济南(18:28、18:39、18:45) 和潍坊(18:47、18:58、19:04) 雷达组合反射率因子和风暴中心位置分布(绿色实心圆分别代表 6·2超级单体和8·6强单体风暴路径位置)
Fig. 7 Spatial distribution of surface temperature (the isoline, unit:℃) at 1830 BT(a), 1840BT(b), 1845 BT(c) on 2 Jun 2017 and 1850 BT(d), 1900 BT(e),1905 BT(f) on 6 Aug 2017 and composite reflectivity factor and storm locations of Jinan Radar (1828 BT, 1839 BT, 1845 BT) and Weifang Radar (1847 BT, 1858 BT, 1904 BT) (green solid circles denote locations of 6·2 supercell storm and 8·6 strong storm paths, respectively)
-
[1] Wakimoto R M.Convectively Driven High Wind Events.Severe Convective Storms.Boston,MA:American Meteorological Society,2001:255-298. [2] Fujita T T. Manual of Downburst Identification for Project NIMROD. SMRP Research Paper156, Chicago: University of Chicago, 1978. [3] Fujita T T, Wakimoto R M. Five scales of airflow associated with a series of downbursts on 16 July 1980. Mon Wea Rev, 1981, 109(7): 1438-1456. doi: 10.1175/1520-0493(1981)109<1438:FSOAAW>2.0.CO;2 [4] 郑永光, 田付友, 孟智勇, 等. "东方之星"客轮翻沉事件周边区域风灾现场调查与多尺度特征分析. 气象, 2016, 42(1): 1-13.Zheng Y G, Tian F Y, Meng Z Y, et al. Survey and multi-scale characteristics of wind damage caused by convective storms in the surrounding area of the capsizing accident of cruise ship "Dongfangzhixing". Meteor Mon, 2016, 42(1): 1-13. [5] Weisman M L. The genesis of severe, long-lived bow echoes. J Atmos Sci, 1993, 50(4): 645-670. doi: 10.1175/1520-0469(1993)050<0645:TGOSLL>2.0.CO;2 [6] Przybylinski R W. The bow echo: Observations, numerical simulations, and severe weather detection methods. Wea Forecasting, 1995, 10(2): 203-218. doi: 10.1175/1520-0434(1995)010<0203:TBEONS>2.0.CO;2 [7] 马淑萍, 王秀明, 俞小鼎. 极端雷暴大风的环境参量特征. 应用气象学报, 2019, 30(3): 292-301.Ma S P, Wang X M, Yu X D. Environmental parameter characteristics of severe wind with extreme thunderstorm. J Appl Meteor Sci, 2019, 30(3): 292-301. [8] 王黉, 李英, 宋丽莉, 等. 川藏地区雷暴大风活动特征和环境因子对比. 应用气象学报, 2020, 31(4): 435-446.Wang H, Li Y, Song L L, et al. Comparison of characteristics and environmental factors of thunderstorm gales over the Sichuan-Tibet Region. J Appl Meteor Sci, 2020, 31(4): 435-446. [9] 俞小鼎. 雷暴与强对流临近预报. 北京: 气象出版社, 2020.Yu X D. Thunderstorm and Strong Convection Prediction. Beijing: China Meteorological Press, 2020. [10] 郭飞燕, 刁秀广, 马艳, 等. 山东一次飑线双偏振结构与地面降水滴谱特征分析. 气象学报, 2023, 81(2): 328-339.Guo F Y, Diao X G, Ma Y, et al. Characteristics of the dual-polarization structure and raindrop size distribution of a squall line in Shandong. Acta Meteor Sinica, 2023, 81(2): 328-339. [11] Mauri E L, Gallus Jr W A. Differences between severe and nonsevere warm-season, nocturnal bow echo environments. Wea Forecasting, 2021, 36(1): 53-74. doi: 10.1175/WAF-D-20-0137.1 [12] 郭飞燕, 刁秀广, 褚颖佳, 等. 弱垂直风切变环境下强下击暴流双偏振雷达特征. 应用气象学报, 2023, 34(6): 681-693.Guo F Y, Diao X G, Chu Y J, et al. Dual polarization radar characteristics of severe downburst occurred in weak vertical wind shear. J Appl Meteor Sci, 2023, 34(6): 681-693. [13] Wakimoto R M, Bringi V N. Dual-polarization observations of microbursts associated with intense convection: The 20 July storm during the MIST project. Mon Wea Rev, 1988, 116(8): 1521-1539. doi: 10.1175/1520-0493(1988)116<1521:DPOOMA>2.0.CO;2 [14] Kuster C M, Heinselman P L, Schuur T J. Rapid-update radar observations of downbursts occurring within an intense multicell thunderstorm on 14 June 2011. Wea Forecasting, 2016, 31(3): 827-851. doi: 10.1175/WAF-D-15-0081.1 [15] Kuster C M, Bowers B R, Carlin J T, et al. Using KDP cores as a downburst precursor signature. Wea Forecasting, 2021, 36(4): 1183-1198. doi: 10.1175/WAF-D-21-0005.1 [16] 王一童, 王秀明, 俞小鼎. 产生致灾大风的超级单体回波特征. 应用气象学报, 2022, 33(2): 180-191.Wang Y T, Wang X M, Yu X D. Radar characteristics of straight-line damaging wind producing supercell storms. J Appl Meteor Sci, 2022, 33(2): 180-191. [17] 俞小鼎, 张爱民, 郑媛媛, 等. 一次系列下击暴流事件的多普勒天气雷达分析. 应用气象学报, 2006, 17(4): 385-393.Yu X D, Zhang A M, Zheng Y Y, et al. Doppler radar analysis on a series of downburst events. J Appl Meteor Sci, 2006, 17(4): 385-393. [18] 段亚鹏, 王东海, 刘英. "东方之星" 翻沉事件强对流天气分析及数值模拟. 应用气象学报, 2017, 28(6): 666-677.Duan Y P, Wang D H, Liu Y. Radar analysis and numerical simulation of strong convective weather for "Oriental Star" depression. J Appl Meteor Sci, 2017, 28(6): 666-677. [19] 盛杰, 郑永光, 沈新勇, 等. 2018年一次罕见早春飑线大风过程演变和机理分析. 气象, 2019, 45(2): 141-154.Sheng J, Zheng Y G, Shen X Y, et al. Evolution and mechanism of a rare squall line in early spring of 2018. Meteor Mon, 2019, 45(2): 141-154. [20] Ribeiro B Z, Weiss S J, Bosart L F. An analysis of the 3 May 2020 low-predictability derecho using a convection-allowing MPAS ensemble. Wea Forecasting, 2022, 37(2): 219-239. doi: 10.1175/WAF-D-21-0092.1 [21] 孙继松. 与直线型对流大风相关的强风暴形态结构和热动力学过程. 气象, 2023, 49(1): 1-11.Sun J S. The pattern structure and thermodynamic and dynamic processes of severe storms associated with linear convective gales. Meteor Mon, 2023, 49(1): 1-11. [22] 王秀明, 俞小鼎, 费海燕, 等. 下击暴流形成机理及监测预警研究进展. 气象, 2023, 49(2): 129-145.Wang X M, Yu X D, Fei H Y, et al. A review of downburst genesis mechanism and warning. Meteor Mon, 2023, 49(2): 129-145. [23] French A J, Parker M D. The initiation and evolution of multiple modes of convection within a meso-alpha-scale region. Wea Forecasting, 2008, 23(6): 1221-1252. doi: 10.1175/2008WAF2222136.1 [24] Parker M D, Borchardt B S, Miller R L, et al. Simulated evolution and severe wind production by the 25-26 June 2015 nocturnal MCS from PECAN. Mon Weather Rev, 2020, 148(1): 183-209. doi: 10.1175/MWR-D-19-0072.1 [25] 王秀明, 俞小鼎, 周小刚, 等. "6.3"区域致灾雷暴大风形成及维持原因分析. 高原气象, 2012, 31(2): 504-514.Wang X M, Yu X D, Zhou X G, et al. Study on the formation and evolution of "6.3" damage wind. Plateau Meteor, 2012, 31(2): 504-514. [26] 许长义, 章丽娜, 肖现, 等. 冷涡背景下华北平原一次弓形回波致灾大风过程分析. 气象学报, 2023, 81(1): 40-57.Xu C Y, Zhang L N, Xiao X, et al. Case analysis of damaging high winds generated by bow echoes in the presence of a cold vortex over the North China Plain. Acta Meteor Sinica, 2023, 81(1): 40-57. [27] 刁秀广, 李芳, 万夫敬. 两次强冰雹超级单体风暴双偏振特征对比. 应用气象学报, 2022, 33(4): 414-428.Diao X G, Li F, Wan F J. Comparative analysis on dual polarization features of two severe hail supercells. J Appl Meteor Sci, 2022, 33(4): 414-428. [28] 徐玥, 邵美荣, 唐凯, 等. 2021年黑龙江两次超级单体龙卷过程多尺度特征. 应用气象学报, 2022, 33(3): 305-318.Xu Y, Shao M R, Tang K, et al. Multiscale characteristics of two supercell tornados of Heilongjiang in 2021. J Appl Meteor Sci, 2022, 33(3): 305-318. [29] 李胜山, 张殿江, 胡玲, 等. 一次下击暴流显著弓形回波特征. 气象与环境学报, 2012, 28(4): 84-89.Li S S, Zhang D J, Hu L, et al. An analysis of a typical bow echo. J Meteor Environ, 2012, 28(4): 84-89. [30] 陈绍婕, 郑佳锋, 杨吉, 等. C-FMCW雷达反演飑线大气垂直速度和雨滴谱. 应用气象学报, 2022, 33(4): 429-441.Chen S J, Zheng J F, Yang J, et al. Retrieval of air vertical velocity and droplet size distribution in squall line precipitation using C-FMCW radar. J Appl Meteor Sci, 2022, 33(4): 429-441. [31] Emanuel K A. Atmospheric Convection. New York: Oxford University Press, 1994: 158-165. [32] Markowski P, Richardson Y. Mesoscale Meteorology in Midlatitudes. Chichester: Wiley-Blackwell, 2010: 245-265. -

 下载:
下载:
计量
- 摘要浏览量: 263
- HTML全文浏览量: 62
- PDF下载量: 89
- 被引次数: 0
