
 设为首页
设为首页 加入收藏
加入收藏

Variation of Surface Solar Radiation over the Central and East of Southern China
-
摘要: 为进一步探讨我国地面太阳辐射的变化规律及其原因,选择我国南方中东部地区,利用该区域1961—2007年33个站点的地面太阳总辐射资料,结合云量、大气水汽含量和能见度等观测资料,综合研究该区域地面太阳总辐射的变化规律及其原因。结果表明:1961—1989年,我国南方中东部地区地面太阳总辐射呈下降趋势,之后发生逆转,1995年后其变化趋于缓和,1961—2007年总体呈现变暗—变亮—变缓的趋势。究其原因,该区域云量平均值由峰入谷、云量下降速率由快变慢可能是产生此变化趋势的原因之一;其次,20世纪80年代到21世纪初,气溶胶光学厚度上升趋势减缓,气溶胶地面辐射强迫变化趋于缓和,某些区域甚至出现下降,也导致部分站点地面太阳总辐射由暗变亮。Abstract: Surface solar radiation is one of most essential variables that influence the climate and environment. Various studies analyzing long-term records of surface radiation measurements suggest a widespread decrease in surface solar radiation between the 1950s and 1980s (global dimming), with a partial recovery more recently at many locations (brightening). To provide reasonable evidence for predicting the future trend of climate changes, the spatial and temporal variation of surface solar radiation and the causes are analyzed comprehensively by using observational solar radiation data together with conventional meteorological data of the central and east of southern China from 1961 to 2007.Solar radiation is obviously declining during 1961—1990 over the central and east of southern China, and a widespread brightening is observed during 1989—1995, but from 1995 to 2007 brightening doesn't persist and the solar radiation tendency tends to moderation. Increase of aerosol may be the main causes of solar radiation from dimming to brightening during 1961—1990, and the difference of cloud cover tendency maybe the main causes of solar radiation dimming.Model simulation shows that in recent 50 years water vapor is rising, which has decreased solar radiation by 0.55 W·m-2 at the beginning of the 21st Century than that of the 1980s, but it is not main cause of solar radiation from dimming to bighting in recent 50 years. A widespread ascending aerosol optical depth (8.8%) is observed from 1980 to 2007, but the tendency tends to moderation. Due to the joint effect of atmosphere moisture and aerosol optical depth, a variation of aerosol direct radiative forcing is weakened, and the overall trend shows that aerosol direct radiative forcing variation trend to moderation (0.22 W·m-2 in the country and 0.29 W·m-2 in the city).Entering the 21st Century, solar radiation tends to moderation. This tendency indicates the cause for solar radiation change of China in the 1990s is different from Europe and America, and aerosol decline is not the major contributor. On the other hand, it also demonstrates if the air quality improves in the future, the solar radiation over the central and east of southern China may rise again.
-
Key words:
- surface solar radiation;
- water vapor;
- aerosol;
- cloud cover
-
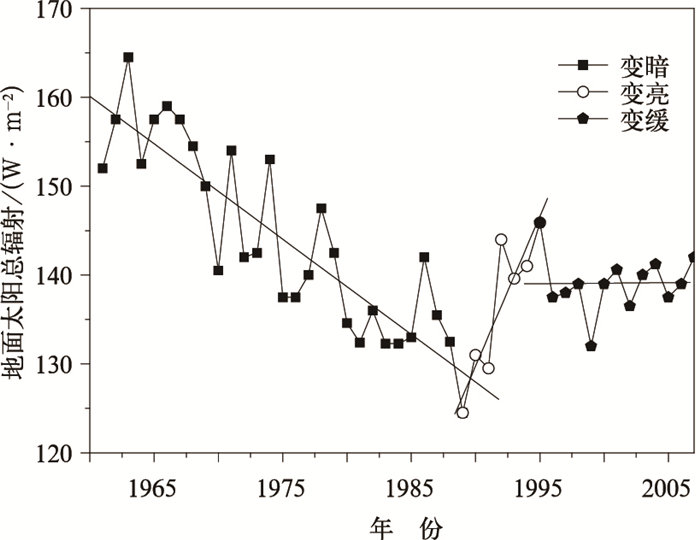
图 1 1961—2007年我国南方中东部地区18站地面太阳总辐射变化规律
Fig. 1 Variation of annual-averaged surface solar radiation over the central and east of southern China during 1961—2007

图 2 我国南方中东部地区18个台站云量距平的变化
Fig. 2 Variation of annual-averaged cloud cover over the central and east of southern China during 1961—2007
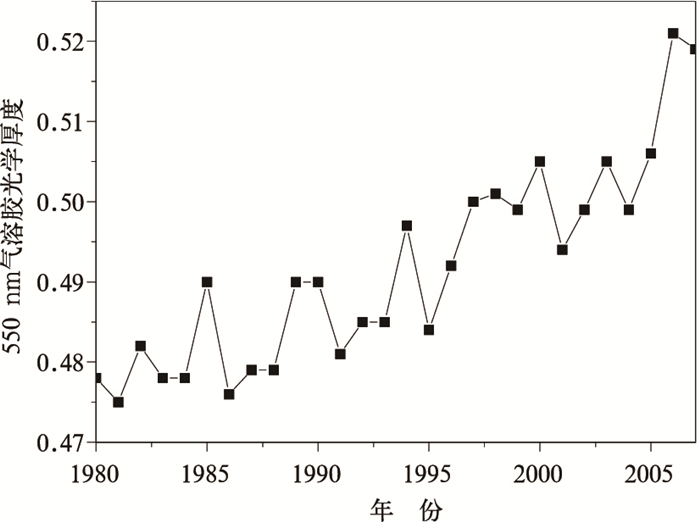
图 3 我国南方中东部地区气溶胶光学厚度的变化趋势
Fig. 3 Variation of annual-averaged aerosol optical thickness over the central and east of southern China
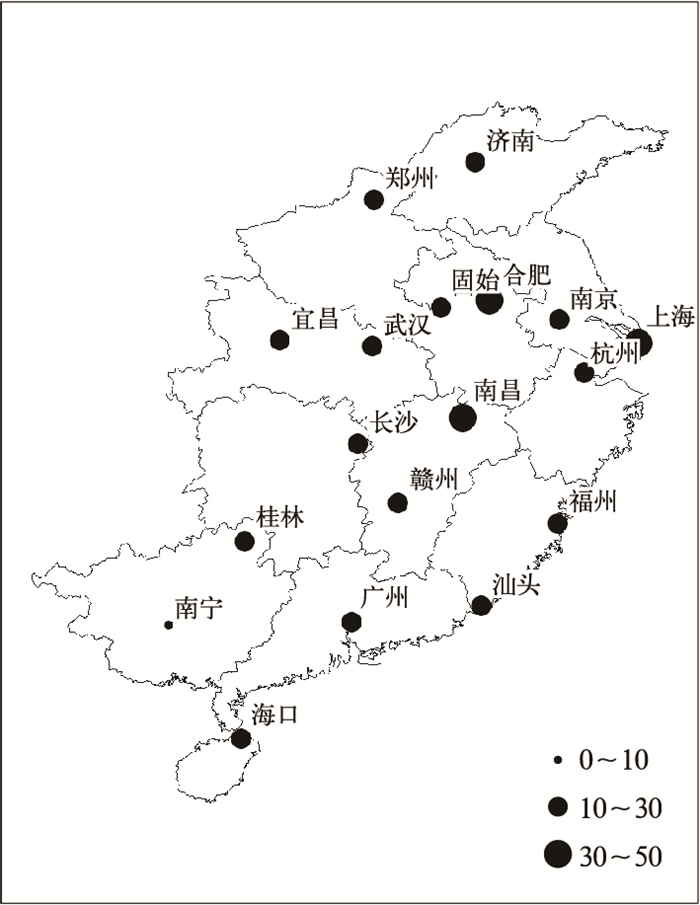
图 4 1980—2007年我国南方中东部地区 (乡村) 气溶胶地面辐射强迫模拟结果 (单位:W·m-2)
Fig. 4 Distribution of aerosol radiative forcing on country surface over the central and east of southern China during 1980—2007 (unit: W·m-2)
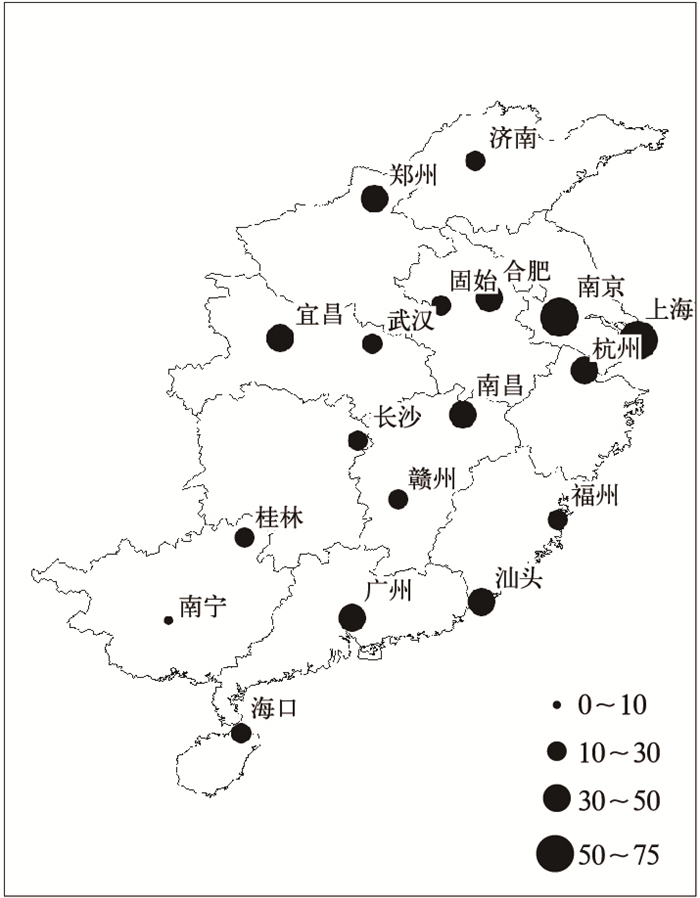
图 5 1980—2007年我国南方中东部地区 (城市) 气溶胶地面辐射强迫模拟结果 (单位:W·m-2)
Fig. 5 Distribution of aerosol radiative forcing on city surface over the central and east of southern China during 1980—2007(unit: W·m-2)
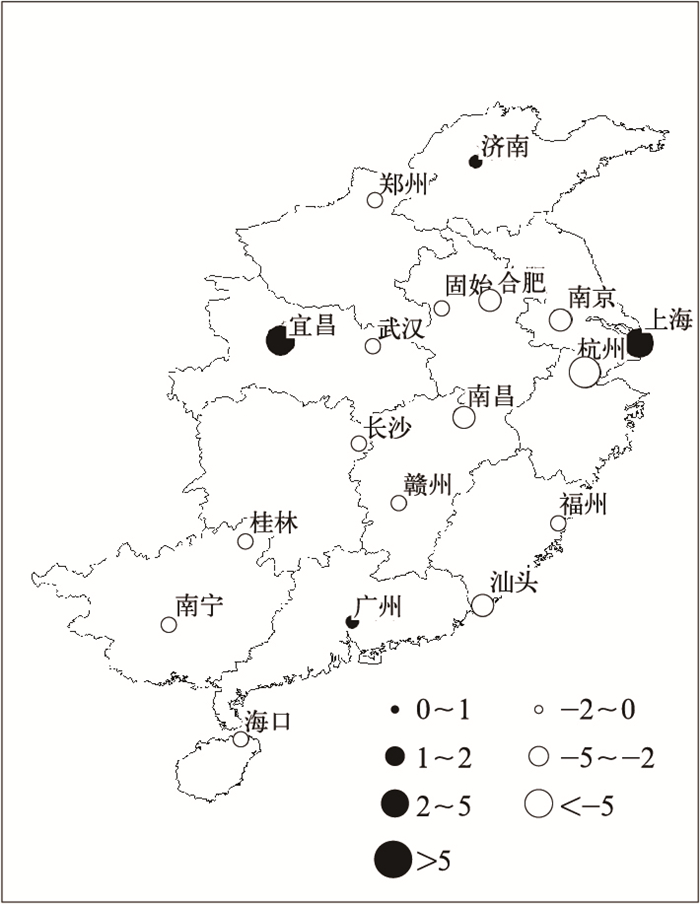
图 6 20世纪80年代到21世纪初我国南方中东部地区 (乡村) 气溶胶地面辐射强迫变化模拟结果 (单位:W·m-2)
Fig. 6 Variation of aerosol radiative forcing on country surface over the central and east of southern China from 1980s to the beginning of the 21st Century (unit: W·m-2)
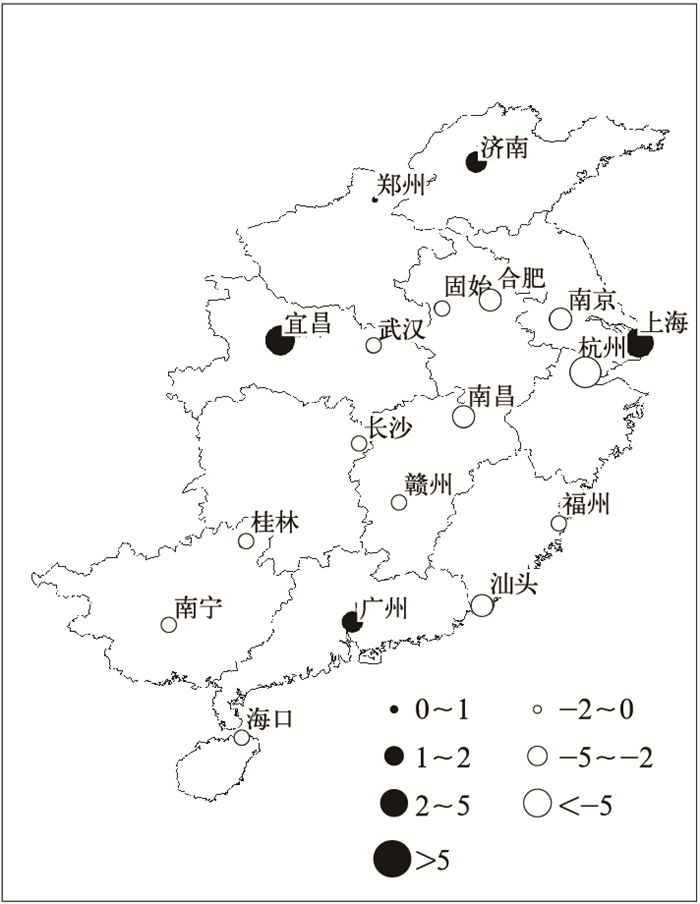
图 7 20世纪80年代到21世纪初我国南方中东部地区 (城市) 气溶胶地面辐射强迫变化模拟结果 (单位:W·m-2)
Fig. 7 Variation of aerosol radiative forcing on city surface over the central and east of southern China from 1980s to the beginning of the 21st Century (unit: W·m-2)
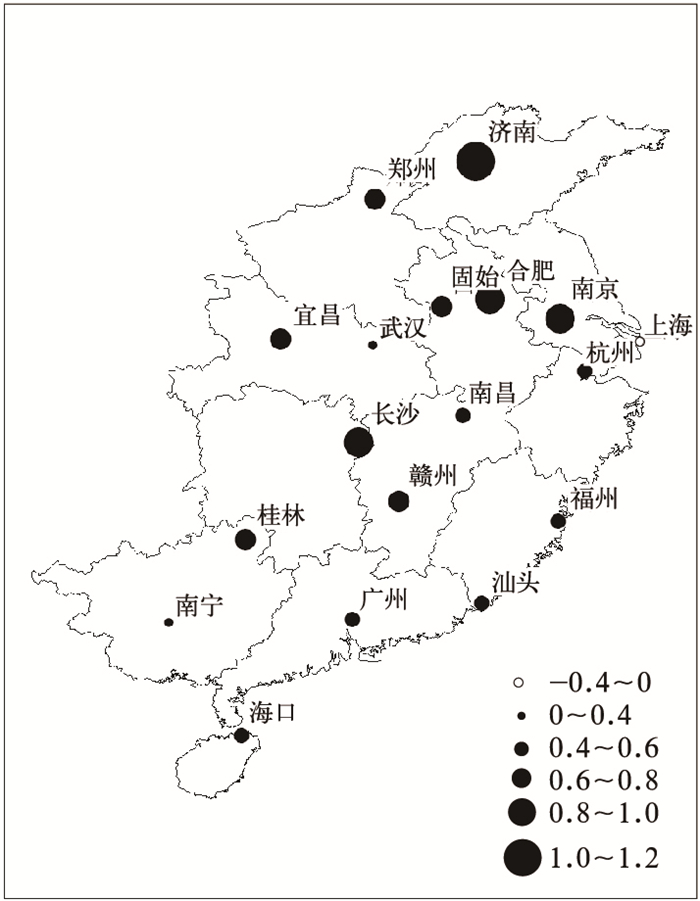
图 8 20世纪80年代到21世纪初我国南方中东部地区水汽对地面太阳辐射削弱的模拟结果 (单位:W·m-2)
Fig. 8 Variation of drop extinction over the central and east of southern China from 1980s to the beginning of the 21st Century (unit: W·m-2)
表 1 1961—2007年我国南方中东部地区地面太阳总辐射的变化趋势
Table 1 Decrease and ascend in surface solar radiation over the central and east of southern China during 1961—2007
时段 日射站数量 上升站点
数量通过0.05显著性
检验上升站点数量下降
站点数量通过0.05显著性
检验下降站点数量1961—1989年 22 2 0 20 18 1989—1995年 18 16 9 2 1 1995—2007年 29 14 1 15 0  下载: 导出CSV
表 2 1961—2007年我国南方中东部地区地面太阳总辐射的变化线性倾向率
Table 2 The long trend of annual-averaged surface solar radiation over the central and east of southern China during 1961—2007
时段 线性倾向率/(W·m-2·a-1) R2 1961—1989年 -1.078 0.7648** 1989—1995年 3.270 0.7909* 1995—2007年 0.058 0.0051 注:**为通过0.01显著性检验,*为通过0.05显著性检验。
下载: 导出CSV
表 3 1989—2005年我国南方中东部地区部分站点云量、能见度、地面太阳总辐射变化趋势
Table 3 The long trend of cloud cover, visibility, surface solar radiation over the central and east of southern China during 1989—2005
站点 1989—1995年 1995—2005年 云量
/(10-2/10 a)能见度
/(km/10 a)地面太阳总辐射
/(W·m-2/10 a)云量
/(10-2/10 a)能见度
/(km/10 a)地面太阳总辐射
/(W·m-2/10 a)济南 -1.49 0.32 29.05 0.58 2.02 -6.02 郑州 -1.22 -0.85 27.66 0.11 -0.80 6.13 宜昌 -1.02 61.92 0.26 12.38 武汉 -0.23 -1.55 52.20 -0.14 -0.38 4.51 长沙 -1.15 -2.74 42.01 -0.55 1.87 -21.99 桂林 0.08 -2.76 73.26 -0.60 -0.04 14.81 赣州 -0.32 -0.37 33.56 0.34 1.94 -9.84 固始 -1.24 -2.53 39.70 0.22 1.09 3.13 南京 -1.67 -0.63 8.68 0.29 -1.63 16.09 合肥 -1.60 75.58 0.03 11.69 上海 -0.62 17.48 -0.38 4.28 杭州 -1.39 0.96 57.99 -0.65 -0.95 18.40 南昌 -0.85 39.12 -0.61 2.31 福州 -0.70 1.68 47.80 -0.35 -0.76 -0.58 广州 -0.09 0.05 -22.92 -0.78 0.81 7.41 汕头 -0.30 -0.07 39.00 -0.68 0.17 2.66 南宁 0.00 -1.62 -76.50 -0.46 1.35 17.48 海口 0.33 0.25 16.90 -0.11 -0.28 2.31
下载: 导出CSV
-
[1] 李崇银.气候动力学引论.北京:气象出版社, 2000: 65-105. [2] 汪方, 丁一汇.全球气候模式对东亚地区地表短波辐射的模拟检验.应用气象学报, 2008, 19(6):749-759. doi: 10.11898/1001-7313.20080615 [3] 李清泉, 王兰宁, 徐影.辐射参数化方案对气候模拟和回报的影响.应用气象学报, 2005, 16(增刊):12-21. http://kns.cnki.net/KCMS/detail/detail.aspx?dbcode=CJFQ&dbname=CJFD2005&filename=YYQX2005S1001&v=MDc5ODZHNEh0U3ZybzlGWllSOGVYMUx1eFlTN0RoMVQzcVRyV00xRnJDVVJMMmZZdWRxRmlIaFZyektQRFRhZHI= [4] Pinker R T, Zhang B, Dutton E G. Do satellites detect trends in surface solar radiation. Science, 2005, 308(6): 850-853. http://science.sciencemag.org/content/308/5723/850 [5] Beate G L. Observed reductions of surface solar radiation at sites in the United States and world from 1961 to 1990. Geophys Res Lett, 2002, 29(10): 61-64. doi: 10.1029/2001GL014161 [6] Stanhill G. Long-term trends in, and spatial variation of solar irradiances in Ireland. Int J Climatol, 1998, 18: 1015-1030. doi: 10.1002/(ISSN)1097-0088 [7] Abakumova G M, Feigelson E M, Bussak V, et al. Evaluation of long term changes in radiation, cloudiness and surface temperature on the territory of the former Soviet Union. J Climate, 1996, 9: 1319-1327. doi: 10.1175/1520-0442(1996)009<1319:EOLTCI>2.0.CO;2 [8] 陈志华. 1957—2000年中国地面太阳辐射状况的研究. 北京: 中国科学院大气物理研究所, 2005: 1-78. [9] Stanhill G. Global irradiance, air pollution and temperature changes in the Arctic. Phil Trans Roy Soc A, 1995, 352: 247-258. doi: 10.1098/rsta.1995.0068 [10] Martin Wild, Hans Gilgen, Andreas Roesch, et al. From dimming to brightening: Decadal changes in solar radiation at earth's surface. Science, 2005, 308(5723) : 847-850. doi: 10.1126/science.1103215 [11] Lohmann S, Schillings C, Mayer B, et al. Long-term variability of solar direct and global radiation derived from ISCCP data and comparison with reanalysis data. Solar Energy, 2006, 80(11): 1390-1401. doi: 10.1016/j.solener.2006.03.004 [12] Power H C. Trends in solar radiation over Germany and an assessment of the role of aerosols and sunshine duration. Theor Appl Climatol, 2003, doi: 10.1007/s00704-003-0005-8. [13] Shi G Y, Hayasaka T, Ohmura A, et al. Data quality assessment and the long-term trend of ground solar radiation in China. Journal of Applied Meteorology and Climatology, 2008, 47: 1006-1016. doi: 10.1175/2007JAMC1493.1 [14] 丁一汇, 孙颖.国际气候变化研究进展.气候变化研究进展, 2006, 2(4): 161-167. http://www.cnki.com.cn/Article/CJFDTOTAL-QHBH201303021.htm [15] 文小航, 尚可政, 王式功, 等.1961—2000年中国太阳辐射区域特征得初步研究.中国沙漠, 2008, 28(3): 554-561. http://www.cnki.com.cn/Article/CJFDTOTAL-ZGSS200803025.htm [16] 吴其重, 王自发, 崔应杰.我国近20年太阳辐射时空分布状况模式评估.应用气象学报, 2010, 21(3):343-351. doi: 10.11898/1001-7313.20100310 [17] 杨羡敏, 曾燕, 邱新法, 等.1960-2000年黄河流域太阳总辐射气候变化规律研究.应用气象学报, 2005, 16(2):243-248. doi: 10.11898/1001-7313.20050230 [18] 李晓文, 李维亮, 周秀骥.中国近30年太阳辐射状况研究.应用气象学报, 1998, 9(1):24-31. http://qikan.camscma.cn/jams/ch/reader/view_abstract.aspx?file_no=19980104&flag=1 [19] 中国气象局.气象辐射观测方法.北京:气象出版社, 1997:1-9. [20] 邱金桓, 林耀荣.关于中国大气气溶胶光学厚度的一个参数化模式.气象学报, 2001, 59(3): 368-372. doi: 10.11676/qxxb2001.039 [21] 杨琨, 孙照渤, 倪东鸿. 1999—2003年我国气溶胶光学厚度的变化特征.南京气象学院学报, 2008, 31 (1): 92-96. http://www.cnki.com.cn/Article/CJFDTOTAL-NJQX200801012.htm [22] Ricchiazzi P. SBDART: A research and teaching software tool for plane parallel radiative transfer in the earth's atmosphere. Bull Amer Meteor Soc, 1998, 79: 210122114. doi: 10.1175/1520-0477(1998)079<2101:SARATS>2.0.CO;2 [23] 王炳忠, 刘庚山.我国大陆大气水汽含量的计算.地理学报, 1993, 48(3): 244-253. http://www.cnki.com.cn/Article/CJFDTOTAL-DLXB199303005.htm [24] 翁笃鸣.中国辐射气候.北京:气象出版社, 1997: 41-43. [25] IPCC. Climate Change 2007: The Physical Science Basis//Contribution of Working Group Ⅰ to the Fourth Assessment Report of the Intergovernmental Panel on Climate Change. Cambridge: Cambridge University Press, 2007. [26] Martin Wild.Global dimming and brightening: A review. J Geophys Res, 2009, 114, D00D16, doi: 10.1029/2008JD011470. [27] Stanhill G, Moreshet S. Global radiation climate changes: The world network. Clim Change, 1992, 21: 57-75, doi: 10.1007/BF00143253. [28] 罗云峰, 吕达仁, 李维亮, 等.近30年来中国地区大气气溶胶光学厚度的变化特征.科学通报, 2000, 45(5): 549-554. http://www.cnki.com.cn/Article/CJFDTOTAL-KXTB200005019.htm [29] Liang F, Xia X A. Long-term trends in solar radiation and the associated climatic factors over China for 1961—2000. Annales Geophysicae, 2005, 23: 2425-2432. doi: 10.5194/angeo-23-2425-2005 [30] Liepert B G, Kukla G J. Declines in global solar radiation with increased horizontal visibility in Germany between 1964 and 1990. J Clim, 1997, 10, 2391-2401, doi: 10.1175/1520-0442. [31] Liley B. New Zealand dimming and brightening. J Geophys Res, 2009, 114, D00D10, doi: 10.1029/2008JD011401. [32] Streets D G, Wu Y, Chin M. Two-decadal aerosol trends as a likely explanation of the global dimming/brightening transition. Geophys Res Lett, 2006, 33, L15806, doi: 10.1029/2006GL026471. [33] Hatzianastassiou N. Global distribution of Earth's surface shortwave radiation budget. Atmos Chem Phys, 2005, 5: 2847-2867. doi: 10.5194/acp-5-2847-2005 [34] Ohmura A. Observed decadal variations in surface solar radiation and their causes. J Geophys Res, 2009, 114, D00D05, doi: 10.1029/2008JD011290. -

 点击查看大图
计量
- 摘要浏览量: 3581
- HTML全文浏览量: 944
- PDF下载量: 1952
- 被引次数: 0
