
 设为首页
设为首页 加入收藏
加入收藏

Sensitivity Analysis of Short-duration Heavy Rainfall Related Diagnostic Parameters with Point-area Verification
-
摘要: 对诊断物理量的准确认识可以帮助提高短时强降水的预报准确率,并帮助理解产生短时强降水的可能机制。考虑我国降水观测网的布设特点,结合NCEP最终分析资料的物理量场,以大气水汽总量和最优抬升指数为例,通过点对面检验分析了多个用于表征短时强降水环境特征的诊断物理量的敏感性。结果表明:常规的点对点检验是点对面检验的特殊情况。大气水汽总量和最优抬升指数对短时强降水的指示均存在最佳阈值,且140 km范围内的大气状况才对某点3 h内能否出现短时强降水有直接影响。对于水平分辨率为1°×1°的NCEP资料,建议点对面检验的搜索半径和记录数阈值分别为140 km和2个记录。对多个诊断物理量对比分析显示,短时强降水对水汽相关量最为敏感,其次是表征热力条件的物理量,而表征动力条件和垂直风切变的量的指示意义不够显著。Abstract: The knowledge about the short-duration heavy rainfall related diagnostic parameters is very important for improving the accuracy, and it can help understand the possible mechanism of meso-scale system producing short-duration heavy rainfall. The data collections of basic datum stations (verification stations), automatic meteorological observation stations (AMOSs), and 6-hours NCEP final analysis data (FNL) diagnostic parameters from 2011 to 2012 during 1 June and 31 August are used. By considering characteristics of rain gauge distribution, the total precipitable water and the best lifted index obtained from NCEP FNL are firstly analyzed with the "point-area" verification method to reveal the sensitivities of short-duration heavy rainfall to the environment conditions. Values of diagnostic parameters for a specific basic datum stations (verification stations) is obtained by adopting bilinear interpolation method.Results show that the popularly used verification is just special cases of "point-area" verification: One could be reached by setting infinitesimal searching radius, the other can be reached by setting the record threshold infinite. Both the total precipitable water and best lifted index have optimum thresholds indicating short-duration heavy rainfall, and the short-duration heavy rainfall in 3 hours can only be directly affected by the moisture and instability within the radius of 140 km. A searching radius and a record threshold of 140 km and 2 are supposed, respectively, for 1°×1° NCEP dataset. A total precipitable water of 55 mm divides the threat score (T) into monotone increasing and monotone decreasing parts, indicating under-forecast and over-forecast, respectively. A best lifted index of -2 ℃ divides the threat score into over-forecast and under-forecast parts. It is found that the total precipitable water and K index are equal better while both got the same highest threat scores of 0.275 with the bias (B) desirable and the false alarm ratio (F) and the hit rate (H) in the reasonable range. Short-duration heavy rainfall is most sensitive to parameters concerning the environment water vapor, nine of the top ten diagnostic parameters are water vapor related parameters. Parameters indicating environment instability conditions are also influencing, but parameters used to represent dynamic conditions and vertical wind shear conditions are lower ranked.
-
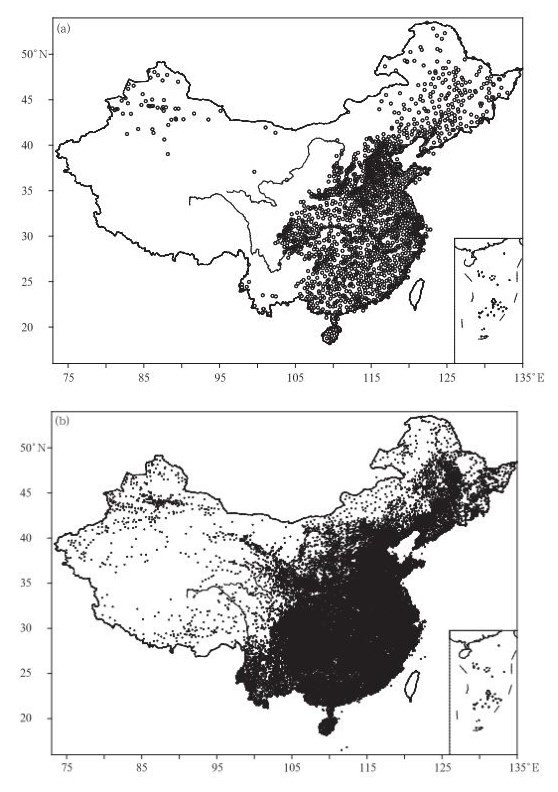
图 1 检验站、加密自动雨量站分布
(a) 海拔低于1000 m的1887个检验站 (空心圆) 的分布,(b) 根据2009—2010年资料得到的加密自动雨量站分布
Fig. 1 The distribution of the verification stations, the automatic meteorological observation stations (AMOSs)
(a) the distribution of 1887 verification stations (circles), (b) the distribution of the AMOSs obtained from the automatic observations during 2009 and 2010
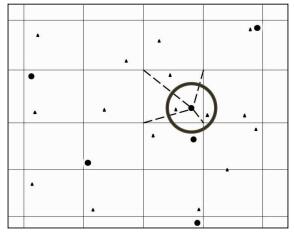
图 2 点对面检验示意
(网格代表分析格点场,黑色实心点表示用于检验的常规地面气象站 (检验站),黑色三角表示加密自动雨量站,圆圈表示所能搜索的范围)
Fig. 2 Schematic diagram of the point-area verification method
(the lattice field indicates the numerical analysis field, the solid black dots represent the basic datum station, verification stations, and the gray triangles are the AMOSs, the black circle denotes the searching coverage around verification stations)
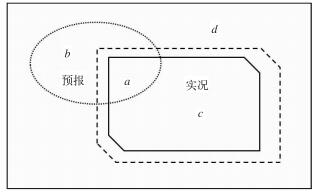
图 3 点对面检验对a,b,c和d的影响示意
(外部方框表示样本空间,椭圆虚线表示预报空间,不规则多边形实线表示实况空间,不规则虚线多边形 表示采用点对面检验时被扩大了的实况空间)
Fig. 3 Sketch map of a, b, c and d affected by the point-area verification
(the black box represents the total sample space, the dotted ellipse indicates the forecast field while the solid black polygon represents the observational field, the dashed polygon is the observational field with the point-area verification method, the observational field of the point-area is definitely enlarged)
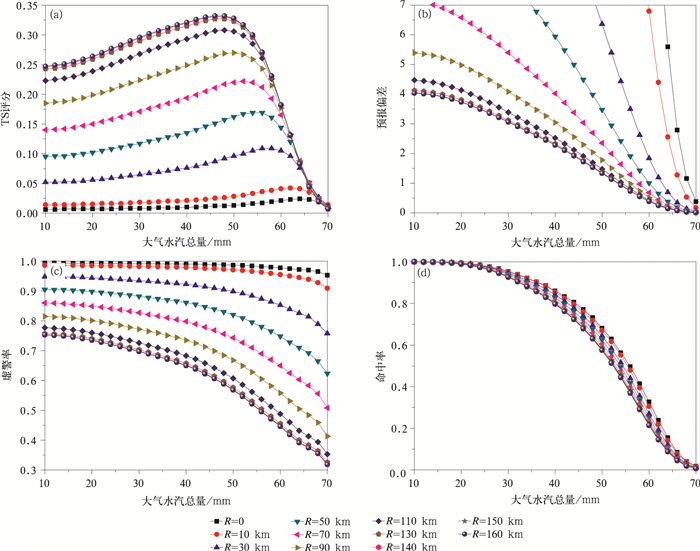
图 4 加密自动雨量站的短时强降水记录数阈值为1时,检验指标随搜索半径和大气水汽总量的变化
(R=0表示使用严格点对点检验时的结果) (a) TS评分,(b) 预报偏差,(c) 虚警率,(d) 命中率
Fig. 4 Variation of scores with the searching radius and total precipitable water when the basic datum station is considered a short-duration heavy rainfall record while at least one AMOS has a record of short-duration heavy rainfall reported
(R=0 represents results obtained with the traditional point-point verification method) (a) threat scores, (b) bias, (c) false alarm ratio, (d) hit rate

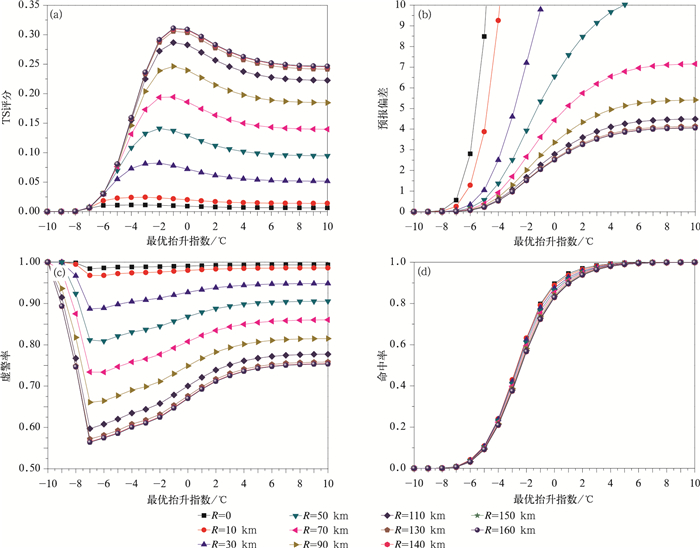
图 5 设定搜索半径为140 km时,检验指标随记录数阈值和大气水汽总量的变化
(R=0表示使用点对点检验时的结果) (a) TS评分,(b) 预报偏差,(c) 虚警率,(d) 命中率
Fig. 5 Scores variation with the total precipitable water and the AMOS number of short-duration heavy rainfallwith 140 km searching radius
(R=0 represents results obtained with the traditional point-point verification method) (a) threat scores, (b) bias, (c) false alarm ratio, (d) hit rate
表 1 部分物理量名称和单位
Table 1 Names and units of parameters
物理量名称 单位 大气水汽总量 mm 比湿 g·kg-1 相对湿度 % 水汽通量散度 g·s-1·cm-2·hPa-1 温度平流 K·s-1 涡度平流 s-2 风场散度 s-1 垂直风切变 m·s-1 最佳对流有效位能 J·kg-1 850 hPa与500 hPa温差 ℃ 850 hPa温度 ℃ (最优)抬升指数 ℃ 总指数 ℃ K指数 ℃ 沙氏指数 ℃ 假相当位温 K  下载: 导出CSV
表 2 设定搜索半径和记录数阈值分别为140 km和2时,按照TS评分从大到小排列的不同物理量的评分和阈值
Table 2 Parameters listed in descending order of TS, all the scores are obtained with the setting of 140 km searching radius and at least two AMOSs short-duration heavy rainfall reported
物理量 最佳阈值 单位 T B F H 大气水汽总量 52 mm 0.275 1.645 0.653 0.570 K指数 35 ℃ 0.275 1.596 0.649 0.560 850 hPa比湿 13 g·kg-1 0.263 1.542 0.657 0.629 850 hPa假相当位温 342 K 0.261 1.860 0.682 0.591 700 hPa假相当位温 342 K 0.256 1.938 0.691 0.599 925 hPa比湿 15 g·kg-1 0.248 1.705 0.685 0.537 925 hPa假相当位温 348 K 0.235 1.564 0.688 0.488 沙氏指数 0 ℃ 0.235 1.714 0.699 0.516 最佳对流有效位能 500 J·kg-1 0.226 1.972 0.722 0.548 700 hPa相对湿度 80 % 0.215 1.882 0.729 0.510 抬升指数 -3 ℃ 0.213 1.523 0.709 0.443 最优抬升指数 -3 ℃ 0.205 1.403 0.709 0.409 850 hPa相对湿度 85 % 0.192 1.363 0.721 0.380 925 hPa水汽通量散度 -1×10⁻⁷ g·s-1·cm-2·hPa-1 0.180 1.308 0.731 0.352 850 hPa水汽通量散度 -1×10⁻⁷ g·s-1·cm-2·hPa-1 0.149 1.006 0.741 0.260 700 hPa水汽通量散度 0×10-7 g·s-1·cm-2·hPa-1 0.151 2.938 0.824 0.516 925 hPa散度 -1×10⁻⁵ s-1 0.147 1.048 0.750 0.262 925 hPa温度平流 5×10⁻⁶ K·s-1 0.144 1.621 0.797 0.329 850 hPa温度平流 10×10-6 K·s-1 0.143 1.607 0.797 0.326 500 hPa温度平流 10×10-6 K·s-1 0.136 1.724 0.811 0.326 500 hPa温度 20 ℃ 0.129 1.401 0.805 0.273 0~3 km垂直风切变 7 m·s-1 0.129 1.705 0.818 0.310 500 hPa涡度平流 2×10⁻¹⁰ s-2 0.120 1.734 0.831 0.293 925 hPa涡度平流 0×10-10 s-2 0.119 1.746 0.833 0.291 总指数 44 ℃ 0.117 1.444 0.823 0.255 0~1 km垂直风切变 7 m·s-1 0.117 1.260 0.812 0.236 850 hPa散度 -1×10⁻⁵ s-1 0.116 0.842 0.773 0.191 850 hPa涡度平流 1×10⁻¹⁰ s-2 0.114 1.558 0.832 0.261 0~6 km垂直风切变 11 m·s-1 0.089 1.609 0.867 0.214 850 hPa与500 hPa温差 24 ℃ 0.072 1.838 0.896 0.191
下载: 导出CSV
-
[1] 陶诗言.中国之暴雨.北京:科学出版社, 1980. [2] 陈炯, 郑永光, 张小玲, 等.中国暖季短时强降水分布和日变化特征及其与中尺度对流系统日变化关系分析.气象学报, 2013, 71(3):367-382. doi: 10.11676/qxxb2013.035 [3] 田付友, 郑永光, 毛冬艳, 等.基于Γ函数的暖季小时降水概率分布.气象, 2014, 40(7):787-795. doi: 10.7519/j.issn.1000-0526.2014.07.002 [4] Doswell Ⅲ C A.Short-range Forecasting.Mesoscale Meteorology and Forecasting//Ray P E.Boston:American Meteorological Society, 1986. [5] Etherton B, Santos P.Sensitivity of WRF forecasts for south Florida to initial conditions.Wea Forecasting, 2008, 23:725-740. doi: 10.1175/2007WAF2006115.1 [6] Torn R D, Hakim G J. Initial condition sensitivity of western Pacific extratropical transitions determined using ensemble-based sensitivity analysis.Mon Wea Rev, 2009, 137:3388-3406. doi: 10.1175/2009MWR2879.1 [7] 常越, 薛纪善, 何金海.水汽场初值调整及其对华南降水预报贡献的研究.应用气象学报, 2000, 11(1):35-46. http://qikan.camscma.cn/jams/ch/reader/view_abstract.aspx?file_no=20000107&flag=1 [8] 管成功, 陈起英, 王娟, 等.初值中云变量对T213预报性能的影响.应用气象学报, 2007, 18(5):594-600. doi: 10.11898/1001-7313.20070514 [9] 王金成, 龚建东, 邓莲堂. GNSS反演资料在GRAPES_Meso三维变分中的应用.应用气象学报, 2014, 25(6):654-668. doi: 10.11898/1001-7313.20140602 [10] 高郁东, 万齐林, 薛纪善, 等, 等.同化雷达估算降水率对暴雨预报的影响.应用气象学报, 2015, 26(1):45-56. http://qikan.camscma.cn/jams/ch/reader/view_abstract.aspx?file_no=20150105&flag=1 [11] Molinari J, Dudek M.Parameterization of convective precipitation in mesoscale numerical models:A critical review.Mon Wea Rev, 1992, 120:326-344. doi: 10.1175/1520-0493(1992)120<0326:POCPIM>2.0.CO;2 [12] 沈新勇, 黄文彦, 王卫国, 等.利用TWP-ICE试验资料对比两种边界层参数化方案.应用气象学报, 2014, 25(4):385-396. doi: 10.11898/1001-7313.20140401 [13] Davies H C. Limitations of some common lateral boundary schemes used in regional NWP models.Mon Wea Rev, 1983, 111:1002-1012. doi: 10.1175/1520-0493(1983)111<1002:LOSCLB>2.0.CO;2 [14] Miller R C.Notes on Analysis and Severe-storm Forecasting Procedures of the Air Force Global Weather Central.Air Weather Service (MAC), USAF, Technical Report 200(Rev), 1972:1-183. [15] Doswell C A, Brooks H E, Maddox R A.Flash flood forecasting:An ingredients-based methodology.Wea Forecasting, 1996, 11:560-581. doi: 10.1175/1520-0434(1996)011<0560:FFFAIB>2.0.CO;2 [16] Martín F, Riosalido R, Esteban L de.The Sigüenza tornado:A case study based on convective ingredients concept and conceptual models.Meteorol Appl, 1997, 4:191-206. doi: 10.1017/S1350482797000479 [17] 张小玲, 陶诗言, 孙建华.基于"配料"的暴雨预报.大气科学, 2010, 34(4):754-756. http://www.cnki.com.cn/Article/CJFDTOTAL-DQXK201004009.htm [18] 国家气象中心. 中尺度天气分析业务技术规范. 2013: 1-31. [19] Rasmussen E N, Blanchard A O.A baseline climatology of sounding-derived supercell and tornado forecast parameters.Wea Forecasting, 1998, 13:1148-1164. doi: 10.1175/1520-0434(1998)013<1148:ABCOSD>2.0.CO;2 [20] Kunz M.The skill of convective parameters and indices to predict isolated and severe thunderstorms.Nat Hazards Earth Syst Sci, 2007, 7:327-342. doi: 10.5194/nhess-7-327-2007 [21] Haklander A J, Delden A Van.Thunderstorm predictors and their forecast skill for the Netherlands.Atmos Res, 2003, 67-68:273-299. http://www.sciencedirect.com/science/article/pii/S0169809503000565 [22] Tian F Y, Zheng Y G, Zhang T, et al.Statistical characteristics of environmental parameters for warm season short-duration heavy rainfall over central and eastern China.J Meteor Res, 2015, 29, doi: 10.1007/s13351-014-4119-y. [23] 任芝花, 赵平, 张强, 等.适用于全国自动站小时降水资料的质量控制方法.气象, 2010, 36(7):123-132. doi: 10.7519/j.issn.1000-0526.2010.07.019 [24] 黄卓.气象预报产品质量评分系统.北京:中国气象局预测减灾司, 2001:9-11. [25] Hilliker J L.The sensitivity of the number of correctly forecasted events to the threat score:A practical application.Wea Forecasting, 2004, 19:646-650. doi: 10.1175/1520-0434(2004)019<0646:TSOTNO>2.0.CO;2 [26] Wilks D S.Statistical Methods in the Atmospheric Sciences (3rd).New York:Academic Press, 2011:301-391. -


 点击查看大图
计量
- 摘要浏览量: 3557
- HTML全文浏览量: 1570
- PDF下载量: 713
- 被引次数: 0
