
 设为首页
设为首页 加入收藏
加入收藏

Assessment of Open Biomass Burning Impacts on Surface PM2.5 Concentration
-
摘要: 利用MODIS火点、土地类型、植被覆盖、生物质载荷和排放因子等数据产品,开发了露天生物质燃烧排放模型,并将其嵌入空气质量模式WRF-CUACE,通过敏感性试验定量评估了露天生物质燃烧对中国地面PM2.5浓度的影响。研究设计了3种模拟方案,比较模式评估结果发现修订后的方案能更好地模拟PM2.5浓度。结果表明:2014年10月露天生物质燃烧主要集中在我国东北、华南和西南地区,其对PM2.5月平均浓度的贡献达30~60 μg·m-3,局地甚至超过100 μg·m-3;华北、华东和华南地区生物质燃烧对PM2.5月平均浓度的贡献达5~20 μg·m-3。从相对贡献看,东北大部分地区生物质燃烧对地面PM2.5浓度的贡献超过50%,华南地区达20%~50%,西南局部地区甚至超过60%;华北、华中以及华东地区相对较低,平均相对贡献达10%~20%。生物质燃烧越严重的地区,其产生的PM2.5中二次气溶胶的贡献占比越小,反之亦然。Abstract: Open biomass burning plays an important role in the formation of heavy pollution events during harvest seasons in China by releasing gases and particulate matters into the atmosphere. A better understanding of open biomass burning in China is required to assess its impacts on the air quality and especially on heavy haze pollution.By using datasets of MODIS fire spot, land cover, vegetation cover, biomass loading and emission factors, a biomass emission model is developed, which is then embedded to an air quality model (WRF-CUACE) to quantitatively assess impacts of biomass burning on surface PM2.5 concentration in China through sensitivity tests. Three simulation scenarios are designed to ensure that simulation results of revised scenarios are closer to actual atmospheric conditions according to the model evaluation. Results show that in October 2014, Northeast, South and Southwest China are regions of the largest contribution to biomass burning with the average monthly increased concentration of PM2.5 up to 30-60 μg·m-3, and even more than 100 μg·m-3 at local regions. In North, East and South China, biomass burning generally provides a contribution of PM2.5 concentration of 5-20 μg·m-3. In terms of the percentage of relative contribution, the value in Northeast China exceeds 50% in most regions. In South China, the relative contribution of biomass burning reaches 20%-50%, and even exceeds 60% in parts of Southwest China. While in North, Central and East China, the relative contribution of biomass burning is generally 10%-20%. In addition, the contribution of secondary aerosols in PM2.5 from biomass burning is also estimated. A group of sensitivity experiments are set up, with and without the gas emission from biomass burning. In Northeast China, the contribution concentration of secondary aerosols is only 0-10 μg·m-3, significantly lower than that in North, Central, East and South China, where the contribution concentration of secondary aerosols could reach 5-15 μg·m-3. In terms of the percentage of contribution to secondary aerosols in PM2.5 from biomass burning, the value in Northeast China is the lowest, which is less than 30% in most regions. And in South and Southwest China, the contribution percentage is relatively larger, which can reach 30%-50%. While in North, Central, East China and vast remote areas, the contribution percentage almost exceed 70%. Based on the above analysis, it is found that the percentage of secondary aerosols in PM2.5 from biomass burning drops when the biomass burning grows.
-
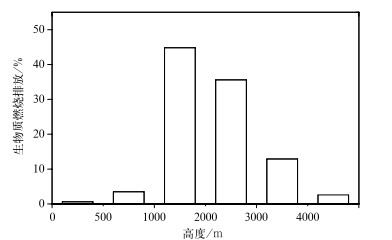
图 1 森林燃烧排放在垂直方向的分布
Fig. 1 Vertical distribution of biomass burning emissions from vegetation type of forest

图 2 模式的模拟区域(第2层)和所选城市站点的位置
Fig. 2 Model domain (the second one) and location of observation stations

图 3 2014年10月所选10个城市站点在3种模拟方案下观测和模拟的PM2.5日平均浓度
Fig. 3 The observed and simulated daily mean surface PM2.5 concentration of three scenarios at 10 stations during 1-31 Oct 2014
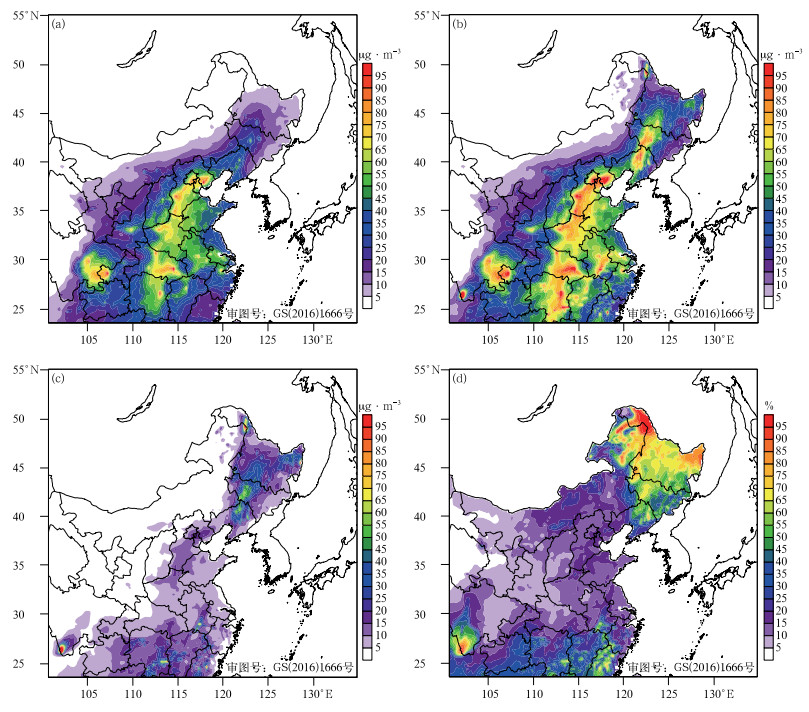
图 4 2014年10月地面PM2.5月平均浓度分布及生物质燃烧对PM2.5的贡献
(a)SIM1方案模拟的PM2.5浓度, (b)SIM3方案模拟的PM2.5浓度, (c)生物质燃烧对PM2.5的贡献值, (d)生物质燃烧对PM2.5的相对贡献百分比
Fig. 4 Distributions of averaged surface PM2.5 concentration and contribution from biomass burning in Oct 2014
(a)simulated PM2.5 concentration from SIM1, (b)simulated PM2.5 concentration from SIM3, (c)contribtution from biomass burning, (d)percentage of contribtution from biomass burning
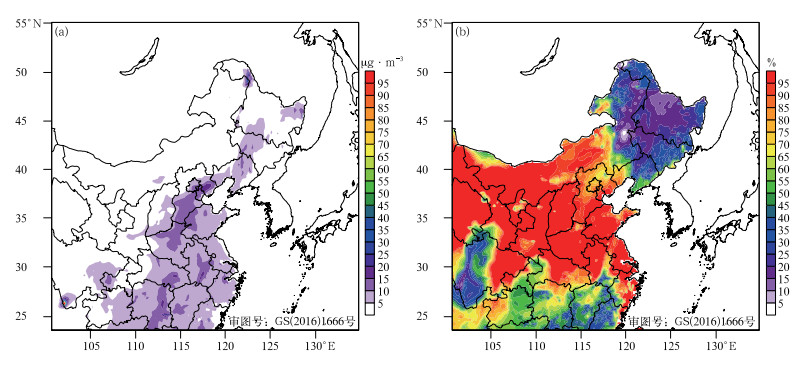
图 5 生物质燃烧产生的PM2.5中二次气溶胶浓度的贡献值(a)和相对贡献百分比(b)
Fig. 5 Contribution(a) and percentage of contribution(b) of secondary aerosols in PM2.5 from biomass burning
表 1 不同植被覆盖类型对应的生物质载荷和排放因子
Table 1 Biomass loadings and emission factors for different land cover types
植被类型 木质类燃料载荷/
(kg·m-2)草本类燃料载荷/
(kg·m-2)CO/(g·kg-1) PM2.5/(g·kg-1) OC/(g·kg-1) BC/(g·kg-1) 常绿针叶林 28.61 4.79 118 13.0 7.8 0.20 常绿阔叶林 19.45 5.17 92 9.7 4.7 0.52 落叶针叶林 15.46 5.48 118 13.0 7.8 0.20 落叶阔叶林 19.50 4.73 102 13.0 9.2 0.56 混交林 19.98 7.93 102 13.0 9.2 0.56 稠密灌丛 4.80 1.24 68 9.3 6.6 0.50 稀疏灌丛 2.63 0.82 68 9.3 6.6 0.50 木本稀树草原 12.51 3.07 68 9.3 6.6 0.50 稀树草原 10.51 2.89 59 5.4 2.6 0.37 草地 2.62 1.40 59 5.4 2.6 0.37 永久湿地 8.34 10.14 59 5.4 2.6 0.37 农田 0 0.66 111 5.8 3.3 0.69 农田/自然植被混合 8.87 2.97 59 5.4 2.6 0.37 贫瘠或稀疏植被 1.18 0.48 59 5.4 2.6 0.37  下载: 导出CSV
表 2 气象要素的观测值与模拟值统计
Table 2 Statistics of observed and simulated meteorological elements
站点 要素 观测值 模拟值 平均偏差 均方根误差 相关系数 北京 气温/℃ 14.1 13.8 -0.3 2.1 0.90 相对湿度/% 64.0 56.8 -7.2 14.4 0.87 风速/(m·s-1) 1.7 1.9 0.2 0.9 0.70 济南 气温/℃ 17.1 17.9 0.7 1.6 0.94 相对湿度/% 56.9 48.2 -8.8 12.2 0.92 风速/(m·s-1) 2.8 2.9 0.1 1.2 0.70 石家庄 气温/℃ 15.4 15.8 0.5 2.8 0.82 相对湿度/% 68.9 52.2 -16.7 22.8 0.70 风速/(m·s-1) 0.9 2.0 1.0 1.5 0.38 合肥 气温/℃ 19.1 20.4 1.3 1.8 0.94 相对湿度/% 73.6 57.5 -16.1 19.0 0.82 风速/(m·s-1) 1.8 2.4 0.6 1.0 0.70 南京 气温/℃ 19.0 19.8 0.8 1.2 0.97 相对湿度/% 72.9 60.5 -12.4 14.7 0.90 风速/(m·s-1) 2.4 2.3 -0.1 0.9 0.80 上海 气温/℃ 20.2 20.7 0.5 1.1 0.95 相对湿度/% 68.3 64.3 -4.0 8.2 0.88 风速/(m·s-1) 2.6 3.2 0.6 1.2 0.79 郑州 气温/℃ 17.8 19.2 1.3 2.0 0.92 相对湿度/% 64.8 47.4 -17.4 20.7 0.85 风速/(m·s-1) 1.7 2.5 0.8 1.3 0.63 沈阳 气温/℃ 10.9 10.5 -0.4 2.3 0.94 相对湿度/% 55.7 59.8 4.0 14.0 0.83 风速/(m·s-1) 2.4 3.4 1.0 1.7 0.67 长春 气温/℃ 8.6 9.2 0.6 1.9 0.96 相对湿度/% 52.3 46.3 -6.0 14.8 0.77 风速/(m·s-1) 2.8 3.3 0.4 1.2 0.84 哈尔滨 气温/℃ 6.4 5.4 -0.9 2.1 0.95 相对湿度/% 55.3 52.8 -2.5 14.3 0.79 风速/(m·s-1) 2.7 3.4 0.7 1.4 0.81
下载: 导出CSV
表 3 地面PM2.5浓度观测值和SIM1方案模拟值的统计量
Table 3 Statistics of PM2.5 between observation and simulation from SIM1
站点 平均值/(μg·m-3) 相关系数 平均偏差/
(μg·m-3)均方根误差/
(μg·m-3)平均相对偏差/% 平均相对误差/% 观测 模拟 北京 116.1 81.6 0.84 -34.5 59.3 -31.8 35.1 济南 71.6 53.4 0.46 -18.3 33.8 -27.4 37.7 石家庄 161.2 83.3 0.77 -77.8 104.8 -56.4 56.5 合肥 78.0 63.0 0.53 -15.0 35.0 -17.7 32.2 南京 69.7 52.8 0.79 -16.9 25.1 -26.5 31.2 上海 51.8 41.5 0.66 -19.9 21.9 -24.6 40.2 郑州 113.9 68.6 0.75 -45.4 53.8 -49.2 49.2 沈阳 88.1 63.1 0.66 -25.0 70.7 -14.3 40.4 长春 155.4 51.4 0.62 -104.0 135.5 -85.7 85.8 哈尔滨 147.6 33.7 0.55 -113.9 188.4 -83.0 83.0
下载: 导出CSV
表 4 地面PM2.5浓度观测值和SIM2方案模拟值的统计量
Table 4 Statistics of PM2.5 between observation and simulation from SIM2
站点 平均值/(μg·m-3) 相关系数 平均偏差/
(μg·m-3)均方根误差/
(μg·m-3)平均相对偏差/% 平均相对误差/% 观测 模拟 北京 116.1 86.6 0.84 -29.4 55.3 -28.0 32.8 济南 71.6 55.4 0.45 -16.2 33.4 -24.0 37.1 石家庄 161.2 87.5 0.76 -73.7 101.6 -52.7 54.6 合肥 78.0 64.8 0.55 -13.2 33.9 -15.1 30.7 南京 69.7 55.4 0.84 -14.3 21.6 -22.7 27.9 上海 51.8 42.6 0.69 -17.8 20.7 -22.3 38.5 郑州 113.9 70.3 0.75 -38.3 52.4 -46.8 46.8 沈阳 88.1 69.5 0.69 -21.1 67.0 -5.1 36.8 长春 155.4 58.5 0.77 -97.0 126.9 -77.0 77.1 哈尔滨 147.6 39.5 0.73 -108.1 179.6 -76.2 76.3
下载: 导出CSV
表 5 地面PM2.5浓度观测值和SIM3方案模拟值的统计量
Table 5 Statistics of PM2.5 between observation and simulation from SIM3
站点 平均值/(μg·m-3) 相关系数 平均偏差/
(μg·m-3)均方根误差/
(μg·m-3)平均相对偏差/% 平均相对误差/% 观测 模拟 北京 116.1 97.9 0.85 -18.2 48.3 -17.9 28.7 济南 71.6 60.5 0.41 -11.1 32.8 -15.9 36.7 石家庄 161.2 95.8 0.76 -65.4 94.0 -45.2 48.4 合肥 78.0 72.3 0.64 -5.7 29.2 -5.4 27.4 南京 69.7 61.3 0.85 -8.4 17.8 -13.8 22.8 上海 51.8 46.6 0.74 -5.2 18.6 -14.0 34.5 郑州 113.9 78.1 0.71 -35.8 47.4 -37.2 38.6 沈阳 88.1 93.4 0.57 5.3 67.5 21.3 40.1 长春 155.4 91.2 0.73 -64.2 96.2 -43.0 47.9 哈尔滨 147.6 71.1 0.79 -76.5 134.9 -45.8 50.7
下载: 导出CSV
-
[1] Dennis A, Fraser M, Anderson S, et al.Air pollutant emissions associated with forest, grassland, and agricultural burning in Texas.Atmos Environ, 2002, 36(23):3779-3792. doi: 10.1016/S1352-2310(02)00219-4 [2] 杨占婷, 白永清, 陈英英, 等.鄂中东部两次秸秆焚烧引发的严重灰霾天气分析.气象科技, 2013, 41(6):1147-1152. doi: 10.3969/j.issn.1671-6345.2013.06.032 [3] 郑晓燕, 刘咸德, 赵峰华, 等.北京市大气颗粒物中生物质燃烧排放贡献的季节特征.中国科学(B辑), 2005, 35(4):346-352. http://d.old.wanfangdata.com.cn/Periodical/zgkx-cb200504014 [4] 李令军, 王英, 张强, 等.麦秸焚烧对北京市空气质量影响探讨.中国科学(D辑), 2008, 38(2):232-242. doi: 10.3321/j.issn:1006-9267.2008.02.009 [5] Pope C A, Dockery D W.Health effects of fine particulate air pollution:Lines that connect.Journal of the Air & Waste Management Association, 2012, 56(6):709-742. doi: 10.1080-10473289.2006.10464485/ [6] Li M, Wang T, Xie M, et al.Agricultural fire impacts on ozone photochemistry over the Yangtze River Delta Region, East China.J Geophys Res Atmos, 2018, 123(12):6605-6623. doi: 10.1029/2018JD028582 [7] Wiedinmyer C, Neff J C.Estimates of CO2 from fires in the United States:Implications for carbon management.Carbon Balance Manag, 2007, 2(1):1-12. doi: 10.1186/1750-0680-2-1 [8] Field R D, van der Werf G R, Fanin T, et al.Indonesian fire activity and smoke pollution in 2015 show persistent nonlinear sensitivity to El Nino-induced drought.Proc Natl Acad Sci U S A, 2016, 113(33):9204-9209. doi: 10.1073/pnas.1524888113 [9] van der Werf G R, Randerson J T, Giglio L, et al.Global fire emissions and the contribution of deforestation, savanna, forest, agricultural, and peat fires (1997-2009).Atmos Chem Phys, 2010, 10(23):11707-11735. doi: 10.5194/acp-10-11707-2010 [10] Kaiser J W, Heil A, Andreae M O, et al.Biomass burning emissions estimated with a global fire assimilation system based on observed fire radiative power.Biogeosciences, 2012, 9(1):527-554. doi: 10.5194/bg-9-527-2012 [11] Wiedinmyer C, Akagi S K, Yokelson R J, et al.The Fire INventory from NCAR (FINN):A high resolution global model to estimate the emissions from open burning.Geoscientific Model Development, 2011, 4(3):625-641. doi: 10.5194/gmd-4-625-2011 [12] Mieville A, Granier C, Liousse C, et al.Emissions of gases and particles from biomass burning during the 20th century using satellite data and an historical reconstruction.Atmos Environ, 2010, 44(11):1469-1477. doi: 10.1016/j.atmosenv.2010.01.011 [13] Shi Y, Yamaguchi Y.A high-resolution and multi-year emissions inventory for biomass burning in Southeast Asia during 2001-2010.Atmos Environ, 2014, 98:8-16. doi: 10.1016/j.atmosenv.2014.08.050 [14] Huang X, Li M, Li J, et al.A high-resolution emission inventory of crop burning in fields in China based on MODIS thermal anomalies/fire products.Atmos Environ, 2012, 50:9-15. doi: 10.1016/j.atmosenv.2012.01.017 [15] Liu M, Song Y, Yao H, et al.Estimating emissions from agricultural fires in the North China Plain based on MODIS fire radiative power.Atmos Environ, 2015, 112:326-334. doi: 10.1016/j.atmosenv.2015.04.058 [16] 程兴宏, 徐祥德, 陈尊裕, 等.北京地区PM10浓度空间分布特征的综合变分分析.应用气象学报, 2007, 18(2):165-172. doi: 10.3969/j.issn.1001-7313.2007.02.005 [17] 徐敬, 丁国安, 颜鹏, 等.北京地区PM2.5的成分特征及来源分析.应用气象学报, 2007, 18(5):645-654. doi: 10.3969/j.issn.1001-7313.2007.05.009 [18] 颜鹏, 刘桂清, 周秀骥, 等.上甸子秋冬季雾霾期间气溶胶光学特性.应用气象学报, 2010, 21(3):257-265. doi: 10.3969/j.issn.1001-7313.2010.03.001 [19] 张小曳, 张养梅, 曹国良.北京PM1中的化学组成及其控制对策思考.应用气象学报, 2012, 23(3):257-264. doi: 10.3969/j.issn.1001-7313.2012.03.001 [20] 靳军莉, 颜鹏, 马志强, 等.北京及周边地区2013年1-3月PM2.5变化特征.应用气象学报, 2014, 25(6):690-700. http://qikan.camscma.cn/jamsweb/article/id/20140605 [21] 徐敬, 马志强, 赵秀娟, 等.边界层方案对华北低层O3垂直分布模拟的影响.应用气象学报, 2015, 26(5):567-577. doi: 10.11898/1001-7313.20150506 [22] 徐敬, 张小玲, 蔡旭晖, 等.基于敏感源分析的动态大气污染排放方案模拟.应用气象学报, 2016, 27(6):654-665. doi: 10.11898/1001-7313.20160602 [23] 徐晓斌.我国霾和光化学污染观测研究进展.应用气象学报, 2016, 27(5):604-619. doi: 10.11898/1001-7313.20160509 [24] Zhang H F, Ye X N, Cheng T T, et al.A laboratory study of agricultural crop residue combustion in China:Emission factors and emission inventory.Atmos Environ, 2008, 42(36):8432-8441. doi: 10.1016/j.atmosenv.2008.08.015 [25] Zhou Y, Han Z, Liu R, et al.A modeling study of the impact of crop residue burning on PM2.5 concentration in Beijing and Tianjin during a severe autumn haze event.Aerosol and Air Quality Research, 2018, 18:1558-1572. doi: 10.4209/aaqr.2017.09.0334 [26] Cheng Z, Wang S, Fu X, et al.Impact of biomass burning on haze pollution in the Yangtze River delta, China:A case study in summer 2011.Atmos Chem Phys, 2014, 14(9):4573-4585. doi: 10.5194/acp-14-4573-2014 [27] Li X, Xia X, Song J, et al.A case study of long-range transport of smoke aerosols Eastern Siberia to Northeast China in July 2014.Aerosol and Air Quality Research, 2017, 17(4):965-974. doi: 10.4209/aaqr.2016.04.0166 [28] Wang Q, Shao M, Liu Y, et al.Impact of biomass burning on urban air quality estimated by organic tracers:Guangzhou and Beijing as cases.Atmos Environ, 2007, 41(37):8380-8390. doi: 10.1016/j.atmosenv.2007.06.048 [29] Hansen M C, Townshend J R G, Defries R S, et al.Estimation of tree cover using MODIS data at global, continental and regional/local scales.Int J Remote Sens, 2005, 26(19):4359-4380. doi: 10.1080/01431160500113435 [30] Wiedinmyer C, Quayle B, Geron C, et al.Estimating emissions from fires in North America for air quality modeling.Atmos Environ, 2006, 40(19):3419-3432. doi: 10.1016/j.atmosenv.2006.02.010 [31] Ito A, Penner J E.Global estimates of biomass burning emissions based on satellite imagery for the year 2000.J Geophys Res Atmos, 2004, 109(D14), DOI: 10.1029/2003JD004423. [32] Lavoué D, Liousse C, Cachier H, et al.Modeling of carbonaceous particles emitted by boreal and temperate wildfires at northern latitudes.J Geophys Res Atmos, 2000, 105(D22):26871-26890. doi: 10.1029/2000JD900180 [33] Colarco P R, Schoeberl M R, Doddridge B G, et al.Transport of smoke from Canadian forest fires to the surface near Washington, D C:Injection height, entrainment, and optical properties.J Geophys Res Atmos, 2004, 109(D6), DOI: 10.1029/2003jd004248. [34] Debell L J, Talbot R W, Dibb J E, et al.A major regional air pollution event in the northeastern United States caused by extensive forest fires in Quebec, Canada.J Geophys Res Atmos, 2004, 109(D19), DOI: 10.1029/2004JD004840. [35] Gong S L, Zhang X Y.CUACE/Dust-An integrated system of observation and modeling systems for operational dust forecasting in Asia.Atmos Chem Phys, 2008, 8(9):2333-2340. doi: 10.5194/acp-8-2333-2008 [36] Gong S L, Barrie L A, Blanchet J P, et al.Canadian Aerosol Module:A size-segregated simulation of atmospheric aerosol processes for climate and air quality models 1.Module development.J Geophys Res Atmos, 2003, 108(D1), DOI: 10.1029/2001jd002002. [37] West J J, Pilinis C, Nenes A, et al.Marginal direct climate forcing by atmospheric aerosols.Atmos Environ, 1998, 32(14):2531-2542. https://www.sciencedirect.com/science/article/abs/pii/S135223109800003X [38] 何建军, 余晔, 刘娜, 等.复杂地形区陆面资料对WRF模式模拟性能的影响.大气科学, 2014, 38(3):484-498. http://d.old.wanfangdata.com.cn/Periodical/daqikx201403007 [39] Morris R E, Mcnally D E, Tesche T W, et al.Preliminary evaluation of the community multiscale air quality model for 2002 over the Southeastern United States.Journal of the Air & Waste Management Association, 2005, 55(11):1694-1708. http://med.wanfangdata.com.cn/Paper/Detail/PeriodicalPaper_PM16350367 -

 点击查看大图
计量
- 摘要浏览量: 4694
- HTML全文浏览量: 2239
- PDF下载量: 69
- 被引次数: 0
